ONDO Bullish structureOndo is back to bullish scenario. We can see long accumulation more then 100 days. As you can see price 0.9 is back and then bullish coming. So 0.85 and 0.9 have to hold and we can buy the dip.
Keep in mind if Ethereum start to attack ATH, Eth ecosystem will grow much higher. So watch this level in next couple weeks and months.
ONDOUSDT
TradeCityPro | ONDO Builds Strength Beneath Key Supply Barrier👋 Welcome to TradeCity Pro!
In this analysis, I want to review the ONDO coin for you — one of the RWA projects, currently ranked 37th on CoinMarketCap with a market cap of $2.93 billion.
📅 Daily Timeframe
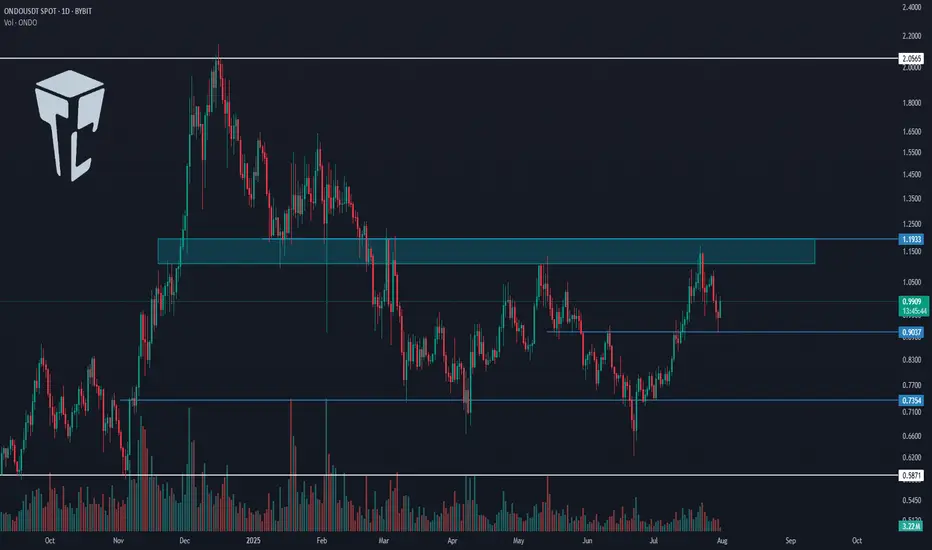
In the daily timeframe, as you can see, this coin has formed a range box between the levels of 0.7354 and 1.1933, and the price is currently sitting in the upper half of this box.
✔️ At the moment, the price is hovering around 0.9037, and it’s forming a higher low above 0.7354. If this low gets confirmed, the probability of breaking above 1.1933 increases.
⭐ The 1.1933 zone is a very significant supply level that was previously acting as support in late 2024, and after being broken, has since acted multiple times as resistance.
📊 If this area breaks, we can open a long position, or even buy this coin in spot. Personally, if this trigger is broken, I’ll open a long-term long position.
✨ The target for this position is 2.0565, and once the price reaches this level, we can take profits and consider a spot buy.
📝 Final Thoughts
This analysis reflects our opinions and is not financial advice.
Share your thoughts in the comments, and don’t forget to share this analysis with your friends! ❤️
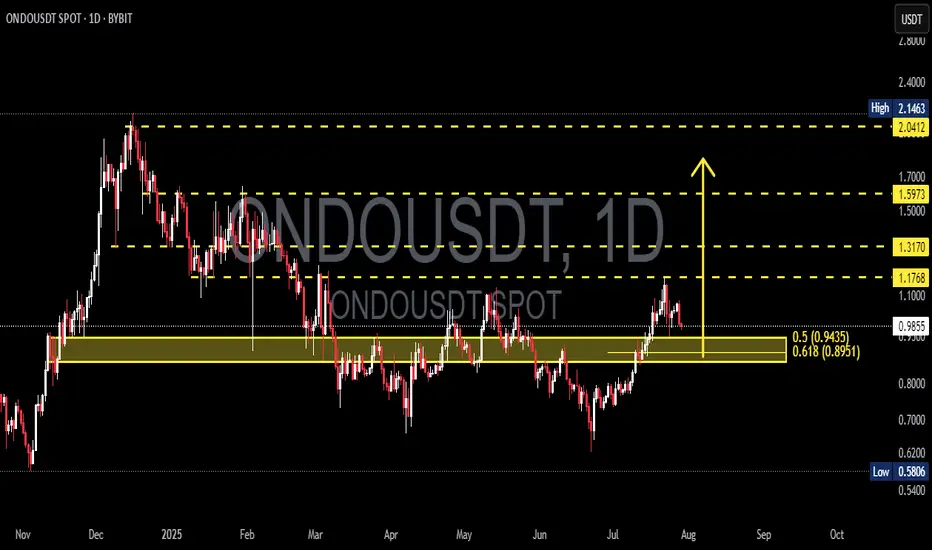
ONDOUSDT at a Critical Fibonacci Zone! Will Move Toward $2+?ONDOUSDT is currently trading at a critical technical zone — the Fibonacci Retracement Golden Pocket (0.5–0.618) — following a significant upward rally. Historically, this zone often acts as a high-probability reversal area, or at the very least, a zone for major consolidation before the next big move.
---
🧠 Market Structure & Price Action
After reaching a local high near $1.17, price retraced and is now approaching the key support zone between $0.9435 (Fib 0.5) and $0.8951 (Fib 0.618).
This zone also coincides with a previous strong resistance, which could now act as new support (role reversal).
Current price action shows selling pressure, but there is no confirmed breakdown from the Golden Pocket yet.
---
🧩 Pattern Recognition & Key Levels
Potential Reversal Pattern: Look for a bullish falling wedge or descending channel on lower timeframes as a signal for reversal.
Demand Zone (Yellow Box): The zone between $0.8951–$0.9435 is reinforced by horizontal price structure support.
Layered Resistance Levels:
$1.1768 → Recent swing high
$1.3170 → Mid-range resistance
$1.5973 → Psychological and retracement target
$2.0412 → Range top / full recovery zone
Minor Support: If the Golden Pocket fails, potential downside targets include $0.70 and the major low at $0.5806.
---
📈 Bullish Scenario
✅ Strong bounce from the Golden Pocket
✅ Bullish candlestick confirmation (e.g., bullish engulfing or pin bar)
✅ Rising volume showing buyer presence
✅ Break above $1.1768 would signal continuation toward:
🎯 Target 1: $1.3170
🎯 Target 2: $1.5973
🎯 Target 3: $2.0412 (full structural recovery)
---
📉 Bearish Scenario
❌ If price breaks below $0.8951 with a strong bearish candle and high volume:
The structure shifts bearish, increasing risk of a drop to $0.70 – $0.62
Worst-case scenario: retest of $0.5806, the major bottom
Bullish structure invalidated upon confirmed breakdown
---
🎯 Strategy & Takeaway
ONDOUSDT is currently in a "make or break" zone. The Golden Pocket between $0.895–$0.943 could either:
Act as a springboard for the next bullish leg,
Or fail, triggering a deeper correction.
Traders should wait for confirmation via:
Candlestick patterns
Volume breakout/inflow
Break above or below the key structure
This area offers a high-reward, controlled-risk setup for swing traders, with invalidation just below the Golden Pocket.
---
📌 Summary of Key Levels
Level Description
$0.9435 Fibonacci 0.5 (support)
$0.8951 Fibonacci 0.618 (Golden Pocket)
$1.1768 Minor resistance
$1.3170 Mid-level resistance
$1.5973 Bullish target
$2.0412 Major resistance / recovery top
$0.5806 Extreme support (macro low)
#ONDOUSDT #CryptoTechnicalAnalysis #GoldenPocket #FibonacciLevels #CryptoTrading #SupportResistance #BullishSetup #BearishScenario #SwingTrade #AltcoinAnalysis
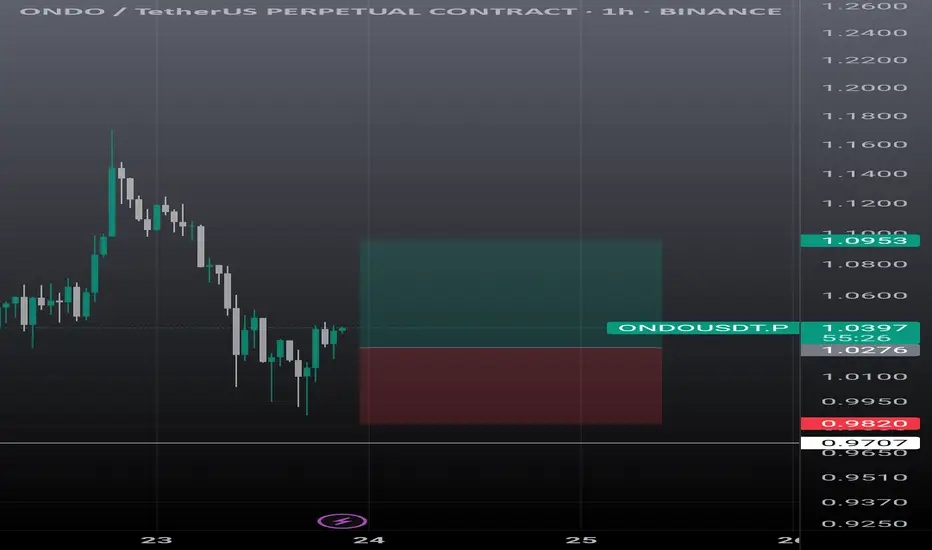
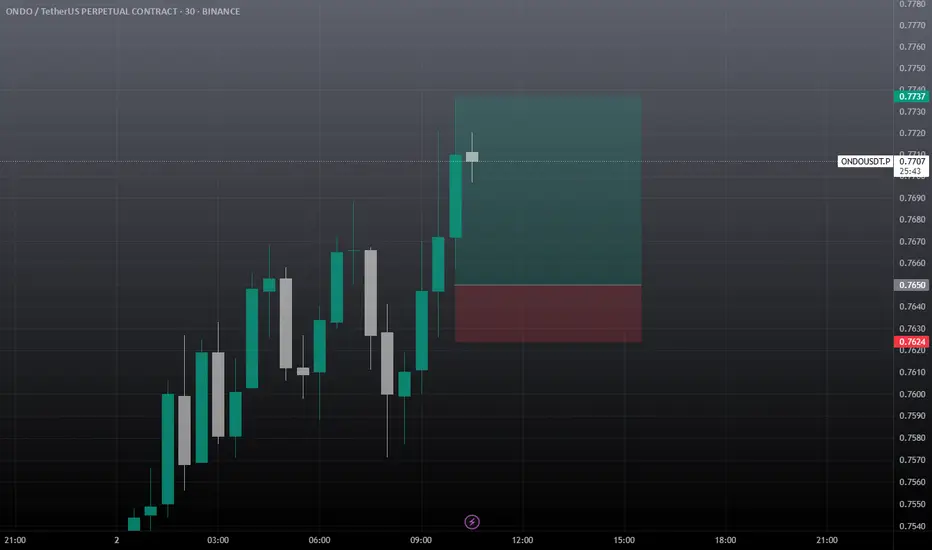
Ondo usdt scalp trade.First entry at current market price, and second one is mentioned, sl just below today low. Tp is mentioned.
ONDOUSDT Daily Chart Analysis | Momentum Shift & Breakout LevelsONDOUSDT Daily Chart Analysis | Momentum Shift & Breakout Levels
🔍 Let’s dive into the ONDO/USDT daily chart and break down the latest momentum signals, key breakout areas, and targets for bulls.
⏳ Daily Chart Overview
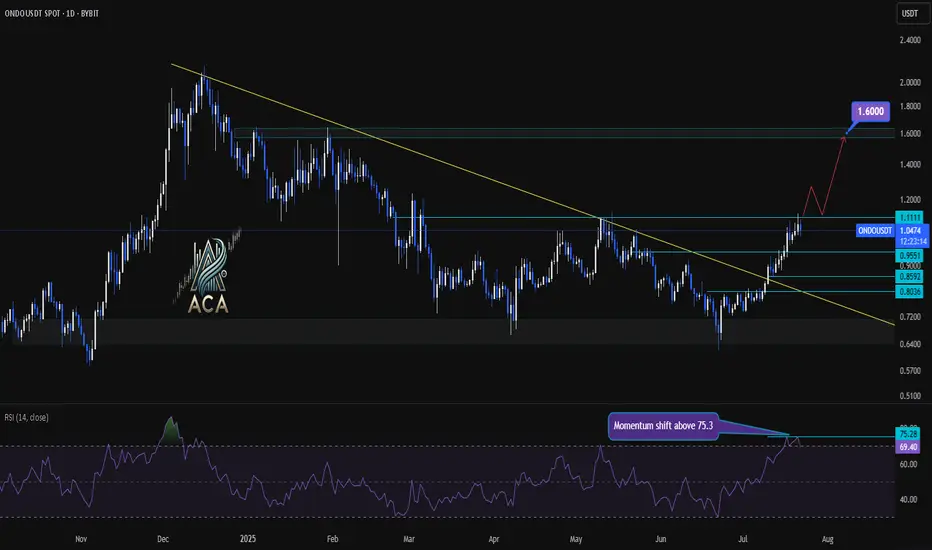
The daily trend shows significant recovery after prolonged downward pressure, with price action now testing critical resistance levels. A key descending trend line has recently been challenged, highlighting a potential shift in market structure.
🔺 Bullish Setup
- Momentum Trigger: The RSI has closed above 75.3, signaling a strong momentum shift and upping the odds for continued upside.
- Breakout Confirmation: Watch for a daily candle close above the $1.1111 resistance level. This would confirm a bullish breakout and could serve as a solid trigger for further upside.
- Trend Line Dynamics: The price has decisively broken above the major descending trend line, which had capped rallies for months—removing a significant area of supply and emboldening bulls.
- Upside Target: Once confirmed, this setup opens the door for an advance towards the $1.60 area, where the next major resistance sits.
📊 Key Highlights
- Daily RSI closing above 75.3 reflects strong market momentum and buyer dominance.
- A daily candle close above $1.1111 can be used as a bullish trigger.
- The long-term descending trend line has been broken, indicating a major momentum shift.
- Immediate upside target stands at $1.60, representing a clear resistance level for profits or further evaluation.
🚨 Conclusion
Momentum is clearly shifting in favor of the bulls as technical barriers fall by the wayside. For traders looking to position long, confirmation above $1.1111 combined with the powerful RSI reading sets the stage for a move towards $1.60—keep these levels on your radar as the setup plays out!
$ONDO For A CondoBYBIT:ONDOUSDT is showing one of the cleanest structures among altcoins right now — attempting to breakout from its accumulation.
We have a strong recovery off the local bottom, reclaiming $1 and showing signs of strength. Could retest $2 or even higher till $2.8
Catalysts:
— U.S. crypto legislation highlights @OndoFinance as institutional-grade
— BNB Chain to integrate tokenized U.S. stocks via Ondo

OndoBullish Reversal in Play – ONDO/USDT Weekly Chart
A clear Inverse Head and Shoulders pattern is forming on the weekly timeframe.
Price is currently breaking out of the neckline with strong momentum.
🔹 Left Shoulder: Formed with consistent volume support
🔹 Head: Deep correction followed by strong recovery
🔹 Right Shoulder: Higher low formation with bullish pressure
📈 Potential Target: $2.51 (+247%)
🛡️ Support Zone: ~$0.58
If this breakout confirms with weekly close above the neckline (~$0.90–$1.00),
we could be seeing the start of a major bull wave.
#ONDO #CryptoAnalysis #InverseHeadAndShoulders #Altseason #Breakout

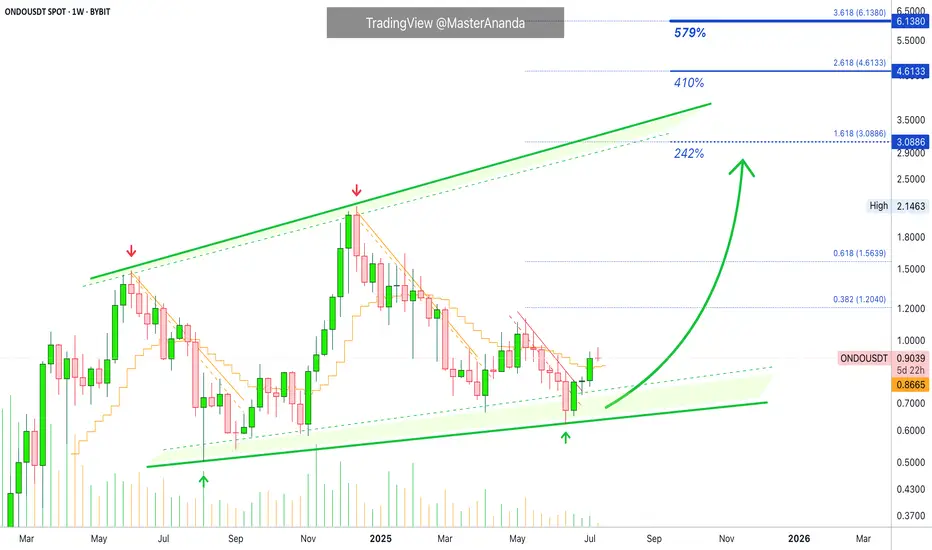
Ondo: The Bullish Wave is Over? 410% - 579% Profits PotentialONDOUSDT managed to produce three weeks closing green with the last one conquering EMA13. When this happened back in November 2024 there was a period of continued growth. Look at it in this way; the week is young and the market is taking a break, growth will resume in a matter of days. This same week more green and continued green long-term.
When ONDOUSDT broke above EMA13 last year, it produced a total of six weeks of straight up. Now, back then we were looking at a small jump, today we are looking at a very strong bullish impulse. The 2025 bull market in full force.
Three green weeks is only the start. We are about to experience 12-24 weeks of bullish action. We are looking at the bottom, bullish momentum is yet to grow. It is still early, but early won't be a reality for too long. Buy and hold.
We have two targets that are interesting: 410% and 579%. These can be hit within 3 to 6 months. Allow for retraces and swings on the way up.
Namaste.
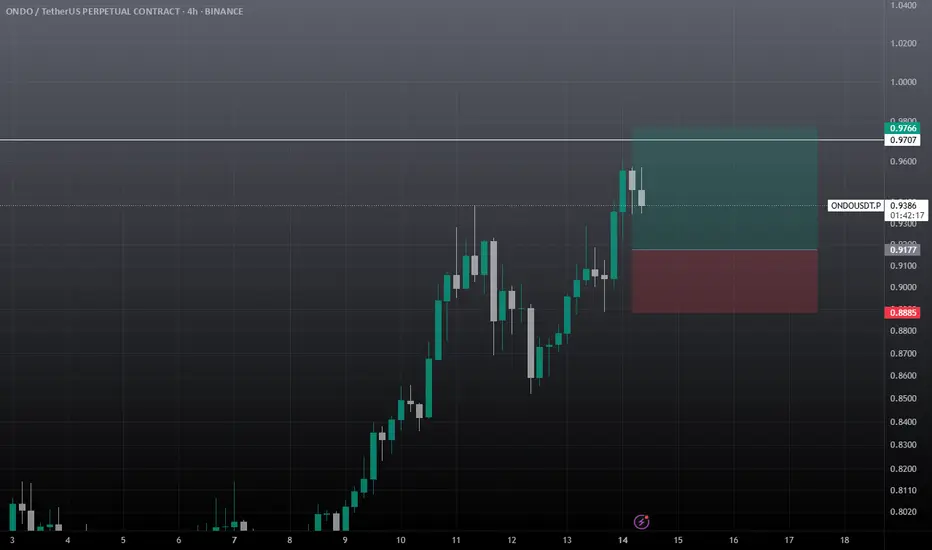
Ondo USDT SCALP TRADEIF this 4hr fvg breaks then I will look for short, otherwise expecting to hold this level and wipe out previous liquidation.
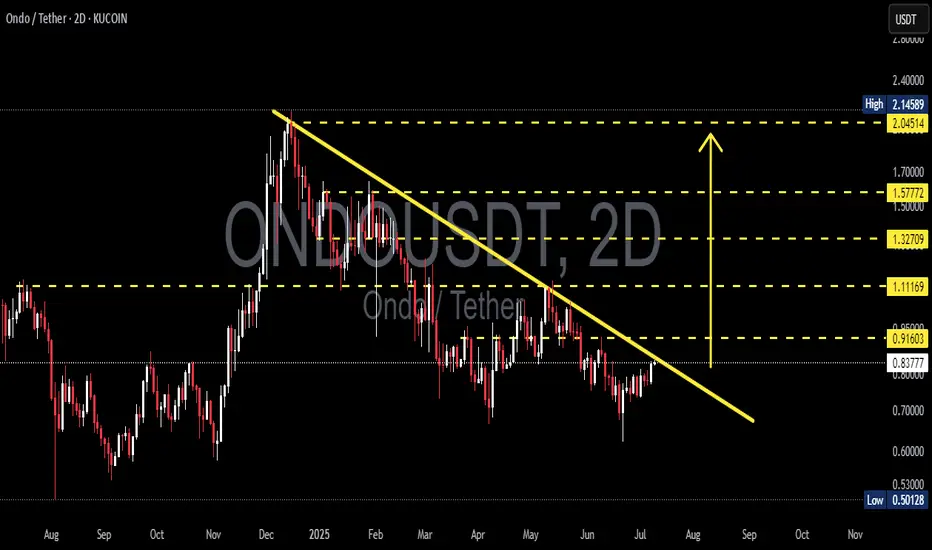
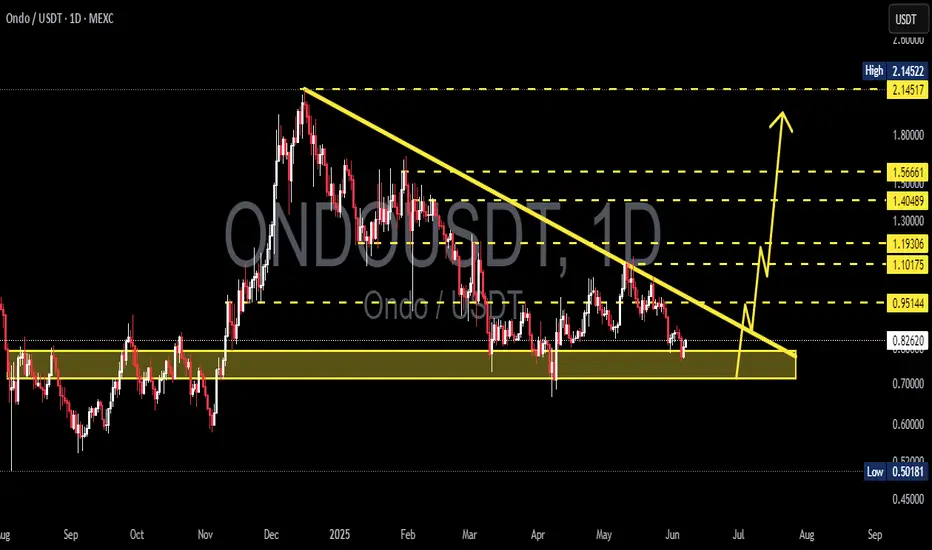
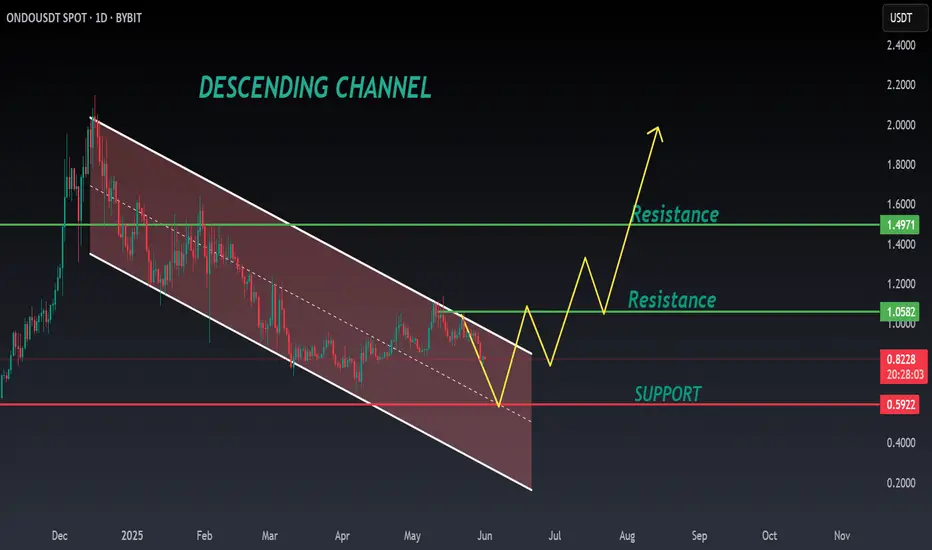
ONDO/USDT Breakout Watch – Reversal Incoming
🔍 Overview:
The ONDO/USDT pair is currently at a critical inflection point. After months of being suppressed in a downtrend, price action is now testing a major descending trendline that has capped the market since the peak in December 2024. A breakout here could be the beginning of an explosive bullish phase — but failure might confirm further downside.
📉 Pattern: Descending Trendline Compression
ONDO has been forming consistent lower highs, creating a clear descending trendline structure.
Price is now pressing against this resistance, attempting a breakout with a strong 2D candle.
A confirmed breakout will occur once ONDO closes above $0.916 on the 2D chart, which also acts as a horizontal resistance.
✅ Bullish Scenario – The Start of a Mid-Term Reversal?
If the breakout is confirmed, we could see strong upward momentum, as there’s relatively little resistance in the upper zones.
🎯 Potential Targets:
1. $1.11 – First psychological and technical resistance.
2. $1.327 – Previous consolidation zone from Feb–Mar 2025.
3. $1.577 – Major supply zone before the heavy correction started.
4. $2.045 - $2.145 – All-time high area, the ultimate mid-to-long-term target.
📈 Note: Although not shown in this chart, RSI is likely leaving oversold territory, supporting the bullish momentum shift.
❌ Bearish Scenario – Classic Bull Trap Ahead?
If price fails to break and close above the trendline and $0.916, this could turn into a fakeout or bull trap.
📉 Possible downside levels:
$0.8399 – Minor support currently holding.
$0.70 – Strong horizontal demand zone.
$0.53 – Long-term support base, potential double bottom zone.
If momentum fades here, ONDO could revisit these lower areas before finding a true bottom.
🧠 Sentiment & Trading Strategy:
Breakout confirmation: Wait for a solid 2D candle close above the descending trendline and $0.916. Look for volume spike.
Conservative strategy: Enter on break + retest of the trendline, with SL below $0.83 and multi-level TPs.
Aggressive strategy: Enter on the initial breakout with dynamic trailing stops and resistance-based targets.
🏁 Conclusion:
ONDO/USDT is at a make-or-break moment. A confirmed breakout from this long-term descending structure may trigger a strong reversal with over 100% potential upside. However, if the market rejects this breakout attempt, it could extend its bearish trajectory.
Patience, confirmation, and disciplined risk management are key here.
📌 Key Levels to Watch:
Support: $0.8399 – $0.70 – $0.53
Resistance: $0.916 – $1.11 – $1.327 – $1.577 – $2.045 – $2.145
#ONDO #ONDOUSDT #CryptoBreakout #BullishSetup #AltcoinAnalysis #CryptoReversal #TradingViewSignals #TechnicalBreakout #DescendingTrendline #PriceAction
ONDOThis this my Candlestick Technical Analysis based on Bullish Engulfing. If we see and Same Pattern then the market will Bonus.
Ondo Scalp trade take with sl , this is a 5m scalp trade, So take it at your own risk with small amount
#ONDO/USDT#ONDO
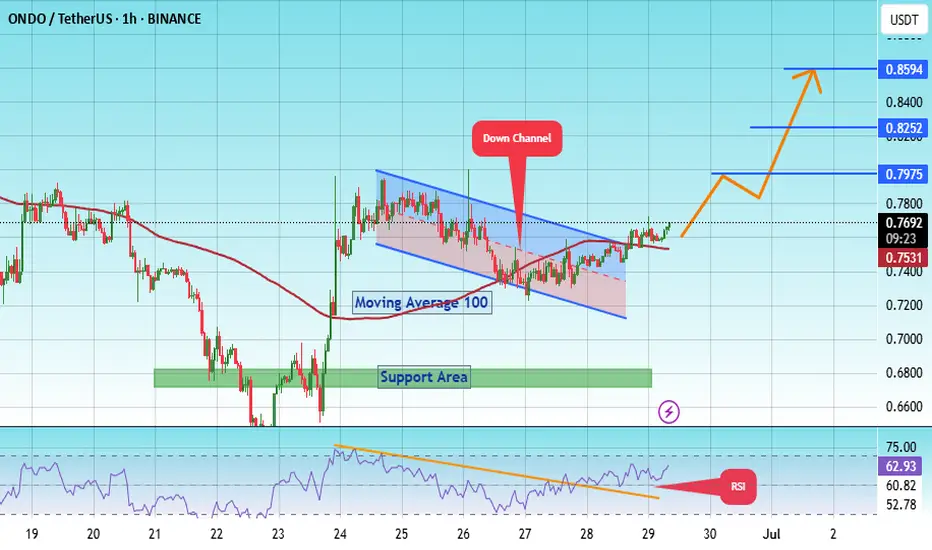
The price is moving within a descending channel on the 1-hour frame, adhering well to it, and is heading for a strong breakout and retest.
We have a bounce from the lower boundary of the descending channel. This support is at 0.7220.
We have a downtrend on the RSI indicator that is about to be broken and retested, supporting the upside.
There is a major support area in green at 0.6757, which represents a strong basis for the upside.
Don't forget a simple thing: ease and capital.
When you reach the first target, save some money and then change your stop-loss order to an entry order.
For inquiries, please leave a comment.
We have a trend to hold above the 100 Moving Average.
Entry price: 0.7975
First target: 0.7975
Second target: 0.8252
Third target: 0.8600
Don't forget a simple thing: ease and capital.
When you reach the first target, save some money and then change your stop-loss order to an entry order.
For inquiries, please leave a comment.
Thank you.
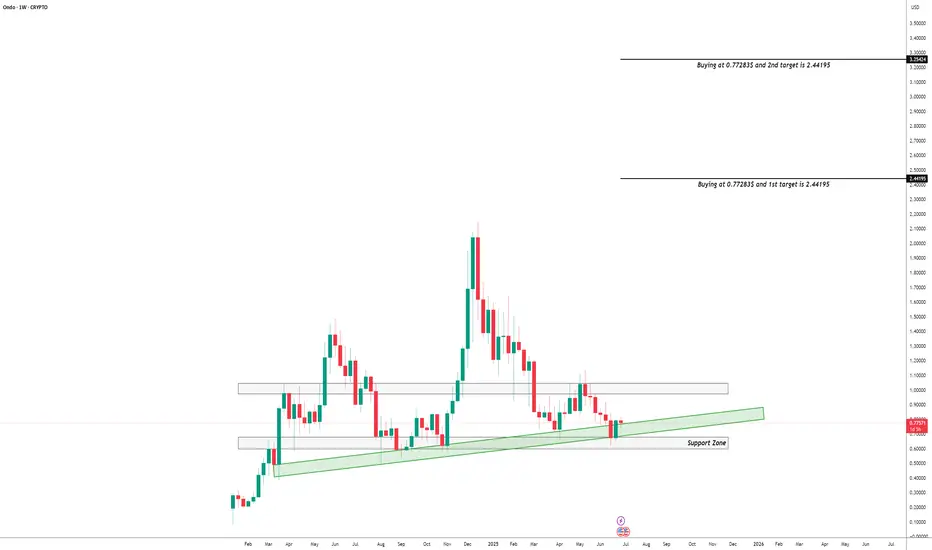
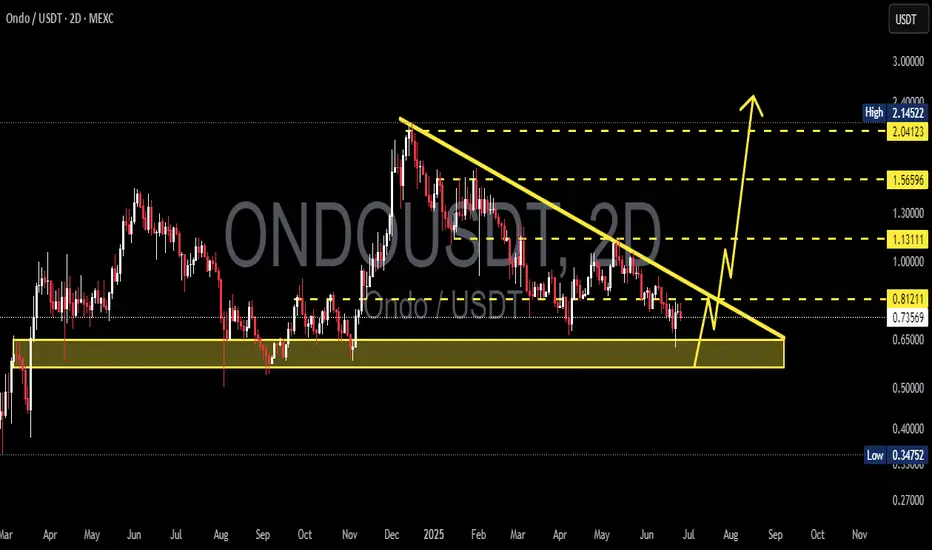
ONDO/USDT 2D – Falling Wedge Breakout in Play?ONDO/USDT is currently forming a highly compelling structure on the 2-day timeframe. Price action suggests a possible breakout from a falling wedge pattern, which is typically a bullish reversal signal.
🔹 Strong Support Zone:
The price continues to respect a significant accumulation zone between 0.65 – 0.73 USDT, which has held as a major support area since September 2023. Multiple successful retests reinforce its strength.
🔹 Descending Trendline Breakout:
The descending resistance line (yellow trendline), connecting lower highs since December 2023, is being tested and appears to be breaking. A confirmed breakout could trigger a strong bullish reversal.
🔹 Potential Upside Targets (Based on Structure and Fibonacci Projections):
TP1: 0.81211 (breakout confirmation level)
TP2: 1.13111 (key horizontal resistance)
TP3: 1.56596 (technical extension zone)
TP4: 2.04123 – 2.14522 (major historical resistance and previous swing high)
🔹 Trade Idea:
Conservative Entry: Buy the retest near 0.73–0.75 USDT after breakout confirmation
Stop Loss: Below the key support zone, around 0.65 USDT
Risk to Reward: Very favorable, with upside potential exceeding +160%
🔹 Confirmation Tips:
Look for a clean breakout with increased volume and a candle body closing above the trendline. A breakout + retest scenario provides higher probability for trend continuation.
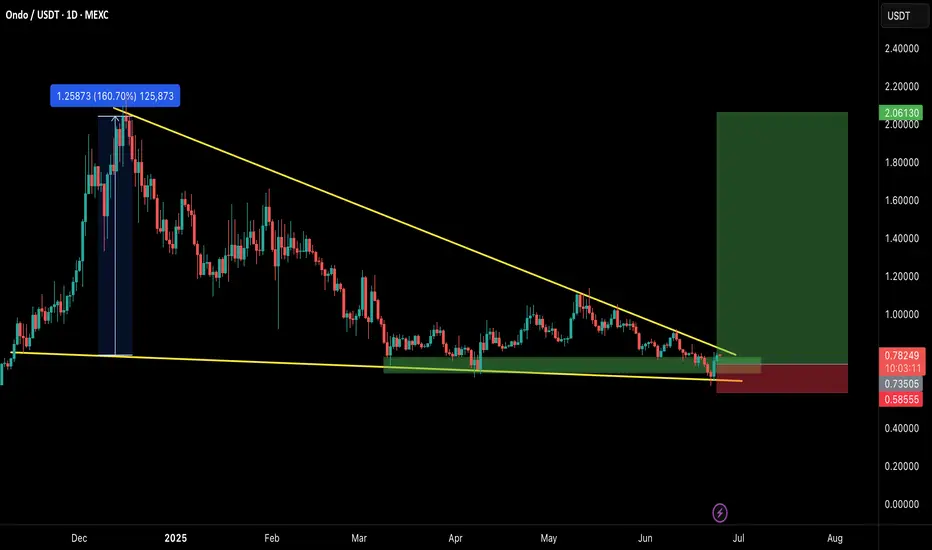
ONDOUSDT – POTENTIAL BREAKOUT TRADE SETUP!Hey Traders — if you're into high-conviction setups with real momentum, this one’s for you.
ONDO is trading inside a falling wedge on the daily chart — a classic bullish structure that often leads to explosive breakouts. 📈
Accumulation Zone: Price is currently sitting inside the green support box, which has held strong multiple times. This makes it a good area to start accumulating before a potential breakout.
🚀 Breakout not confirmed yet, but structure looks promising. A breakout above the wedge will be the confirmation trigger.
📌 Trade Setup:
✅ Entry (Spot Accumulation): $0.73–$0.78
🎯 Targets after breakout: $1.10 / $1.45 / $2.05
🛑 Stop-loss: $0.58
📈 Bias: Bullish on breakout
🔸 Monitor for a clean breakout candle + volume above the wedge.
🔸 Manage position sizing while accumulating in the zone.
Let’s see if history repeats and ONDO gives us a strong breakout move.
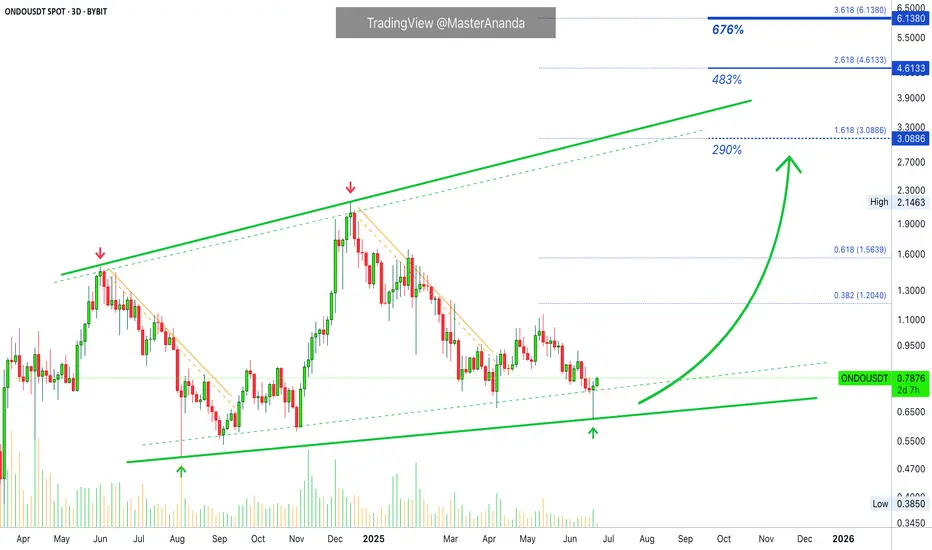
Ondo Finance: 290%, 483% & 676% Summer & FallBullish momentum right now is building up so fast that I can hardly share a chart before prices are up 5 to 10%. If you try to buy, prices can runaway from you specially when using leverage. That's what I mean when I say that the bottom, bottom prices, will only last a few days at max. The time is now.
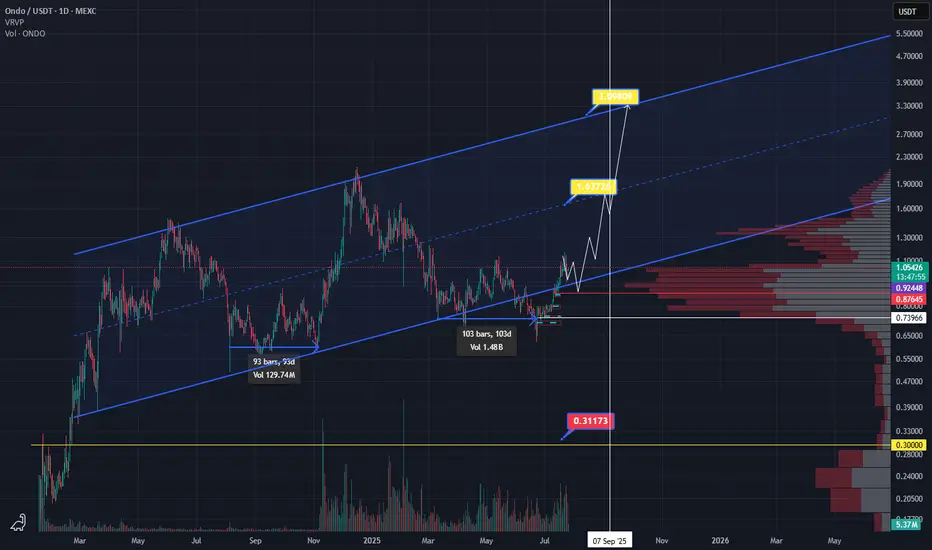
Here we have Ondo Finance with a great pattern, the ascending channel. This chart structure clearly reveals a very strong, long-term bullish bias. And the logical conclusion is always obvious based on price action.
Each time there is a drop, the lowest point is a higher low.
Each time there is an advance, the market ends up producing a higher high...
I know, people are allergic to bottom prices so right now everybody is away but, there is good news; soon the market will be trading really high up and once prices are high, everybody is ready to trade.
Huge potential for growth on this chart. These target can be hit within 1-3 months, 3-6 months with the potential open for higher than what is shown.
Namaste.
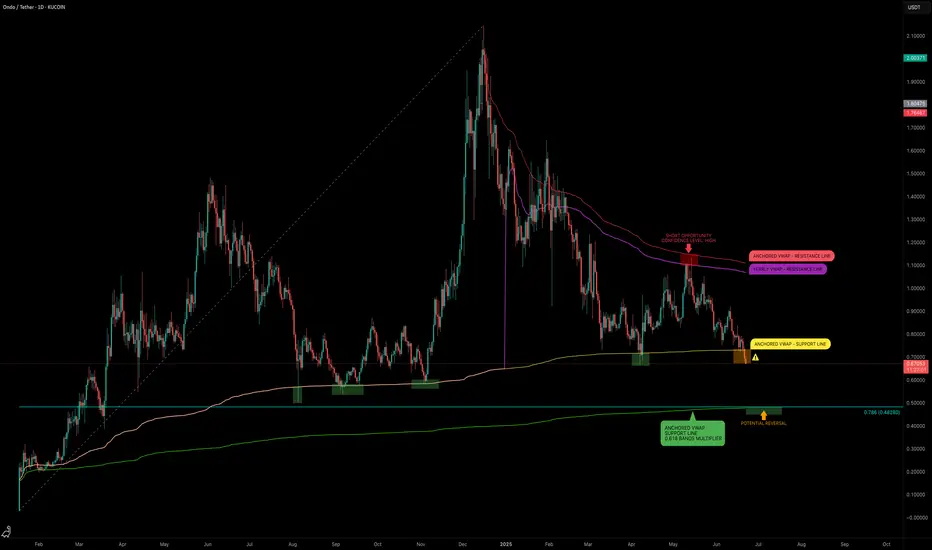
ONDO — Reversal or more Pain ahead? After a strong rally back in 2024, ONDO topped at $2.15 — completing a clear 5-wave impulsive move. Since then, price has entered a prolonged downtrend, dropping over -70%, with no confirmed reversal signs yet.
We’re now trading around a critical zone near $0.70. So the question is: where’s the next potential bottom?
🔎 Technical Breakdown:
📍 VWAP Breakdown:
The yellow anchored VWAP (Volume Weighted Average Price) has been lost — a clear sign of market weakness. This VWAP was previously acting as support but has now flipped to resistance, which often precedes continued downside.
📌 Key Support Zone:
$0.80–$0.70 was a structural support area that has now been broken — another bearish sign.
📉 Fibonacci Confluence:
Taking the structure and applying a Fibonacci retracement, the 0.786 retracement lies at $0.4828 — let’s round that to a critical $0.50 zone. This level is important for several reasons:
Liquidity rests at a previous key low at $0.50128
Anchored VWAP Band (0.618 multiplier) aligns with the same area
The 8/1 Gann Fan also intersects around this zone
All roads lead to the $0.50 level as a potential high-probability reversal zone. A bounce from here — especially with volume confirmation or reversal candlesticks etc. — would be a signal worth watching.
💡 Educational Insight: Importance of 0.786–0.886 Fibonacci Zone + VWAP
While many focus on the 0.618 retracement, bear markets often go deeper.
The 0.786–0.886 zone is where emotional exhaustion kicks in — traders give up, liquidity pools build, and smart money steps in.
Combining this with Anchored VWAP adds precision:
VWAP reflects where the “average buyer” is positioned. When price reaches confluence with both deep fibs and VWAP fib bands, you have a statistically powerful setup for reversals.
🚨 Note: These zones are not automatic buy levels — watch for confirmation signs before entering.
🛎️ Set your alerts, stay patient, and as always let the trade come to you.
_________________________________
💬 If you found this helpful, drop a like and comment!
Want breakdowns of other charts? Leave your requests below.
ONDOUSDT 1D AnalysisONDO ~ 1D Analysis
#ONDO Buy back on a retest of this support block with a short term target of at least 15%+ from here. Long term target $2.1
ONDO/USDT – Attempting breakoutONDO/USDT – Attempting breakout
ONDO is currently testing a key resistance level and attempting to break out of a consolidation zone. If the breakout is confirmed with strong volume and price holds above the breakout line, a bullish move of 15–30% could follow.
Key levels to watch:
* Breakout zone
* Support just below breakout
* Volume confirmation
Keep an eye on ONDO — if it holds above resistance, it may trigger a strong upside move in the short term.

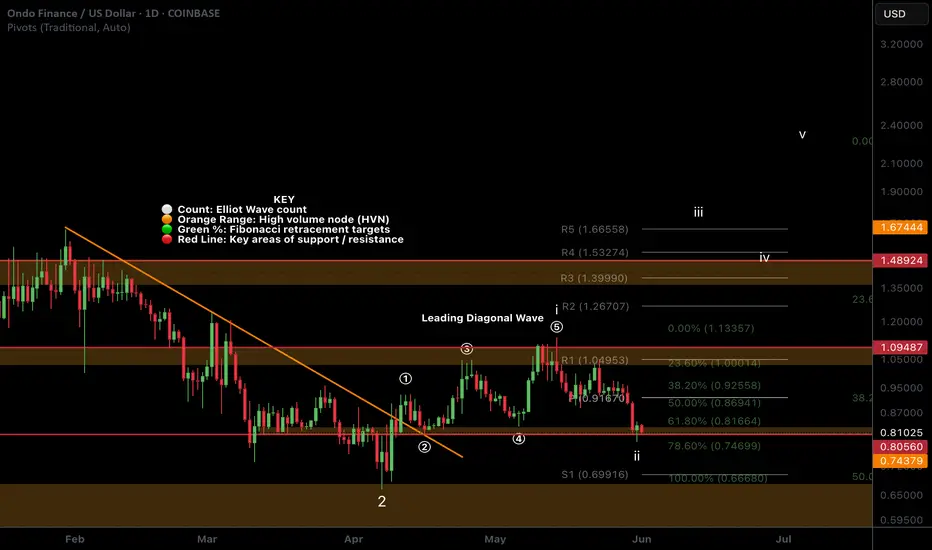
ONDO (Daily) Elliot Wave ii UnderwayONDO appears to have completed a leading diagonal for wave 1 after finding a bottom at the major support high volume node (HVN).
Wave 2 has retraced to the expected alt coin Golden Pocket at the 78.6% retracement tapping high volume node.
The descending resistance line has been tested as support leaving a dragonfly doji but does not look strong enough to be the bottom yet.
Wave 3 should be a powerful move up.
This analysis is invalidated below macro wave 2 -$0.65
Safe trading
ONDO ANALYSIS📊 #ONDO Analysis
✅There is a formation of Descending triangle pattern on weekly chart 🧐
After a small retest towards to its support zone we would see a bullish movement
👀Current Price: $0.8820
⚡️What to do ?
👀Keep an eye on #ONDO price action and volume. We can trade according to the chart and make some profits⚡️⚡️
#ONDO #Cryptocurrency #TechnicalAnalysis #DYOR
ONDOUSDT 1D AnalysisONDO ~ 1D Analysis
#ONDO Buy gradually at this support block with a short term target of at least 15%++ from here.

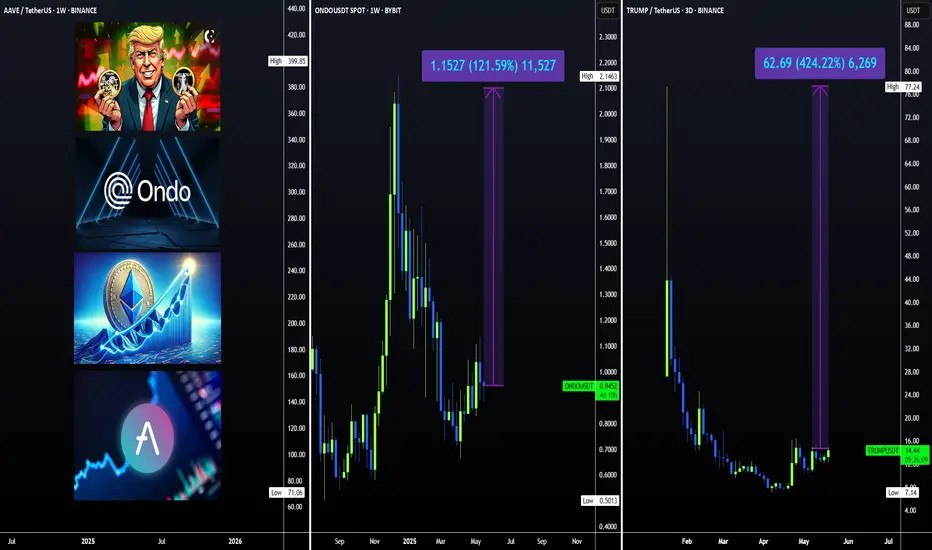
THESE ALTS can +100% | ALTSEASON PART2️⃣Altseason usually happens when BTC trades close towards a new ATH, as it is doing now, and takes some time to stall/trade sideways
Now this season is working a little differently. Usually ETH makes its way towards new highs, but we haven't seen that just yet. Ethereum has HUGE upside potential still.
It's hard to say just how high Ethereum can go, but what we do know is that it's still 88% away from the previous ATH, and due for a new one...
ENA is another alt with big upside potential, from it's previous peak its more than 200% away:
Solana has made a strong V-shaped recovery and if ETH is primed for new ATH, SOL is sure to follow:
TRUMPcoin may be memecoin, but the again so is PEPE! Still big upside after a long while of range trading here: