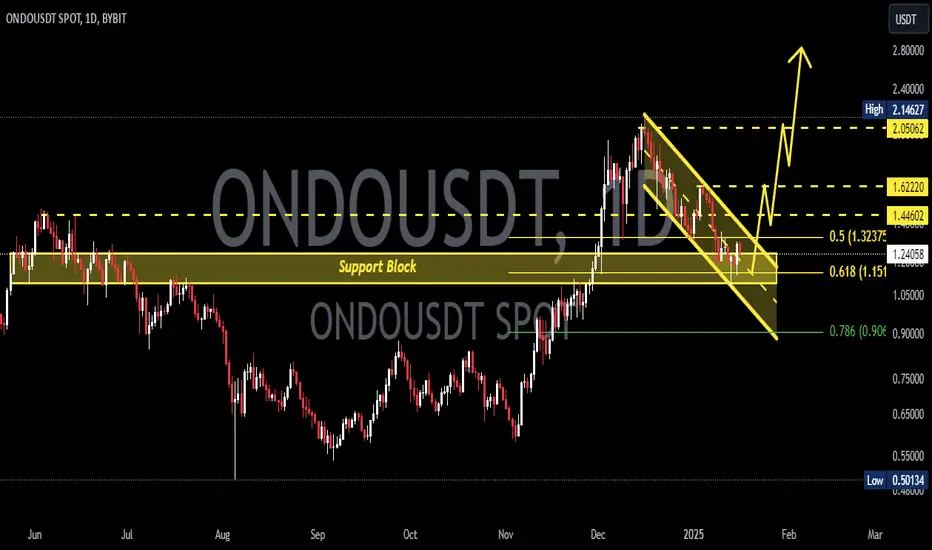
ONDOUSDT at a Critical Fibonacci Zone! Will Move Toward $2+?ONDOUSDT is currently trading at a critical technical zone — the Fibonacci Retracement Golden Pocket (0.5–0.618) — following a significant upward rally. Historically, this zone often acts as a high-probability reversal area, or at the very least, a zone for major consolidation before the next big move.
---
🧠 Market Structure & Price Action
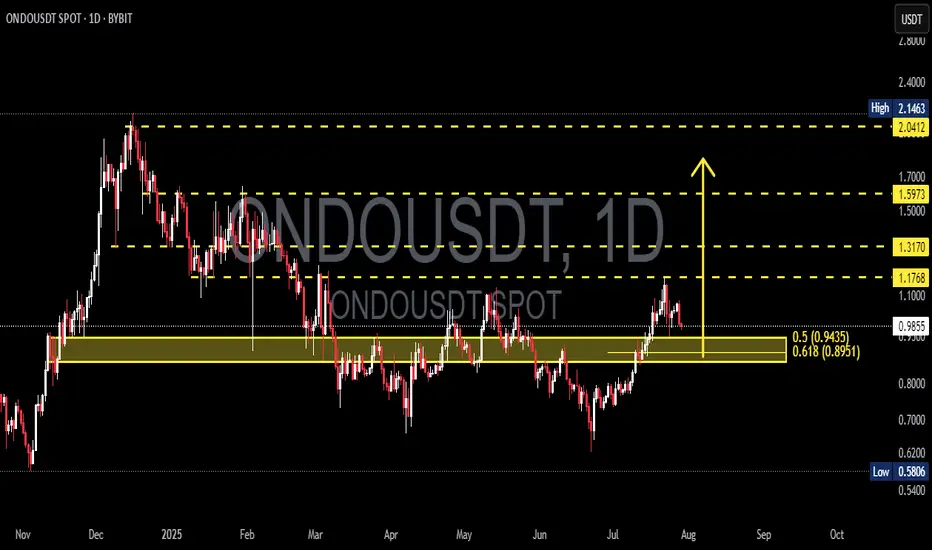
After reaching a local high near $1.17, price retraced and is now approaching the key support zone between $0.9435 (Fib 0.5) and $0.8951 (Fib 0.618).
This zone also coincides with a previous strong resistance, which could now act as new support (role reversal).
Current price action shows selling pressure, but there is no confirmed breakdown from the Golden Pocket yet.
---
🧩 Pattern Recognition & Key Levels
Potential Reversal Pattern: Look for a bullish falling wedge or descending channel on lower timeframes as a signal for reversal.
Demand Zone (Yellow Box): The zone between $0.8951–$0.9435 is reinforced by horizontal price structure support.
Layered Resistance Levels:
$1.1768 → Recent swing high
$1.3170 → Mid-range resistance
$1.5973 → Psychological and retracement target
$2.0412 → Range top / full recovery zone
Minor Support: If the Golden Pocket fails, potential downside targets include $0.70 and the major low at $0.5806.
---
📈 Bullish Scenario
✅ Strong bounce from the Golden Pocket
✅ Bullish candlestick confirmation (e.g., bullish engulfing or pin bar)
✅ Rising volume showing buyer presence
✅ Break above $1.1768 would signal continuation toward:
🎯 Target 1: $1.3170
🎯 Target 2: $1.5973
🎯 Target 3: $2.0412 (full structural recovery)
---
📉 Bearish Scenario
❌ If price breaks below $0.8951 with a strong bearish candle and high volume:
The structure shifts bearish, increasing risk of a drop to $0.70 – $0.62
Worst-case scenario: retest of $0.5806, the major bottom
Bullish structure invalidated upon confirmed breakdown
---
🎯 Strategy & Takeaway
ONDOUSDT is currently in a "make or break" zone. The Golden Pocket between $0.895–$0.943 could either:
Act as a springboard for the next bullish leg,
Or fail, triggering a deeper correction.
Traders should wait for confirmation via:
Candlestick patterns
Volume breakout/inflow
Break above or below the key structure
This area offers a high-reward, controlled-risk setup for swing traders, with invalidation just below the Golden Pocket.
---
📌 Summary of Key Levels
Level Description
$0.9435 Fibonacci 0.5 (support)
$0.8951 Fibonacci 0.618 (Golden Pocket)
$1.1768 Minor resistance
$1.3170 Mid-level resistance
$1.5973 Bullish target
$2.0412 Major resistance / recovery top
$0.5806 Extreme support (macro low)
#ONDOUSDT #CryptoTechnicalAnalysis #GoldenPocket #FibonacciLevels #CryptoTrading #SupportResistance #BullishSetup #BearishScenario #SwingTrade #AltcoinAnalysis
Ondousdtanalysis
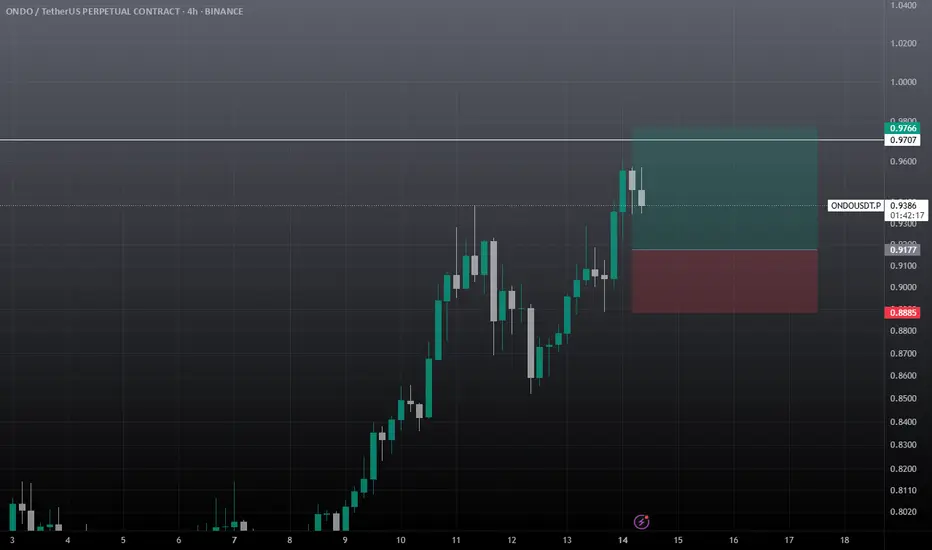
Ondo USDT SCALP TRADEIF this 4hr fvg breaks then I will look for short, otherwise expecting to hold this level and wipe out previous liquidation.
ONDO/USDT Breakout Watch – Reversal Incoming
🔍 Overview:
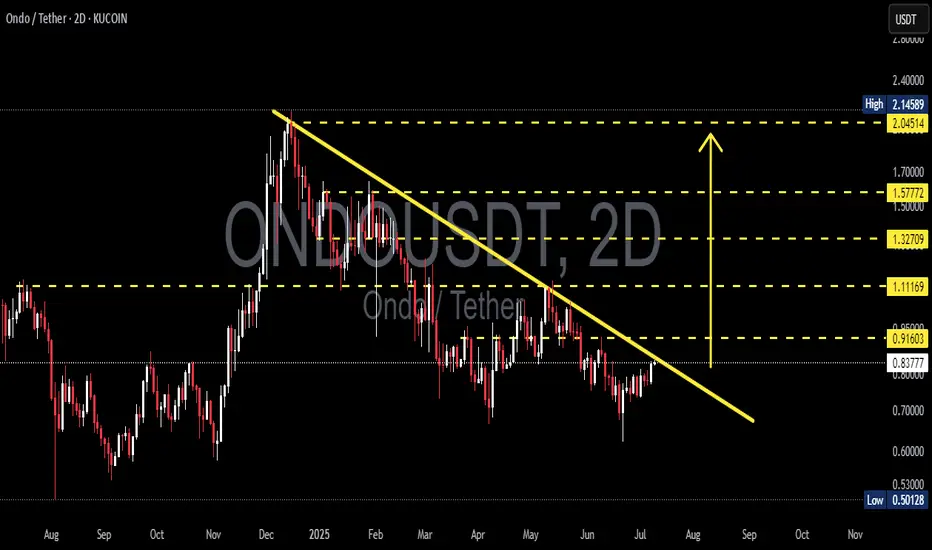
The ONDO/USDT pair is currently at a critical inflection point. After months of being suppressed in a downtrend, price action is now testing a major descending trendline that has capped the market since the peak in December 2024. A breakout here could be the beginning of an explosive bullish phase — but failure might confirm further downside.
📉 Pattern: Descending Trendline Compression
ONDO has been forming consistent lower highs, creating a clear descending trendline structure.
Price is now pressing against this resistance, attempting a breakout with a strong 2D candle.
A confirmed breakout will occur once ONDO closes above $0.916 on the 2D chart, which also acts as a horizontal resistance.
✅ Bullish Scenario – The Start of a Mid-Term Reversal?
If the breakout is confirmed, we could see strong upward momentum, as there’s relatively little resistance in the upper zones.
🎯 Potential Targets:
1. $1.11 – First psychological and technical resistance.
2. $1.327 – Previous consolidation zone from Feb–Mar 2025.
3. $1.577 – Major supply zone before the heavy correction started.
4. $2.045 - $2.145 – All-time high area, the ultimate mid-to-long-term target.
📈 Note: Although not shown in this chart, RSI is likely leaving oversold territory, supporting the bullish momentum shift.
❌ Bearish Scenario – Classic Bull Trap Ahead?
If price fails to break and close above the trendline and $0.916, this could turn into a fakeout or bull trap.
📉 Possible downside levels:
$0.8399 – Minor support currently holding.
$0.70 – Strong horizontal demand zone.
$0.53 – Long-term support base, potential double bottom zone.
If momentum fades here, ONDO could revisit these lower areas before finding a true bottom.
🧠 Sentiment & Trading Strategy:
Breakout confirmation: Wait for a solid 2D candle close above the descending trendline and $0.916. Look for volume spike.
Conservative strategy: Enter on break + retest of the trendline, with SL below $0.83 and multi-level TPs.
Aggressive strategy: Enter on the initial breakout with dynamic trailing stops and resistance-based targets.
🏁 Conclusion:
ONDO/USDT is at a make-or-break moment. A confirmed breakout from this long-term descending structure may trigger a strong reversal with over 100% potential upside. However, if the market rejects this breakout attempt, it could extend its bearish trajectory.
Patience, confirmation, and disciplined risk management are key here.
📌 Key Levels to Watch:
Support: $0.8399 – $0.70 – $0.53
Resistance: $0.916 – $1.11 – $1.327 – $1.577 – $2.045 – $2.145
#ONDO #ONDOUSDT #CryptoBreakout #BullishSetup #AltcoinAnalysis #CryptoReversal #TradingViewSignals #TechnicalBreakout #DescendingTrendline #PriceAction
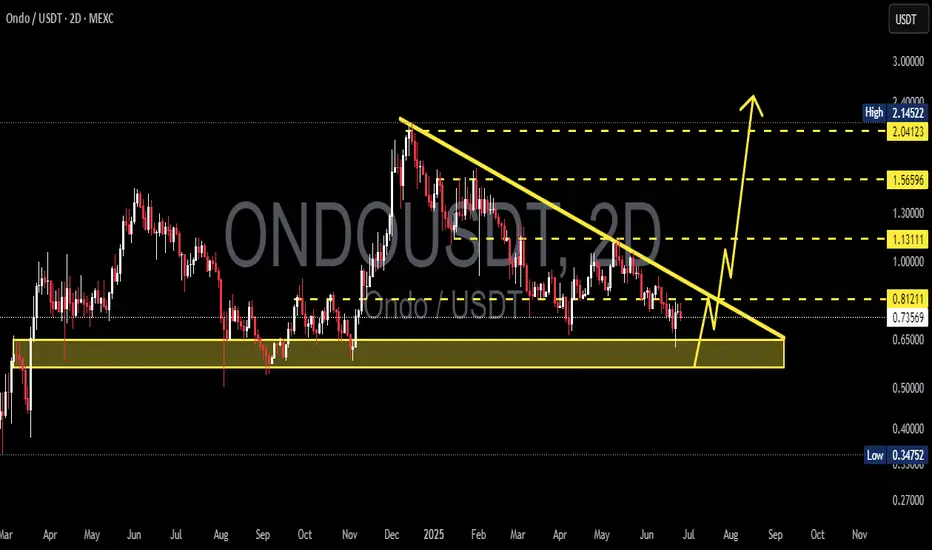
ONDO/USDT 2D – Falling Wedge Breakout in Play?ONDO/USDT is currently forming a highly compelling structure on the 2-day timeframe. Price action suggests a possible breakout from a falling wedge pattern, which is typically a bullish reversal signal.
🔹 Strong Support Zone:
The price continues to respect a significant accumulation zone between 0.65 – 0.73 USDT, which has held as a major support area since September 2023. Multiple successful retests reinforce its strength.
🔹 Descending Trendline Breakout:
The descending resistance line (yellow trendline), connecting lower highs since December 2023, is being tested and appears to be breaking. A confirmed breakout could trigger a strong bullish reversal.
🔹 Potential Upside Targets (Based on Structure and Fibonacci Projections):
TP1: 0.81211 (breakout confirmation level)
TP2: 1.13111 (key horizontal resistance)
TP3: 1.56596 (technical extension zone)
TP4: 2.04123 – 2.14522 (major historical resistance and previous swing high)
🔹 Trade Idea:
Conservative Entry: Buy the retest near 0.73–0.75 USDT after breakout confirmation
Stop Loss: Below the key support zone, around 0.65 USDT
Risk to Reward: Very favorable, with upside potential exceeding +160%
🔹 Confirmation Tips:
Look for a clean breakout with increased volume and a candle body closing above the trendline. A breakout + retest scenario provides higher probability for trend continuation.
ONDOUSDT 1D AnalysisONDO ~ 1D Analysis
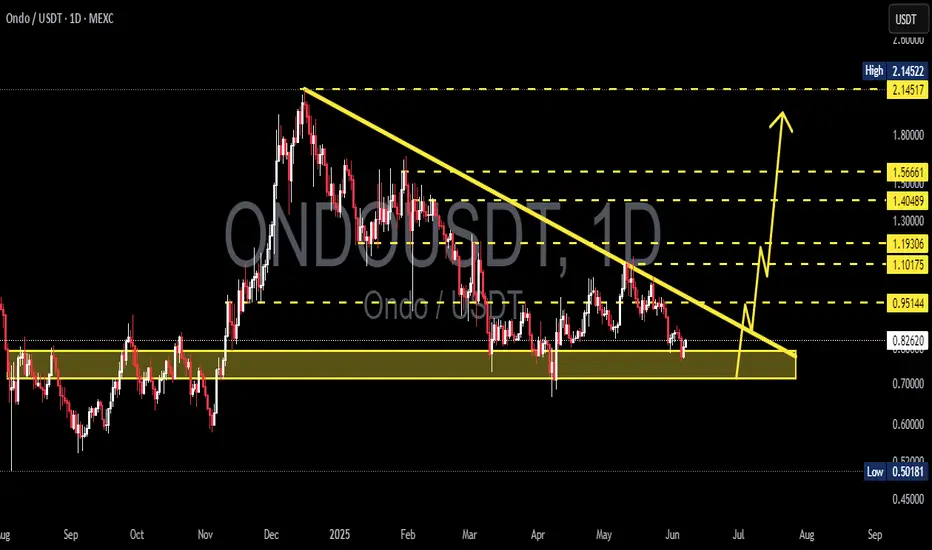
#ONDO Buy back on a retest of this support block with a short term target of at least 15%+ from here. Long term target $2.1
ONDOUSDT 1D AnalysisONDO ~ 1D Analysis
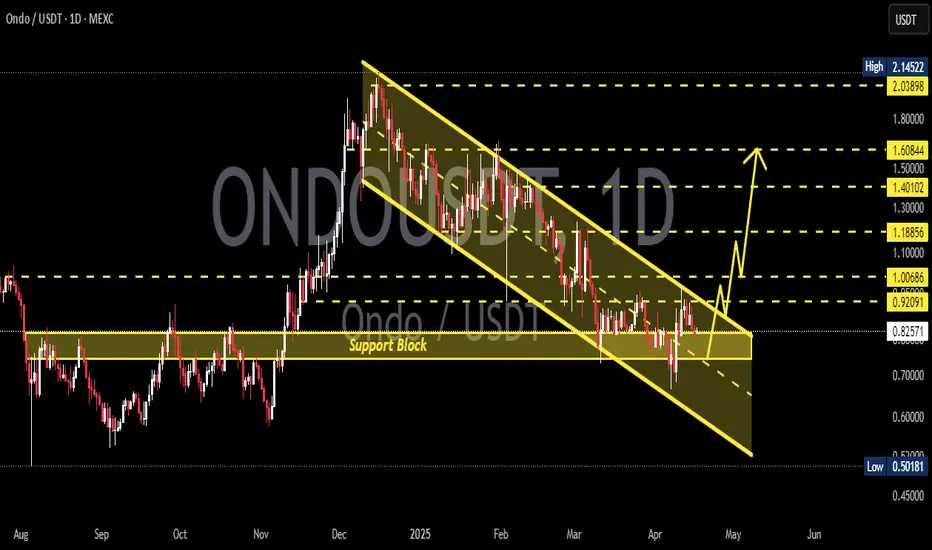
#ONDO Buy gradually at this support block with a short term target of at least 15%++ from here.

ONDOUSDT 1DONDO ~ 1D Analysis
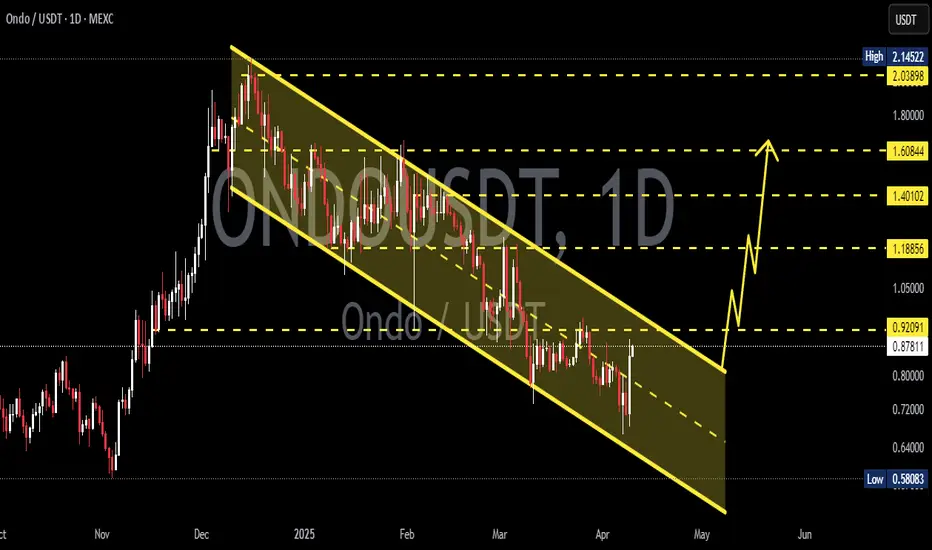
#ONDO Buy gradually from here if you still have a Conviction on this coin with a short -term target of at least 10%+ from here.
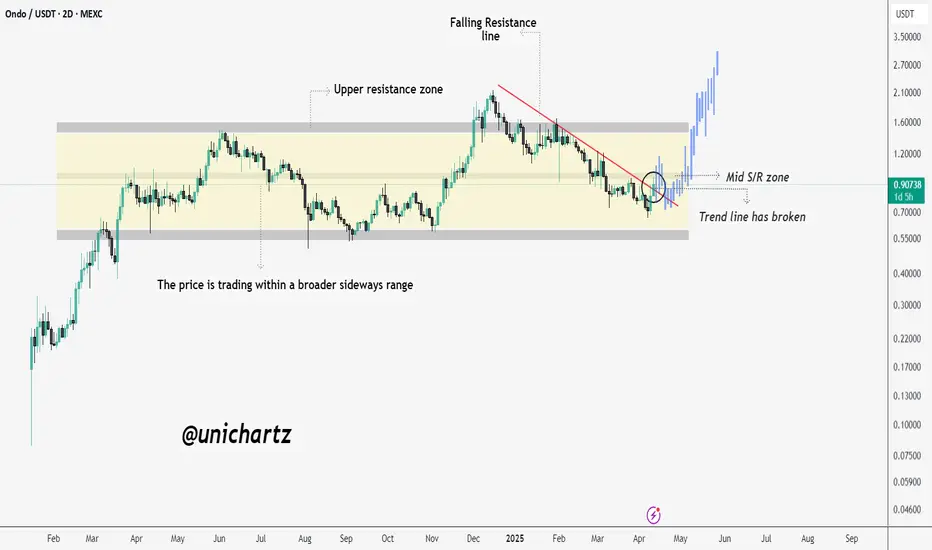
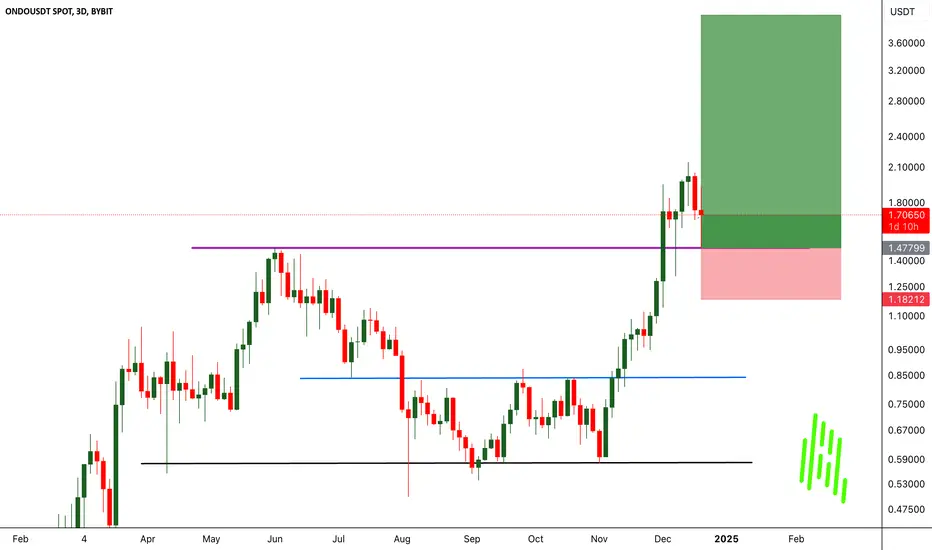
ONDO Range Play: Breakout Confirmed, Eyes on $1.20+ONDO/USDT – 2D Chart Analysis
ONDO has broken above a falling trendline while continuing to trade within a broader sideways range. The breakout occurred near the mid S/R zone around $0.90–$0.95, which is now acting as a potential pivot level.
The price is attempting to reclaim momentum after a period of lower highs and sideways compression. A sustained move above the mid-range could open the path toward the upper resistance zone near $1.20–$1.30. However, if the breakout fails and price falls back below $0.90, it may revisit the lower range support around $0.70.
This is a key zone to watch for continuation or rejection.
DYOR, NFA
ONDOUSDT 1DONDO ~ 1D Analysis
#ONDO Buy after successfully penetrating the resistant line of this pattern, with a short -term target of at least 10%+.
Bullish Divergence Spotted! Is ONDO Ready to Pump?The price of ONDO/USDT is currently trading within a broader sideways range, respecting both the upper resistance and lower support levels. The falling resistance trendline has been acting as a strong barrier, rejecting the price multiple times.
However, a bullish RSI divergence is forming at the lower support zone, signaling a potential reversal or bounce.
If the price holds above the support, a breakout above the trendline could trigger an upward move towards the upper resistance zone. On the downside, losing support could lead to further weakness.

ONDOUSDT 1DONDO ~ 1D Analysis
#ONDO Buy gradually in this support block. with a short -term target of at least 15%+.

ONDOUSDT 1DONDO ~ 1D Analysis
#ONDON Buy after successfully penetrating this resistant line with a short -term target of at least 15%+.

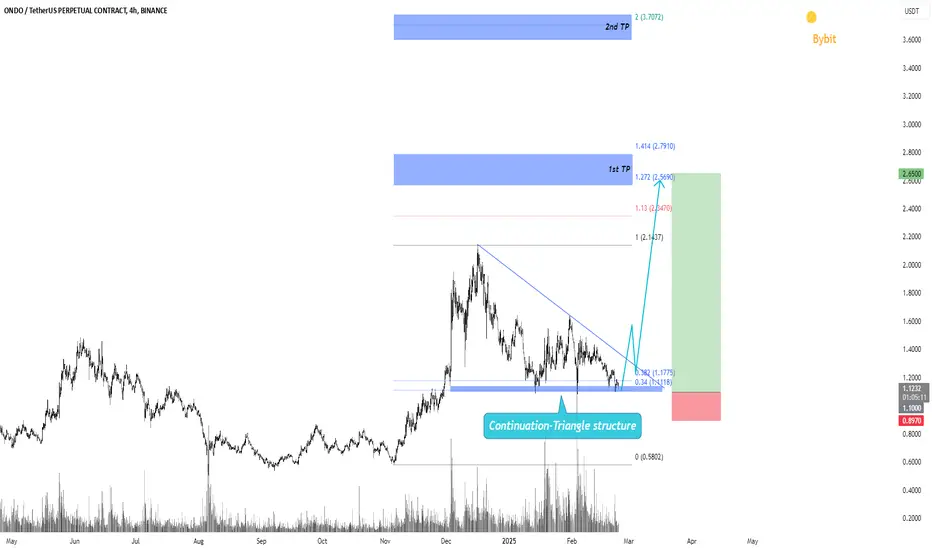
ONDO target $2.654h time frame
-
Entry: $1.1
TP: $2.65
SL: $0.897
RR: 7.64
-
(1) ONDO is building a continuation structure with a triangle pattern.
(2) Triangle bottom is around $1.1, which is our entry opportunity.
(3) Fibonacci provides first target at $2.65 and final target at $3.7
(4) Stop loss once going below $0.897
ONDOUSDT 1DONDO ~ 1D Analysis
#ONDO Bullish Pennant is formed on Time Frame 1D. The best way to wait until this pattern is successful broken and buy.

ONDO :: SHORT???????This analysis is solely based on the chart. Issues such as the overall market situation, the fundamentals of the currency, macroeconomics, and other parameters like traders' expectations for an altcoin season have never been taken into account. It is an analysis purely based on the chart. What I observe in this chart is that it requires a relatively deep correction. For clarity, some aspects of this analysis have been omitted. Please do not base your trades on this analysis. If such an analysis were to become reality, what do you think would happen to other cryptocurrencies? I would appreciate your constructive feedback regarding the price and its movement.

#ONDOUSDT expecting further upside📉 LONG BYBIT:ONDOUSDT.P from $1.4891
🛡 Stop Loss: $1.4667
✅ Overview:
➡️ BYBIT:ONDOUSDT.P is trading in a consolidation range, forming a local support level around $1.3705.
➡️ POC (Point of Control) is at $1.3631 , indicating the area with the highest trading volume.
➡️ The price has broken a resistance zone and is now testing it as support, which could be a long entry signal.
➡️ If the asset holds above $1.4048, an upward move towards the next resistance levels is likely.
⚡ Plan:
➡️ Entering a long position at $1.4891 after confirming a hold above the key level of $1.4048.
➡️ Stop-loss is set at $1.4667 , below the recent support zone.
➡️ Expecting a bullish push with a target of $1.5699.
🎯 TP Targets:
💎 TP 1: $1.5699 – the first target level where partial profit-taking is recommended.
💎 TP 2: $1.6000
📢 BYBIT:ONDOUSDT.P shows signs of potential growth, but it’s crucial to monitor the $1.4048 level – a breakdown below could lead to further decline.
📢 Volume remains at an average level, indicating possible position accumulation before a move.
📢 To confirm a strong uptrend, price must hold above $1.4891 and successfully test the $1.5699 resistance level.
🚀 BYBIT:ONDOUSDT.P is shaping a bullish scenario — expecting a breakout and further upside!

ONDO/USDT: Wave 5 Elliot Wave, Long Opportunity📈 KUCOIN:ONDOUSDT
Greetings, traders!
On the 2-hour chart of ONDO/USDT, the fifth wave of an Elliott Wave uptrend appears to be forming, presenting a potential long trade opportunity.
I've identified a potential entry point above $1.4400, with the following targets:
Target 1: $1.6200
Target 2: $1.7000
My stop-loss would be placed in the range of $1.3000 to $1.3200.
Disclaimer: This is not financial advice. Trade at your own risk.

ONDOUSDT 1DONDO ~ 1D
#ONDO If you still have Conviction on this coin,. Maybe you can consider this support block to start buying gradually. Minimum target 15%+
ONDOUSDT Is This the Beginning of a Parabolic Run?
BYBIT:ONDOUSDT has demonstrated impressive strength following a decisive breakout above the $1.5 resistance level. Notably, the recent market-wide dump had minimal impact on BINANCE:ONDOUSDT.P , with the previous resistance level now acting as robust support. This resilience, coupled with strong trading volume, suggests underlying bullish momentum.
Traders are now eyeing a potential parabolic move towards the $4 target. However, it is crucial to exercise prudent risk management. Implement a strict stop-loss order below the recent swing low to protect profits and mitigate potential losses.
BITGET:ONDOUSDT Currently trading at $1.68
Buy level: Above $1.5
Stop loss: Below $1.175
Target : $4
Max Leverage 3x
Always keep Stop loss
Follow Our Tradingview Account for More Technical Analysis Updates, | Like, Share and Comment Your thoughts
ONDOUSDT Hits New ATH – 200% Rally Ahead?ONDOUSDT Technical analysis update
BYBIT:ONDOUSDT has reached a new all-time high (ATH) after 185 days of consolidation. The price has surged over 180% from its previous bottom, demonstrating strong bullish momentum. With the breakout supported by increased trading volume, ONDO shows potential for another 100-200% move in the coming days.

ONDOUSDTONDO ~ 1D ✅
#ONDO Make purchases gradually from here. It's only a matter of time until this descending pattern is broken.

ONDOUSDT Is a Major Reversal Coming or Will ONDO Drop Further?Yello, Paradisers! Could #ONDOUSDT be setting up for a massive rebound, or is it about to plunge even further? Let’s dive into the chart analysis to find out!
💎#ONDO's price is currently showing signs of a potential downturn, with the likelihood of revisiting the strong demand zone between $0.507 and $0.393. Historically, this demand zone has triggered a significant rebound, with prices surging 60% in just a few days the last time it reached these levels. This suggests a high probability of a similar rebound once ONDO tests this area again.
💎However, there’s a chance ONDO might break out of the descending channel before it revisits this demand zone. If that happens, we could see an upward movement towards our target major resistance levels, bypassing the deeper retracement.
💎If ONDO revisits the demand zone at $0.507 - $0.393, we could see another strong rebound and a potential breakout of the descending channel, leading to significant upward momentum.
Bearish Scenario:
💎The bullish outlook becomes invalid if ONDO fails to rebound from the demand zone, particularly if a daily candle closes below $0.393. In this case, the potential for further downward movement becomes very real, and we could see a deeper dip beyond current expectations.
Stay focused, patient, and disciplined, Paradisers.
MyCryptoParadise
iFeel the success🌴

ONDOUSDTONDO ~ 1D
#ONDO Make purchases gradually on this support block. Minimum target of 10-20% for the short term.
