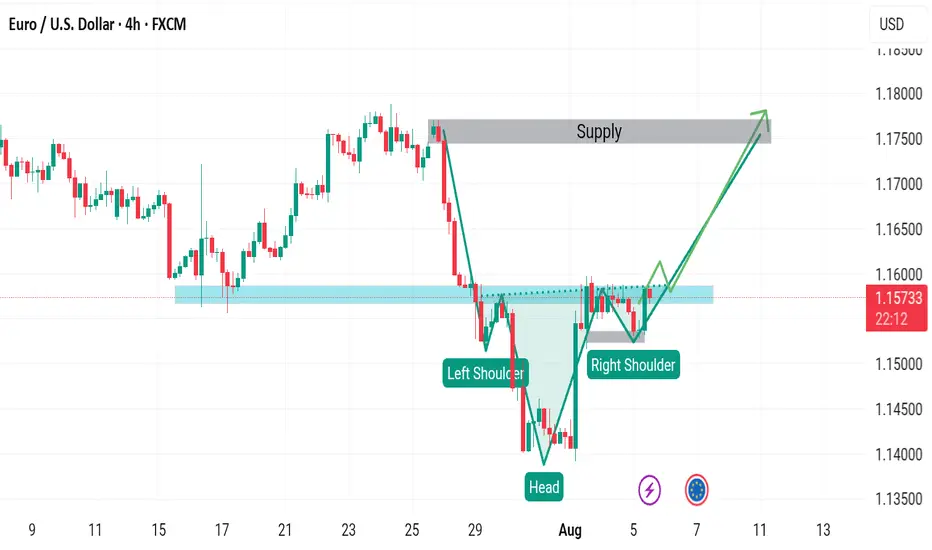
EURUSD - EURUSD – The Calm Before the SweepAfter months of climbing steadily within a rising wedge structure, EURUSD has finally broken beneath the bullish trend line that previously acted as dynamic support. This shift is significant, as it marks the first decisive violation of the bullish momentum that has carried price from the April lows into the July highs. The break occurred with strong bearish displacement, leaving behind an unfilled daily Fair Value Gap (FVG) just above the current price. This area now acts as a potential magnet for price before continuation lower.
Trend Line Retest and FVG Confluence
Price is currently hovering near 1.1570 after the trend line break. Above, we have a clean FVG on the daily chart which aligns closely with the underside of the broken trend line. A retracement into this zone would offer the ideal setup for short positioning, combining the concept of a bearish retest with inefficiency fill. From a technical perspective, this would give institutions a perfect level to engineer a lower high before continuing the move down.
Sell-Side Liquidity Objective
The major downside target sits below the swing low formed in early May. This area likely holds a large pool of resting sell-side liquidity, which would be an ideal draw for smart money before any potential reversal. If the market respects the bearish structure and rejects the FVG zone cleanly, the move toward this liquidity pocket becomes increasingly probable.
Reversal Conditions
While the short setup is currently the main focus, the area below the May low also presents a key decision point. If price sweeps that low and we begin to see bullish structure return, this could mark the beginning of a new leg up. For that to be valid, we’d need to see signs of strong buying interest, displacement, and reclaim of key short-term highs. Until then, we remain on the lookout for short opportunities into the FVG and trend line retest zone.
Execution Plan and Expectations
Traders should watch for signs of exhaustion or rejection once price enters the FVG zone. Bearish price action on lower timeframes like the 1H or 15M could confirm entry, particularly if the trend line holds as resistance. Stops can be placed above the swing high before the break, with targets below the major low around 1.10500. The reward-to-risk on this setup is favorable, but patience is needed to wait for the retrace to complete.
Conclusion
EURUSD has shifted from bullish to bearish structure after breaking the rising trend line. With an unfilled FVG above and a clean downside liquidity target, this setup offers a well-defined short opportunity. Reactions at the FVG and below the May low will dictate whether we extend lower or begin a new bullish phase. For now, all eyes are on the retrace and short continuation.
Disclosure: I am part of Trade Nation's Influencer program and receive a monthly fee for using their TradingView charts in my analysis.
___________________________________
Thanks for your support!
If you found this idea helpful or learned something new, drop a like 👍 and leave a comment, I’d love to hear your thoughts! 🚀
Community ideas

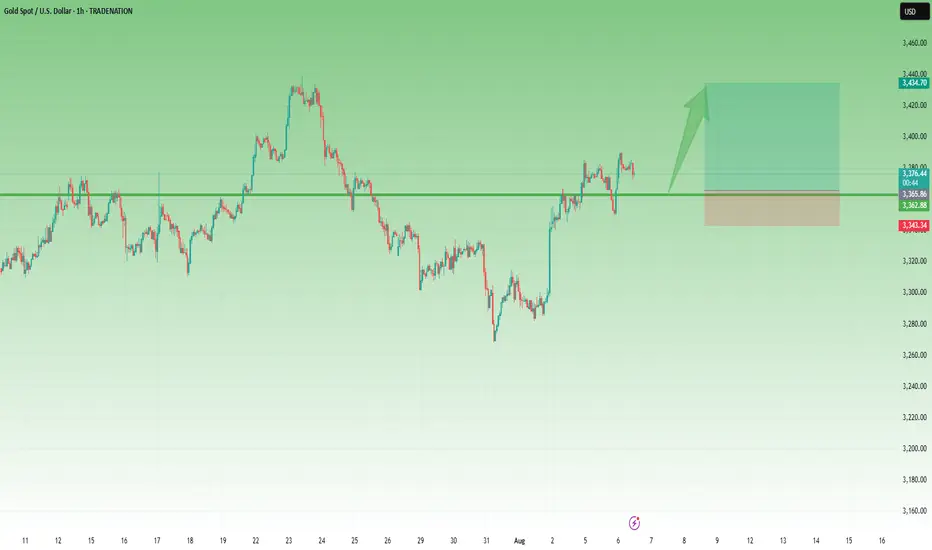
Bitcoin - Downtrend will continue to 109,000! Alt-season OctoberBitcoin and altcoins have been crashing in the past 2 weeks! Is there any hope for a bull market, or has the bullish cycle ended? In this analysis I will tell you my personal opinion, and if you haven't seen my previous very successful analysis on Bitcoin, you can do it right now! Because it's highly informative, and it can open your closed eyes.
In short, Bitcoin just recently hit the long-term trendline from 2017 - 2021 - 2025, and yes, the market reacted to this trendline and dropped as expected. Because this is a major trendline, we have to expect a strong reaction. I still think the market needs to go lower in the short term because there is an unfilled FVG at 109k, so closing this gap would be appreciated. This GAP is also a strong support because it's in a confluence with this blue parallel channel, and the upward-sloping trendline definitely acts as a support. In the short term we should see a bounce from this trendline.
You probably saw that Ethereum massively pumped, and some specific altcoins as well. We saw a short-term alt season, there is no doubt about it, but will this altcoin season continue or not? Currently I do not see a bottom on altcoins, so BTC.D should go up in the short-term and mid-term, but in October/November/December I think that would be a very good time to buy some altcoins for the upcoming alt season!
Write a comment with your altcoin + hit the like button, and I will make an analysis for you in response. Trading is not hard if you have a good coach! This is not a trade setup, as there is no stop-loss or profit target. I share my trades privately. Thank you, and I wish you successful trades!
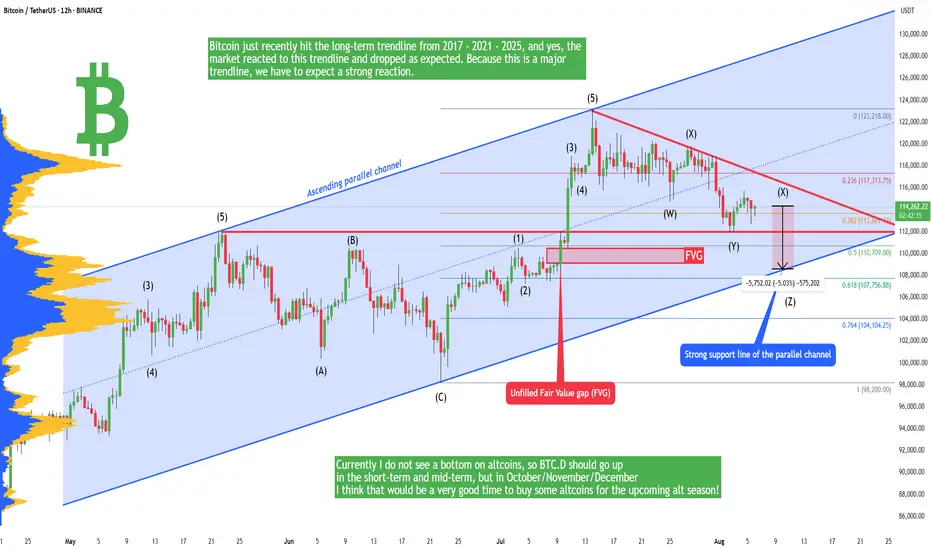
GOLD → Long squeeze of support ahead of possible growthFX:XAUUSD is entering a consolidation phase after a rally. The market is forming a trading range, and a retest of support could end in growth...
Gold pulled back from an 8-day high ($3391) on profit-taking ahead of Trump's Fed appointments. Weak ISM services data (50.1) and a pause in the dollar's weakening added pressure, although expectations of Fed policy easing in September remain supportive.
The market focus is on key events: Fed appointments (including a possible replacement for Powell) and Trump's trade statements. These factors could provide new momentum after the current correction, as long as the fundamental drivers for growth remain in place.
Resistance levels: 3385.4
Support levels: 3358, 3350, 3345
Technically, the price has confirmed resistance after a false breakout, and the market needs to build up potential for a possible continuation of growth. At the moment, the most likely scenario is a long squeeze (false breakdown) before growth continues. Focus on the key support zone.
Best regards, R. Linda!
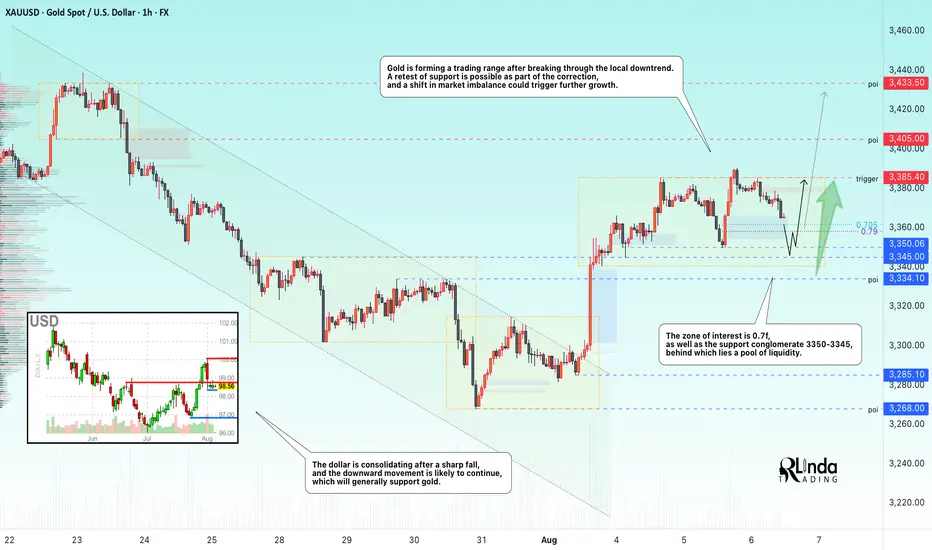
XAU/USD (Gold) Triangle Breakout (07.08.2025)The XAU/USD pair on the M30 timeframe presents a Potential Buying Opportunity due to a recent Formation of a Triangle Breakout Pattern. This suggests a shift in momentum towards the upside and a higher likelihood of further advances in the coming hours.
Possible Long Trade:
Entry: Consider Entering A Long Position around Trendline Of The Pattern.
Target Levels:
1st Resistance – 3407
2nd Resistance – 3420
🎁 Please hit the like button and
🎁 Leave a comment to support for My Post !
Your likes and comments are incredibly motivating and will encourage me to share more analysis with you.
Best Regards, KABHI_TA_TRADING
Thank you.
Disclosure: I am part of Trade Nation's Influencer program and receive a monthly fee for using their TradingView charts in my analysis.
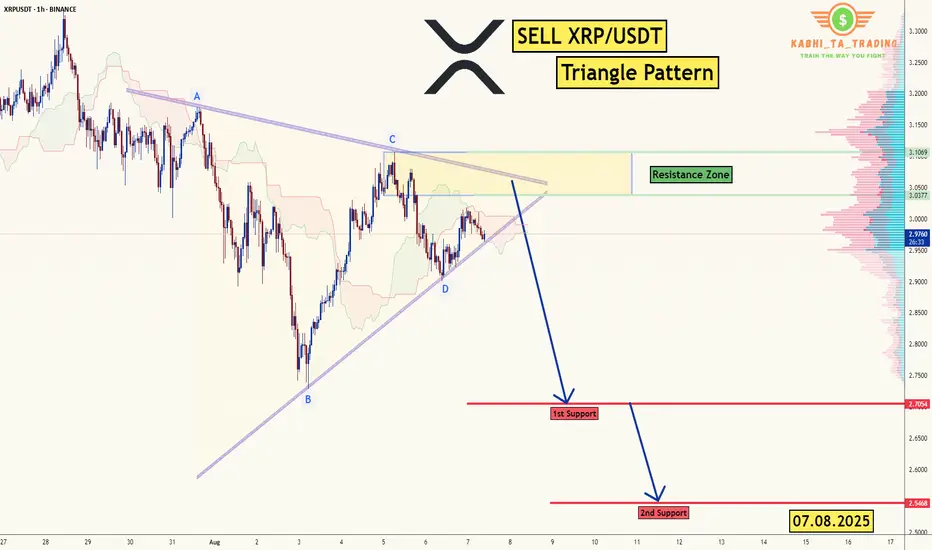
XRP/USDT -H1 - Triangle Breakout (07.08.2025)The XRP/USDT Pair on the H1 timeframe presents a Potential Selling Opportunity due to a recent Formation of a Triangle Breakout Pattern. This suggests a shift in momentum towards the downside in the coming Days.
Possible Short Trade:
Entry: Consider Entering A Short Position around Trendline Of The Pattern.
Target Levels:
1st Support – 2.7054
2nd Support – 2.5468
🎁 Please hit the like button and
🎁 Leave a comment to support for My Post !
Your likes and comments are incredibly motivating and will encourage me to share more analysis with you.
Best Regards, KABHI_TA_TRADING
Thank you.
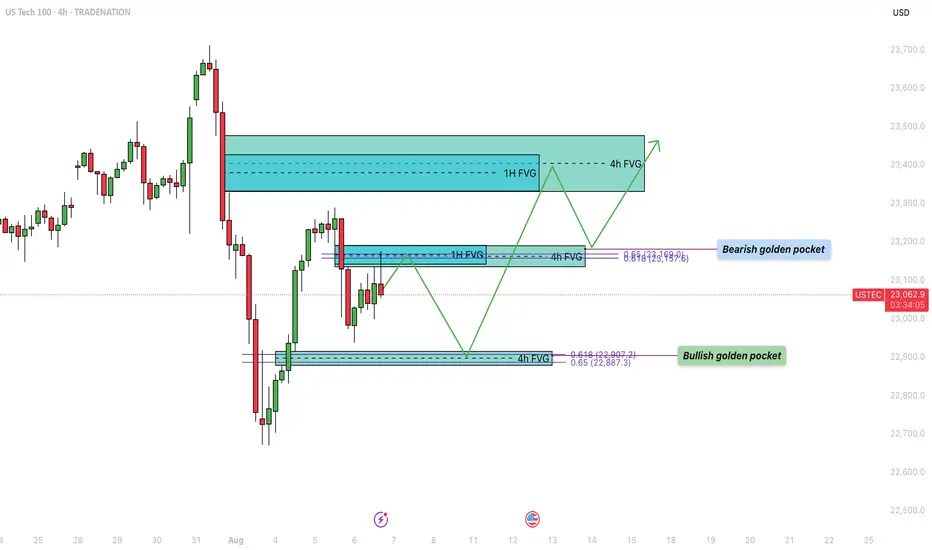
US100 - Bullish trajectory to fill the inbalance zones!Over the past week, the US Tech 100 (US100) experienced a sharp decline, dropping into a significant support zone. During this bearish move, several fair value gaps (FVGs) formed on both the 4-hour and 1-hour timeframes, which remain unfilled. Currently, price action is retracing upward, aiming to fill these imbalances. The structure of the market suggests that both bullish and bearish scenarios are in play, depending on how price reacts to key levels marked by these FVGs and Fibonacci retracement zones.
Bearish Resistance
The first major area of resistance is located around the $23,160 level, which has just been tapped. This zone presents a strong potential turning point due to the confluence of a 1-hour and a 4-hour fair value gap, which perfectly align with the 0.618–0.65 Fibonacci retracement level, also known as the golden pocket. This cluster of technical signals increases the probability that this level will act as a strong supply zone, potentially initiating a rejection back toward the lower support area.
Bullish Support
On the downside, a key level to watch is around $22,900. This zone marks a 4-hour FVG that was formed during the recent upward move. Importantly, this area also coincides with the golden pocket from that very same leg up, offering a compelling confluence for bullish support. If price revisits this level, it may act as a strong demand zone, providing a springboard for the next leg higher, particularly if buyers step in aggressively to defend it.
Bullish Trajectory
If support at $22,900 holds, the bullish trajectory suggests a possible continuation toward the $23,400 region. This upper target contains a large overlapping 1-hour and 4-hour FVG that remains unfilled. Historically, price tends to revisit and fill such imbalances before choosing a definitive direction. A bounce from the lower support zone and a successful break of the $23,160 resistance could pave the way for a clean move toward this higher target, completing the FVG fill sequence.
Final Thoughts
The US100 is currently navigating a key technical crossroads. With multiple unfilled fair value gaps and well-aligned Fibonacci levels on both the upside and downside, the next few sessions will be critical in determining short-term direction. If the $23,160 resistance continues to hold, a pullback to $22,900 could offer a high-probability long setup, while a clean break above this resistance opens the door to filling the higher FVGs.
-------------------------
Disclosure: I am part of Trade Nation's Influencer program and receive a monthly fee for using their TradingView charts in my analysis.
Thanks for your support. If you enjoyed this analysis, make sure to follow me so you don't miss the next one. And if you found it helpful, feel free to drop a like 👍 and leave a comment 💬, I’d love to hear your thoughts!
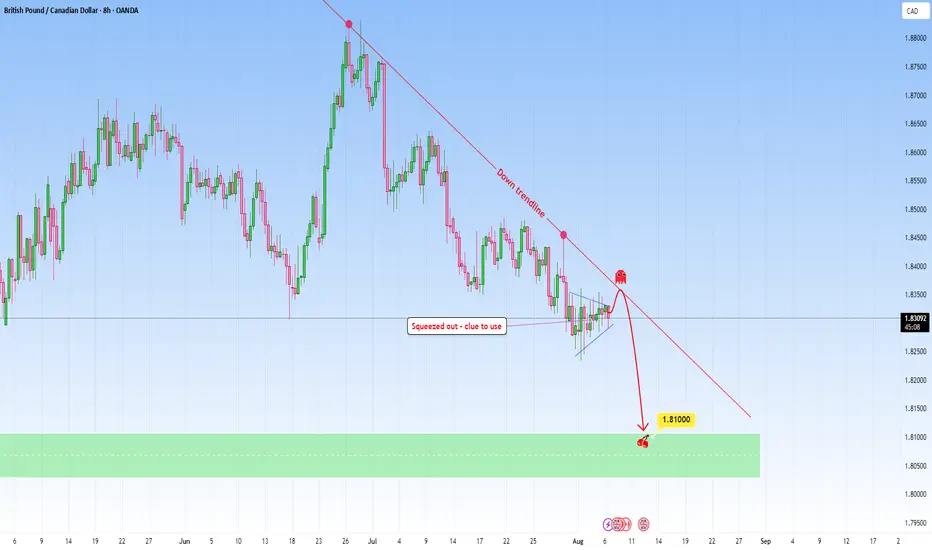
GBPCAD: Could we see price continue to the downside?Price on GBPCAD looks quite interesting at the moment, this latest moves continues the narrative of a downtrend.
As it is following a downtrend, each touch has served as a catalyst for a directional move. The most recent interaction is particularly interesting, because it's hovering here for some time now, and this could be a clue that we can use.
What may follow is subtle but telling: compression at trendline, low-volume candles suggesting exhaustion, all aligning for more potential release downward.
My target would be toward 1.8100 where we have a clear support zone. Momentum has respected structure and if this move plays out, I don't think it will be a breakout, but a continuation of a narrative that’s already been happening. This is what makes the setup so compelling. It’s not new, it’s the a "story being told".
Though a scenario for more upside is possible and can happen just as much. Still, I would take the side for more downside taken into account all above.
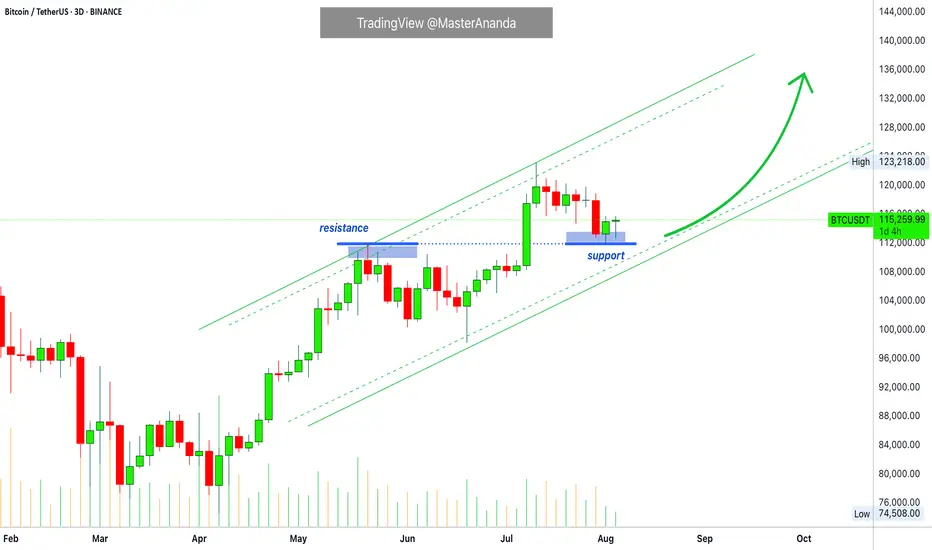
Bitcoin Update • Resistance Turned Support · TOP Altcoins ChoiceTraders hedge for a Bitcoin drop below $100,000?
Meanwhile, Bitcoin is rising trading above 115K. Resistance turned support.
The last all-time high turned out to work as support this time.
The retrace from 123,000 to 115,000 amounts to a 6.5% decline, which simply means that Bitcoin is trading at or near resistance. Staying close to resistance after a new all-time high is major signal of strength. A bearish signal would only become real if a high volume drop develops or Bitcoin closes weekly below 110,000. This isn't happening right now so the bulls win.
Are you a bull? You win.
I am a bull. I win.
👉 As Bitcoin continues bullish the altcoins market will continue to grow. Knowing this, which one is your Top Altcoin Choice ?
👉 Leave a comment with your favorite altcoin.
I will do a full analysis for you and publish in my profile.
If the chart doesn't look great, I might reply right here in the comments section.
Thanks a lot for the continued support. It is appreciated.
Let's play again.
Let's trade again.
Together we can win.
Success, profits and growth long-term.
Namaste.
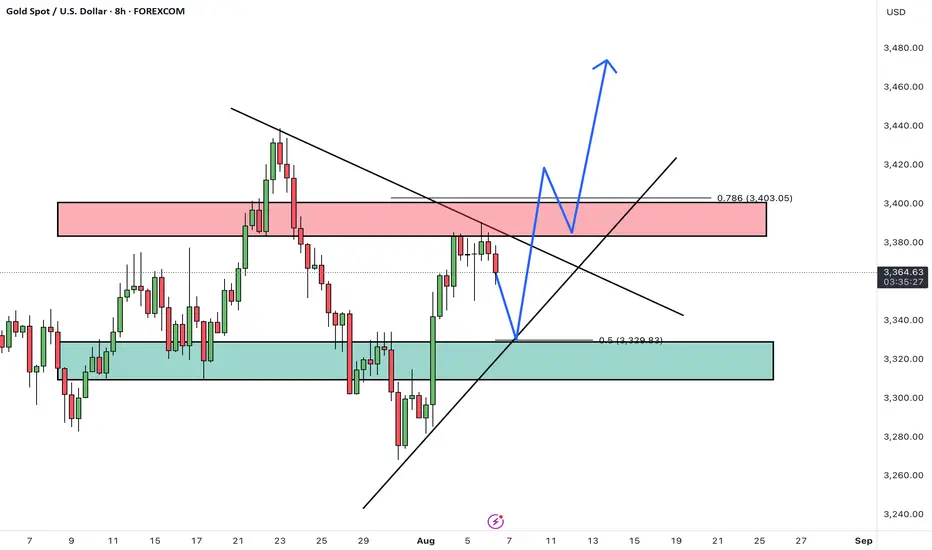
XAUUSDHello Traders! 👋
What are your thoughts on GOLD?
Gold remains trapped below the key $3,390–$3,400 resistance zone, which has rejected price multiple times in recent sessions.
A short-term pullback toward the marked support level is likely.
From that zone, we expect buyers to step in, leading to another bullish push toward the resistance, and this time, a potential breakout above the $3,400 level.
As long as the price stays above support, the bullish outlook remains intact.
A confirmed break above $3,400 could open the path toward new highs.
Don’t forget to like and share your thoughts in the comments! ❤️
Gold 30Min Engaged ( Bearish & Bullish Entry Detected )Time Frame: 30-Minute Warfare
Entry Protocol: Only after volume-verified breakout
🩸Bearish Reversal From - 3397
🩸Bullish Reversal : 3341
➗ Hanzo Protocol: Volume-Tiered Entry Authority
➕ Zone Activated: Dynamic market pressure detected.
The level isn’t just price — it’s a memory of where they moved size.
Volume is rising beneath the surface — not noise, but preparation.
🔥 Tactical Note:
We wait for the energy signature — when volume betrays intention.
The trap gets set. The weak follow. We execute.
Support & Resistance – Quick Guide In 5 StepsSupport and resistance are key concepts in technical analysis that help traders identify where price is likely to react.
Support acts like a floor — a level where buying interest is strong enough to prevent further declines.
Resistance acts like a ceiling — a level where selling pressure can stop price from rising.
These zones often lead to bounces, reversals, or breakouts, and are used to plan entries, exits, and stop-losses.
How to Identify them:
1. Assess the chart.
2. Identify Swing Points: Look for repeated highs/lows and label them. (Flags)
3. Multiple touches: Highlight the zones with multiple touches. 2+ Touches are stronger.
4. Define: Clearly define the zones. Above is resistance, below is support.
5. Entry: When price makes it way down to support, wait for the reversal. Upon reversal enter on the low time confirmation. Ensure price has failed to break below the support.
Then set TP to the previous High/Resistance zone.
Tips:
Always treat S&R as zones, not exact lines.
Combine with trend, candlestick patterns, or volume for better confluences.
Avoid trading into strong S/R — wait for breaks or retests.

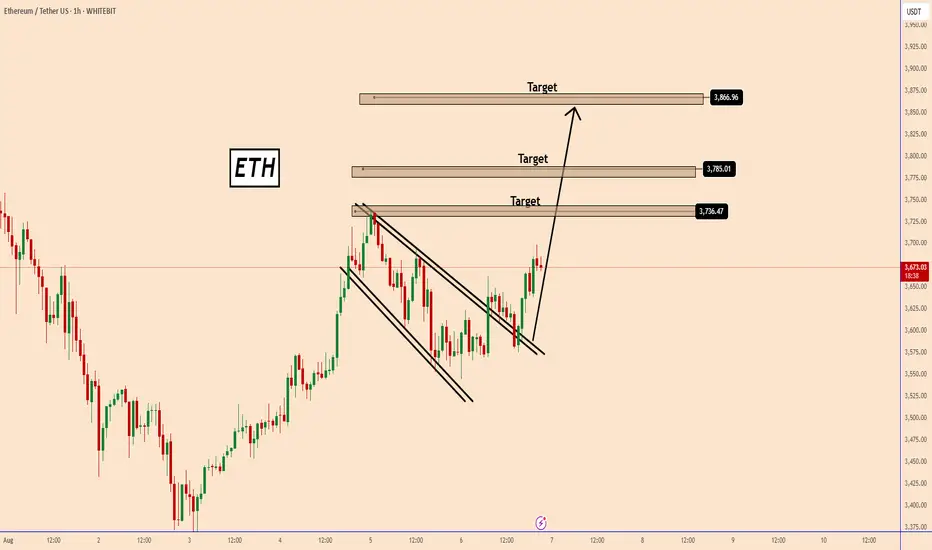
ETH Started Another Impulsive Wave!ETH Started Another Impulsive Wave!
Today ETH ended another bullish wave and is expected to rise further.
The price reaction looks good so far. The market is expecting a rate cut by the FED during the September meeting. According to Reuters, the chances of a rate cut by the FED increase to 85.5%.
It seems that the cryptocurrency market is also absorbing the news and ETH could benefit from this volume in the short term to rise to 3850.
You may find more details in the chart!
Thank you and Good Luck!
PS: Please support with a like or comment if you find this analysis useful for your trading day
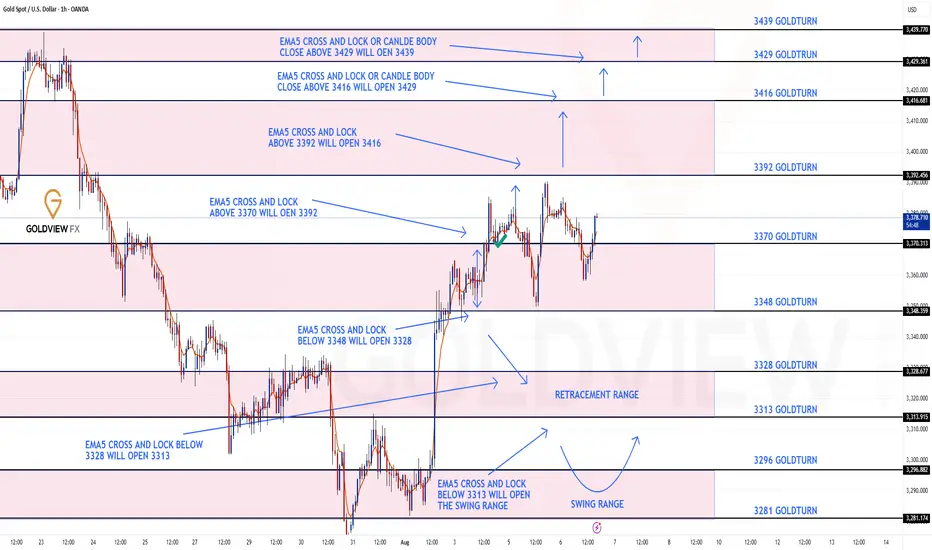
GOLD ROUTE MAP UPDATEHey Everyone,
Another great day in the markets with our chart idea playing out exactly as planned, allowing us to buy the dips.
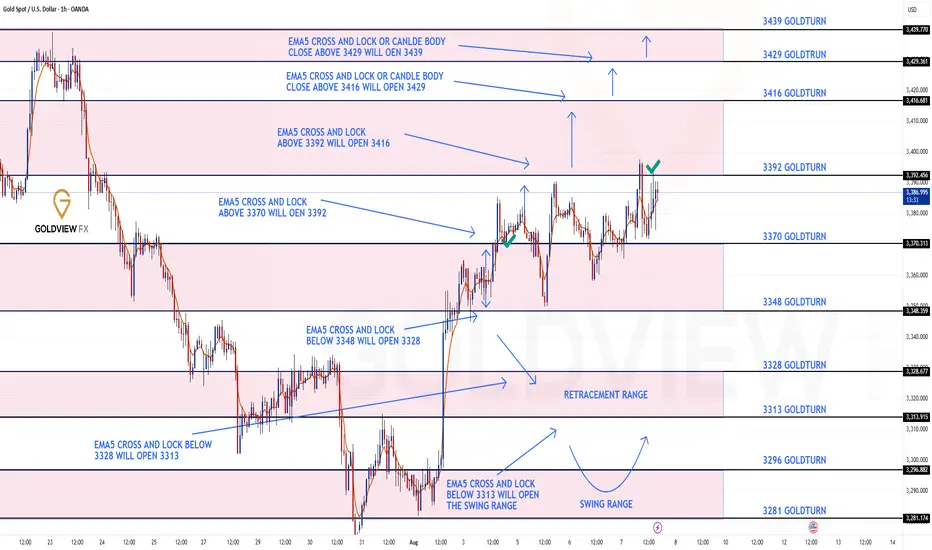
We’re seeing a repeat of yesterday's setup, the 3392 gap remains open after the EMA5 lock above 3370. We're getting drops into the lower Goldturn zones, giving us great opportunities to buy back in.
As long as we don’t get a confirmed lock below 3348, we continue to chase the open gap above at 3392.
We will keep the above in mind when taking buys from dips. Our updated levels and weighted levels will allow us to track the movement down and then catch bounces up.
We will continue to buy dips using our support levels taking 20 to 40 pips. As stated before each of our level structures give 20 to 40 pip bounces, which is enough for a nice entry and exit. If you back test the levels we shared every week for the past 24 months, you can see how effectively they were used to trade with or against short/mid term swings and trends.
The swing range give bigger bounces then our weighted levels that's the difference between weighted levels and swing ranges.
BULLISH TARGET
3370 - DONE
EMA5 CROSS AND LOCK ABOVE 3370 WILL OPEN THE FOLLOWING BULLISH TARGETS
3392
EMA5 CROSS AND LOCK ABOVE 3392 WILL OPEN THE FOLLOWING BULLISH TARGET
3416
EMA5 CROSS AND LOCK ABOVE 3416 WILL OPEN THE FOLLOWING BULLISH TARGET
3429
EMA5 CROSS AND LOCK ABOVE 3429 WILL OPEN THE FOLLOWING BULLISH TARGET
3439
BEARISH TARGETS
3348
EMA5 CROSS AND LOCK BELOW 3348 WILL OPEN THE FOLLOWING BEARISH TARGET
3328
EMA5 CROSS AND LOCK BELOW 3328 WILL OPEN THE FOLLOWING BEARISH TARGET
3313
EMA5 CROSS AND LOCK BELOW 3313 WILL OPEN THE SWING RANGE
3296
3281
As always, we will keep you all updated with regular updates throughout the week and how we manage the active ideas and setups. Thank you all for your likes, comments and follows, we really appreciate it!
Mr Gold
GoldViewFX
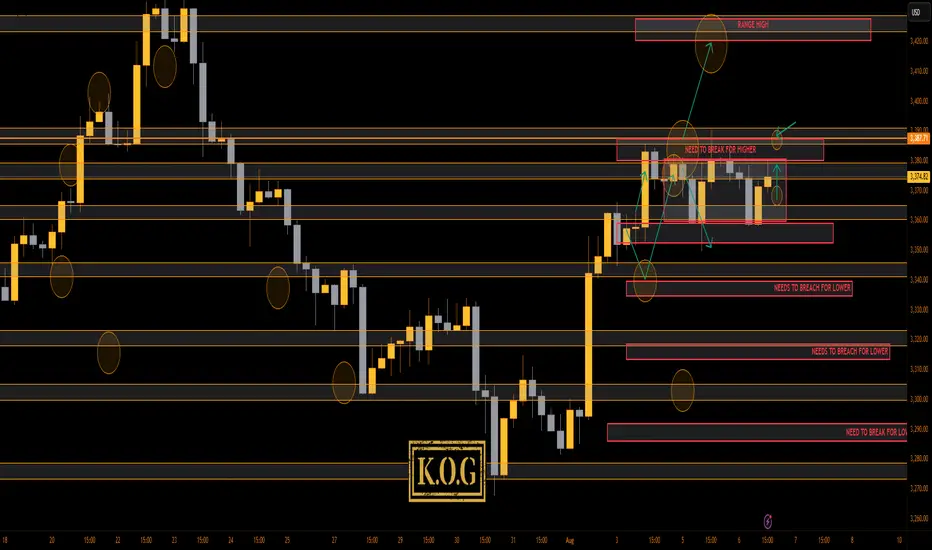
THE KOG REPORT - UpdateEnd of day update from us here at KOG:
As anticipated in the morning review, low volume day which resulted in this range still in play and price just making the sideways up and down move.
That's where we stand at the moment with no break above the red box for higher pricing at the moment. We managed to bag 3 decent set ups of 50pips each but we didn't get the move we wanted.
We have highlighted the key areas now and if you look closely on the hourly, we're in slight triangle formation. The range has also been drawn on the chart so we'll wait for the break out now.
Support here 3365, while resistance stands at the 3385 level.
Not much more to report on gold unless we break above that red box.
As always, trade safe.
KOG
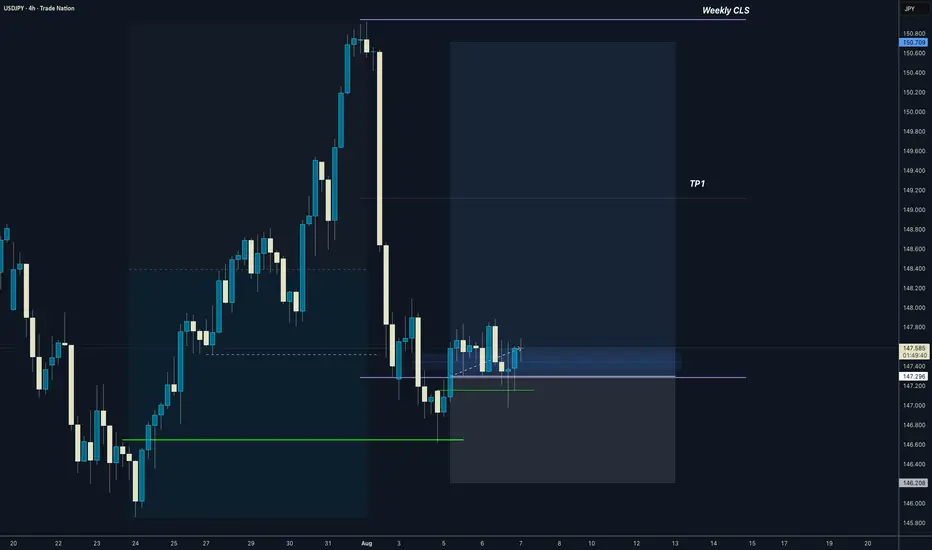
USDJPY I Weekly CLS I Model 1 I TP1 50% then full CLSYo Market Warriors ⚔️
Fresh outlook drop — if you’ve been riding with me, you already know:
🎯My system is 100% mechanical. No emotions. No trend lines. No subjective guessing. Just precision, structure, and sniper entries.
🧠 What’s CLS?
It’s the real smart money. The invisible hand behind $7T/day — banks, algos, central players.
📍Model 1:
HTF bias based on the daily and weekly candles closes,
Wait for CLS candle to be created and manipulated. Switch to correct LTF and spot CIOD. Enter and target 50% of the CLS candle.
For high probability include Dealing Ranges, Weekly Profiles and CLS Timing.
Analysis done on the Tradenation Charts
Disclosure: I am part of Trade Nation's Influencer program and receive a monthly fee for using their TradingView charts in my analysis.
Trading is like a sport. If you consistently practice you can learn it.
“Adapt what is useful. Reject whats useless and add whats is specifically yours.”
David Perk aka Dave FX Hunter
💬 Don't hesitate to ask any questions or share your opinions
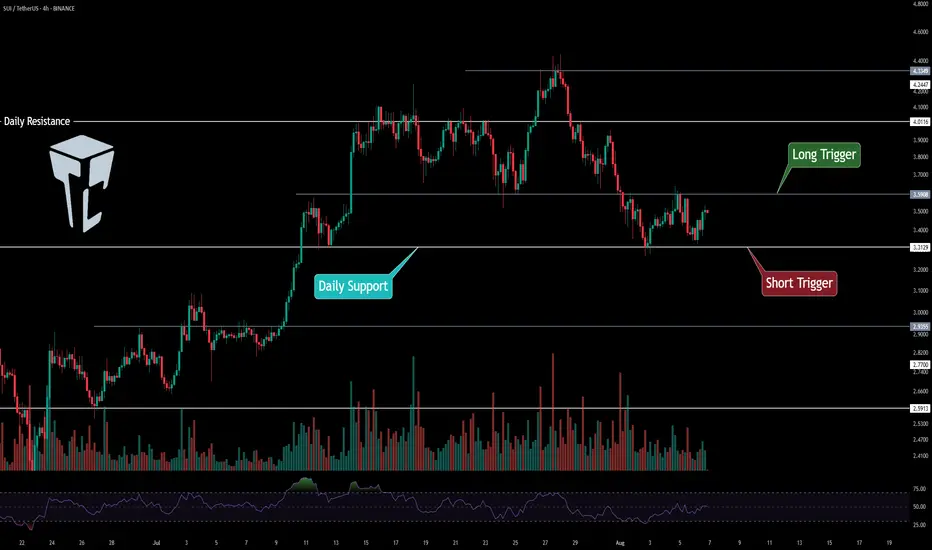
TradeCityPro | SUIUSDT Is the best time to buy ?👋 Welcome to TradeCityPro Channel!
Let's analyze and review one of the most popular coins in the market, sui, and update our previous analysis and find new triggers
🌐 Overview of Bitcoin
Before starting the analysis, I want to remind you again that we moved the Bitcoin analysis section from the analysis section to a separate analysis at your request, so that we can discuss the status of Bitcoin in more detail every day and analyze its charts and dominances together.
This is the general analysis of Bitcoin dominance, which we promised you in the analysis to analyze separately and analyze it for you in longer time frames.
Very briefly, we are going to take a look at the SUI chart in a nutshell so that we don't miss the triggers
We are currently inside our 4-hour range box and are fluctuating between 3.31 and 3.59
After the 3.59 break or the 3.31 fake breakout, I will definitely try to open a long position and I also need volume confirmation for this.
For short positions, the 3.31 break is a very good trigger, but try to pay more attention to other charts. If you open with the failure of this trigger, try to save your profit very quickly.
📝 Final Thoughts
Stay calm, trade wisely, and let's capture the market's best opportunities!
This analysis reflects our opinions and is not financial advice.
Share your thoughts in the comments, and don’t forget to share this analysis with your friends! ❤️
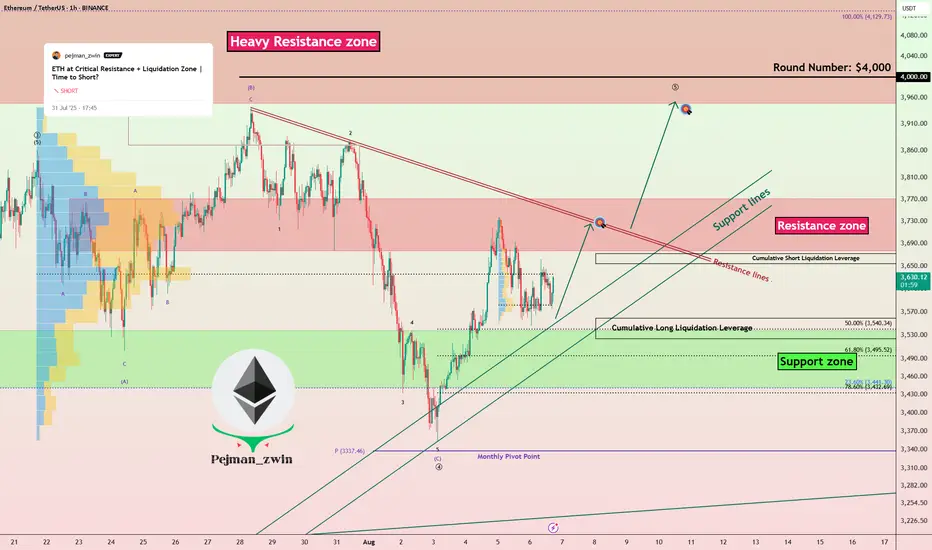
Ethereum Ready to Attack Resistances — Time to Long ETH?Ethereum ( BINANCE:ETHUSDT ) fell to the Support zone($3,538-$3,442) and Support lines as I expected in the previous idea .
Ethereum is currently trading near the Support zone($3,538-$3,442) , Support lines , and Cumulative Long Liquidation Leverage($3,559-$3,524) .
In terms of Elliott Wave theory , it seems that Ethereum has completed the main wave 4 . The main wave 4 has an Expanding Flat structure(ABC/3-3-5) . To confirm the main wave 4, we must wait for the Resistance zone($3,771-$3,677) and Resistance lines to be broken.
I expect Ethereum to trend higher in the coming hours and attack the Resistance lines and Resistance zone($3,771-$3,677) .
Cumulative Short Liquidation Leverage: $3,672-$3,645
Note: Stop Loss: $3,450 =Worst
Please respect each other's ideas and express them politely if you agree or disagree.
Ethereum Analyze (ETHUSDT), 1-hour time frame.
Be sure to follow the updated ideas.
Do not forget to put a Stop loss for your positions (For every position you want to open).
Please follow your strategy and updates; this is just my Idea, and I will gladly see your ideas in this post.
Please do not forget the ✅' like '✅ button 🙏😊 & Share it with your friends; thanks, and Trade safe.
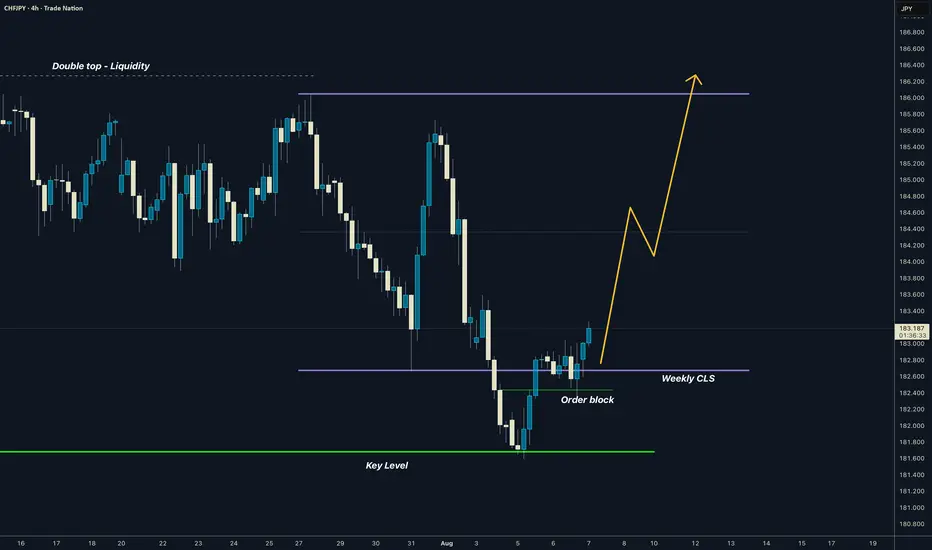
CHFJPY I Weekly CLS I Model 1 I Target 50% and Full CLS HighYo Market Warriors ⚔️
Fresh outlook drop — if you’ve been riding with me, you already know:
🎯My system is 100% mechanical. No emotions. No trend lines. No subjective guessing. Just precision, structure, and sniper entries.
🧠 What’s CLS?
It’s the real smart money. The invisible hand behind $7T/day — banks, algos, central players.
📍Model 1:
HTF bias based on the daily and weekly candles closes,
Wait for CLS candle to be created and manipulated. Switch to correct LTF and spot CIOD. Enter and target 50% of the CLS candle.
For high probability include Dealing Ranges, Weekly Profiles and CLS Timing.
Analysis done on the Tradenation Charts
Disclosure: I am part of Trade Nation's Influencer program and receive a monthly fee for using their TradingView charts in my analysis.
Trading is like a sport. If you consistently practice you can learn it.
“Adapt what is useful. Reject whats useless and add whats is specifically yours.”
David Perk aka Dave FX Hunter
💬 Don't hesitate to ask any questions or share your opinions
XAU/USD | Gold at a Turning Point – Breakout or Breakdown Ahead?By analyzing the gold chart on the 4-hour timeframe, we can see that after our last analysis, gold continued its correction and dropped to $3358. It’s currently trading around $3367, and for the bullish scenario to remain valid, we need to see price hold above $3358 and soon close above $3370. If this happens, another bullish move could follow.
Otherwise, if gold breaks and stabilizes below $3358, this scenario will be invalidated, and the alternative outlook suggests further downside toward $3349 and $3339. This analysis will be updated — and don’t forget to show your support, friends!
Please support me with your likes and comments to motivate me to share more analysis with you and share your opinion about the possible trend of this chart with me !
Best Regards , Arman Shaban

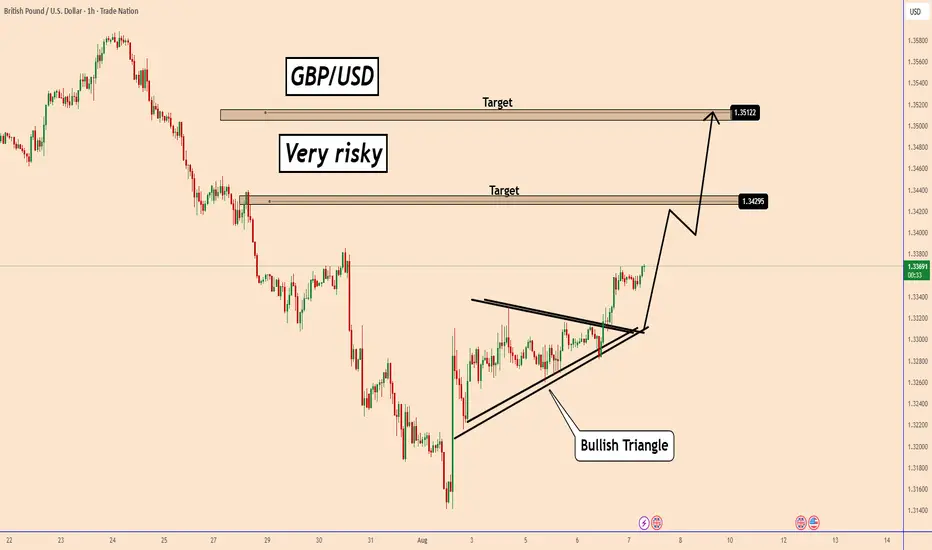
GBPUSD: Bullish Ahead of BOE Rate Decision!GBPUSD: Bullish Ahead of BOE Rate Decision!
Since yesterday, GBPUSD has started a short-term upward move, driven by the tariff mess and the potential impact it could have on major economies. At least those are the ones who will be facing these moves.
On the other hand, the market is predicting a rate cut by the FED in September and this could be another reason why the USD is weak so far. It may not make much sense, but that is the situation.
GBPUSD is in a good position to rise further, however today we have the Bank of England interest rate decision. Market participants expect the Bank of England to cut rates by 25 basis points to 4% versus the current 4.25%. The impact on the market remains unclear in my opinion.
It is a bullish situation with the Bank of England ahead. There is a high risk.
You may find more details in the chart!
Thank you and Good Luck!
PS: Please support with a like or comment if you find this analysis useful for your trading day
Disclosure: I am part of Trade Nation's Influencer program and receive a monthly fee for using their TradingView charts in my analysis.
GOLD ROUTE MAP UPDATEHey Everyone,
This is a follow-up update on our 1H chart and what can I say, another amazing result!
After hitting our bullish target at 3370 earlier this week, we confirmed the EMA5 cross and lock above 3370 confirming 3392, which I continued to highlight and remind as we bought the dips throughout the week. And today, we finally completed 3392 to perfection.
Next, we’ll be watching for an EMA5 lock above 3392 for a potential continuation. If that fails to lock, we may see some range play between 3392 and 3370.
We will keep the above in mind when taking buys from dips. Our updated levels and weighted levels will allow us to track the movement down and then catch bounces up.
We will continue to buy dips using our support levels taking 20 to 40 pips. As stated before each of our level structures give 20 to 40 pip bounces, which is enough for a nice entry and exit. If you back test the levels we shared every week for the past 24 months, you can see how effectively they were used to trade with or against short/mid term swings and trends.
The swing range give bigger bounces then our weighted levels that's the difference between weighted levels and swing ranges.
BULLISH TARGET
3370 - DONE
EMA5 CROSS AND LOCK ABOVE 3370 WILL OPEN THE FOLLOWING BULLISH TARGETS
3392 - DONE
EMA5 CROSS AND LOCK ABOVE 3392 WILL OPEN THE FOLLOWING BULLISH TARGET
3416
EMA5 CROSS AND LOCK ABOVE 3416 WILL OPEN THE FOLLOWING BULLISH TARGET
3429
EMA5 CROSS AND LOCK ABOVE 3429 WILL OPEN THE FOLLOWING BULLISH TARGET
3439
BEARISH TARGETS
3348
EMA5 CROSS AND LOCK BELOW 3348 WILL OPEN THE FOLLOWING BEARISH TARGET
3328
EMA5 CROSS AND LOCK BELOW 3328 WILL OPEN THE FOLLOWING BEARISH TARGET
3313
EMA5 CROSS AND LOCK BELOW 3313 WILL OPEN THE SWING RANGE
3296
3281
As always, we will keep you all updated with regular updates throughout the week and how we manage the active ideas and setups. Thank you all for your likes, comments and follows, we really appreciate it!
Mr Gold
GoldViewFX
EURUSD BUY SETUPThe price will form a head and shoulders pattern because the candle in the second shoulder is very strong, which indicates that it will break the neck of the pattern. We also have a stronger bounce from below, so I expect an uptrend.
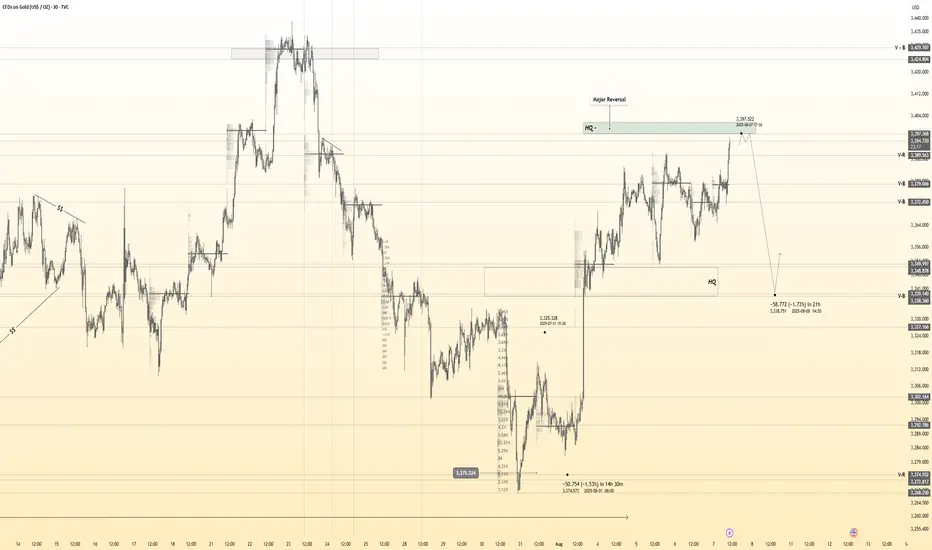
XAUUSD – Bears Gave It a Shot, But Bulls Still in Control1. Quick recap of yesterday
In yesterday’s analysis, I highlighted the possibility of a short-term correction on Gold and noted that, although risky, a short trade could be justified. Acting on that conviction, I took a short with a sniper entry, capturing over 250 pips in floating profit. However, Gold found strong support around 3350 and reversed aggressively. I closed the trade with a more modest +140 pips gain.
2. Key development: NY session reversal
Despite early signs of weakness, the New York session flipped the script, sending Gold back toward the top of the daily range. The daily close near highs tells us one thing:
➡️ The bulls aren’t done just yet.
3. Technical outlook
• Resistance remains firm at 3375–3380+ zone
• A clear breakout above this zone opens the door for 3400+, with a likely magnet at 3430
• As long as the market holds above this week’s low, dips are buyable opportunities
4. Trading plan
For now, the bias shifts back to the long side. I’m watching for intraday dips to build longs, with invalidation below this week’s low. The structure favors continuation — but only if 3380 gives way we have confirmation.
5. Final thoughts
Gold may have teased the bears, but the real power still lies with the bulls. If momentum kicks in above 3380, we could be on our way to test 3430 soon. 🏹
Disclosure: I am part of TradeNation's Influencer program and receive a monthly fee for using their TradingView charts in my analyses and educational articles.