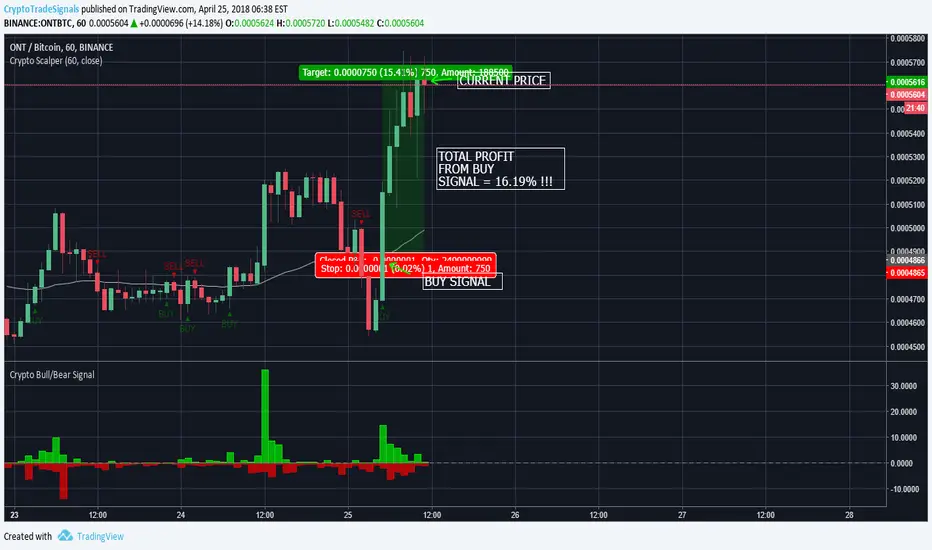
ONTOLOGY: BULL RUN LESS THAN 24 HOURS = 15.14% PROFIT!!!Our "Crypto Scalper" Trade Signal has correctly identified a buy in point on the 25th of April 2018.
Using this buy in point and selling at today's price, you would have expected to net 15.14% PROFIT!!! IN LESS THAN 24 HOURS!!!
The increase in price may also be explained by positive developments including:
April 24: Ontology is ready to release its new consensus algorithm VBFT after the release of its first batch of open-source projects on GitHub. VBFT algorithm combines Proof of Stake VRF and Byzantine Fault Tolerance . This allows consensus to be reached among nodes faster and more efficiently and is a substantial advancement among current consensus algorithms.
April 25: Ontology (ONT) releases their IDE (integrated development environment), Smartx.
It has been noted that almost all of trading volume (100%) for today is coming from Chinese exchanges (including Binance) suggesting substantial interest in the cryptocurrency in China.
What is interesting is that ONT remains in the green while all other cryptocurrencies have dropped in price.
ONT
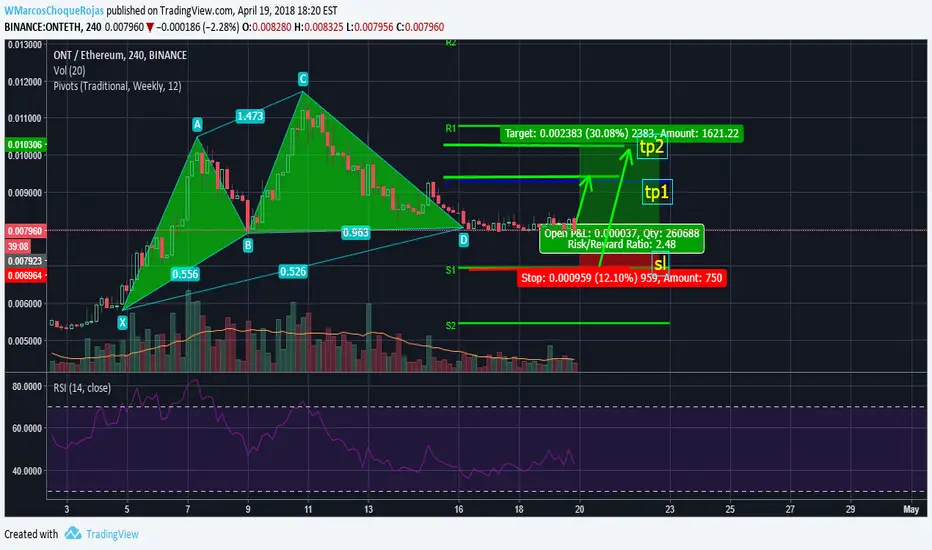
Ontology Trade Opportunity.Hey, I am back with another Trade Opportunity.
There is tons of Opportunities to profit in this market right now.
I have chosen one that seems really solid and has the best Risk/Reward ratio .
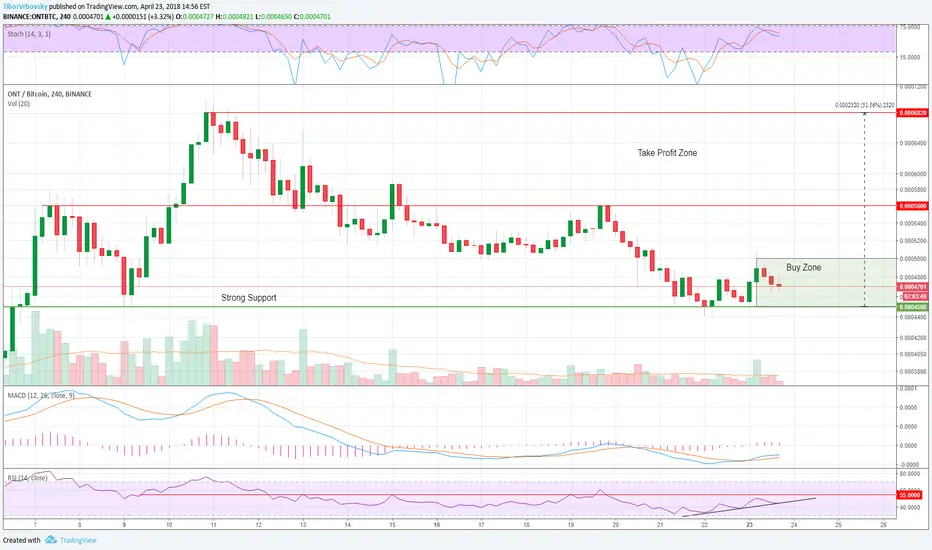
Buy - 4,500 - 5,000
Sel l - 5,600 - 6,820 ( Can go higher than that)
I dont like to use stop loss for one specific reason looking at this chart, you can see that ONT has twiced touched the line below support at 4,398 which has triggered many stop losses.
Why I am so confident about this trade?
Let me explain, ONT is only 2% up for past 7 days, which compared to whole market really low.
Also when a coin/token is long at strong support and is holding strong above the line that is being retested few times it often leads to breakout as you may see in my SNGLS/BTC trade opportunity that had 170% breakout, which isnt that bad, is it?
Okay, lets move on to Indicators.
MACD is giving signal to buy with more buyers incoming.
RSI would be great if we can test 55 and then break trough.
Hope I made your view on whats going on with Ontology somehow clearer.
If you like this TA let me know in the comments, Likes are aprreciated, Thanks !
If this gets a little bit of attention, I will update!
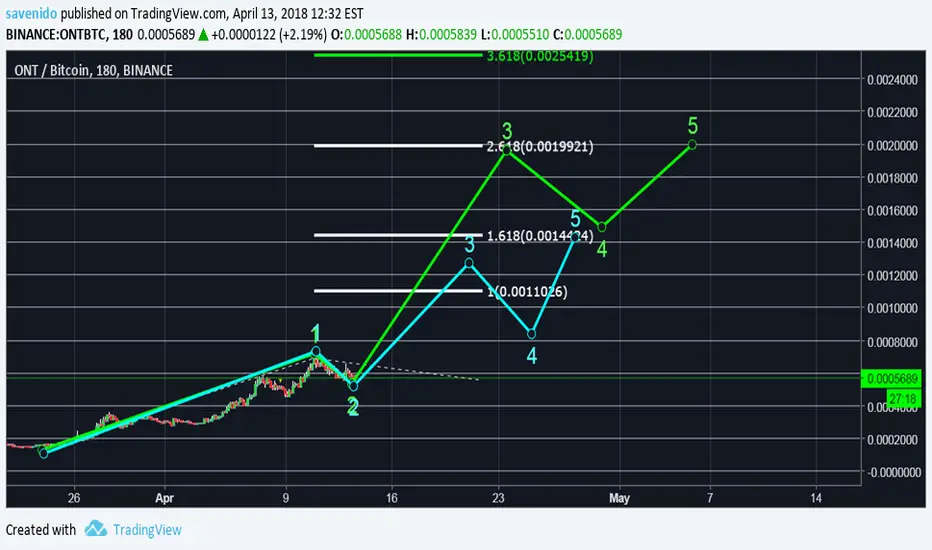
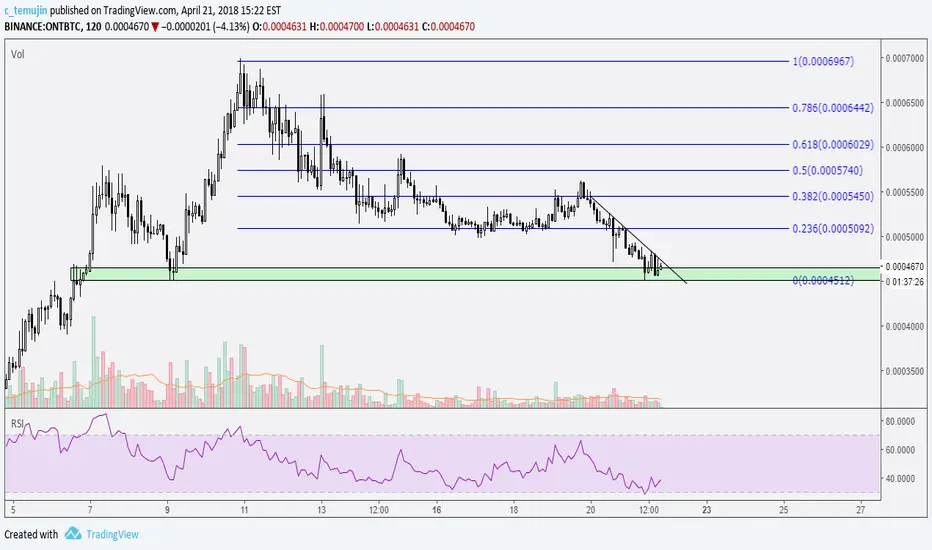
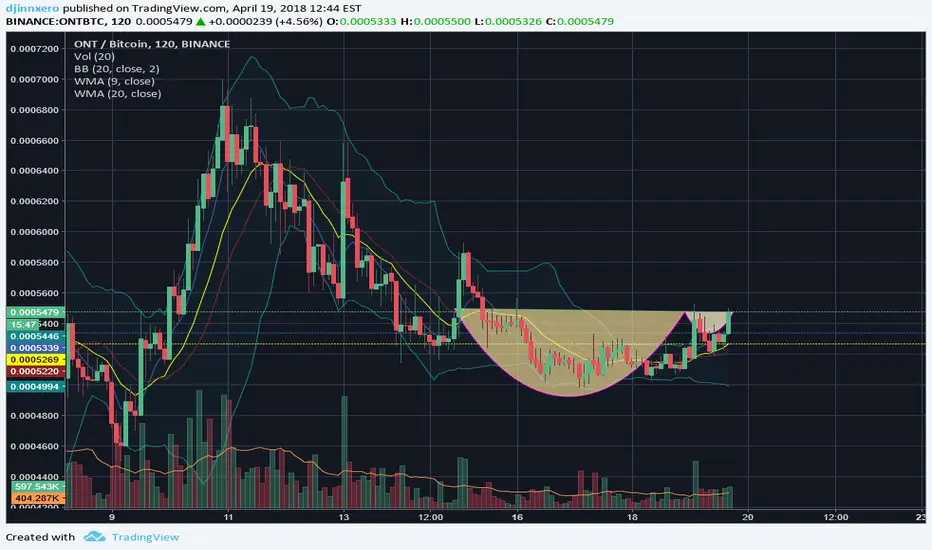
Ontology, ONTBTC Ready to Take Off Again?We've covered Ontology, ONTBTC previously but that didn't go as planned but now the chart looks more promising so let's take a look at it again shall we.
Ontology, ONTBTC one of the better performing coins since their launch on Binance in March has retraced quite a bit from its highs but has found good support around the 0.0004500.
It has bounced off that level several times already and it also happens to be near the .618 fib retracement level so it's an important support area to look at.
With a retracement of more than 35% and clear support, we could say that the corrective ABC wave is set and shown on the chart. So are we ready for the next impulse wave and next leg up for Ontology, ONTBTC?
The indicators RSI and MACD both moving upwards and enough room for further movement upwards.
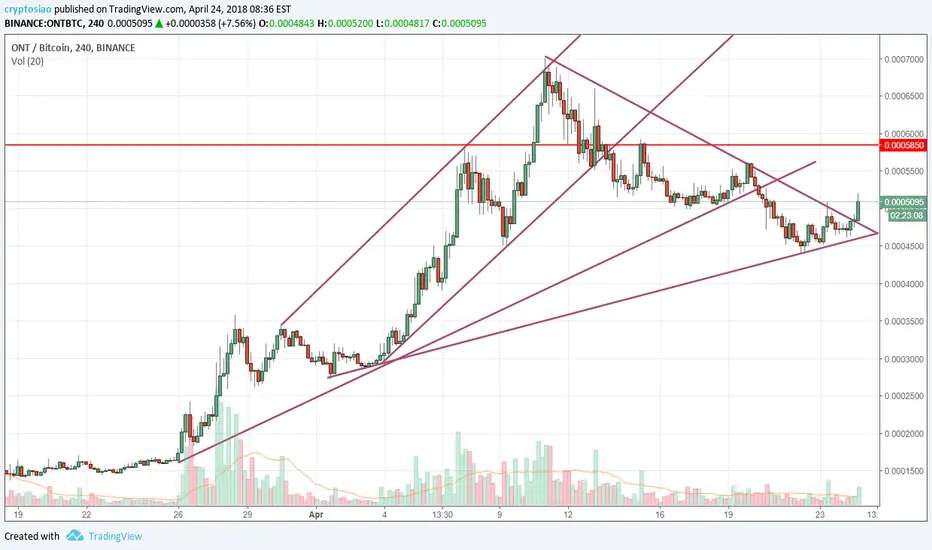
Also, there's a little bull flag forming at the moment so if ONTBTC manage to break out of that bull flag, then we can see it move up and break the triangle that it's in.
So if you want to swing trade Ontology, ONTBTC then this might be an interesting moment to do so or you can wait for some more confirmation by the break of the bull flag or triangle.
Trade Instructions
Buy Area:
0.0004500 - 0.0004800
Profit Targets:
Short - Mid Term
1. 0.0005295
2. 0.0005771
3. 0.0006175
4. 0.0006585
5. 0.0006928
6. 0.0007242
Stop Loss:
0.0004295
Note this is a bit of a tight stop. Remember, you can use a larger stop or no stop at all if you believe in this coin for the mid-long term. You can just ride it out and don't have to worry to get stopped out and miss the swing.
Leave a comment if you have any questions.
Like the post, if you liked it and share it if you loved it! This is for good karma.
And until next time, good luck with your trading!

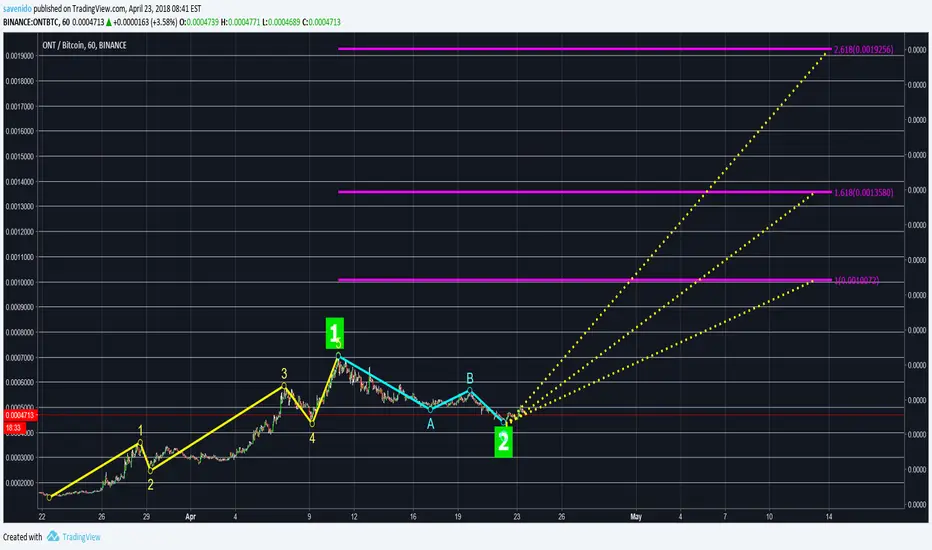
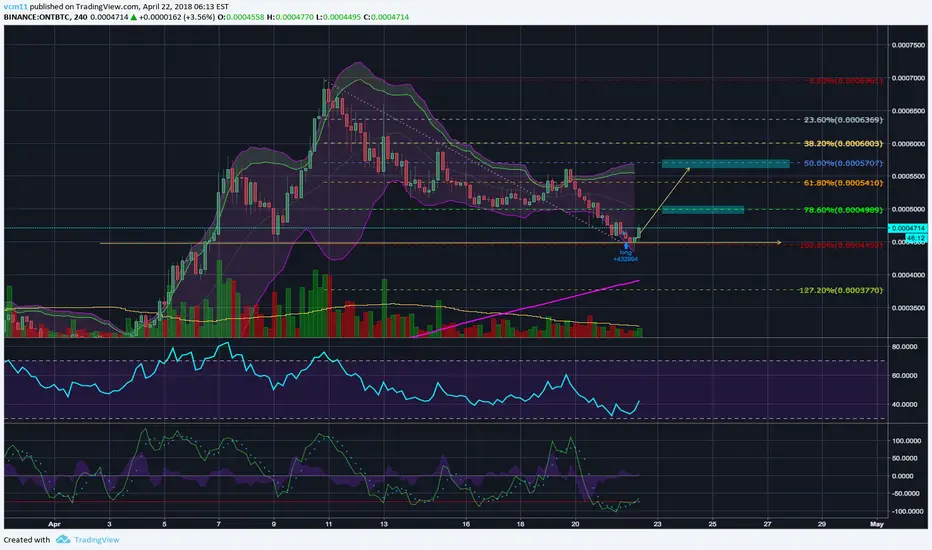
ONT ready to deliver a 50% to you.Hello friends, welcome to this analysis on ONT.
ONT is a really good project and it's favorable in the crypto land at the moment and you can see a lot of people are talking about it so you can expect some more upside from it.
As you can see in The chart ONT has cooled down after a massive run and it has formed a falling wedge. the target of the falling wedge is gonna be around 7.3k sats.
you can see that the price action is up trending inside the triangle and is getting ready to break up. As a trader, you wanna wait and identify the breakout and then buy the breakout. remember the break-out must have good volume and you should wait for the candle to close for confirmation. However, if you look at the RSI in 4-hour chart you can see that it has pulled off from the oversold area and is up trending to the upside which is giving me some confidence that we gonna see a break to the upside.
I'll update this post if I see the breakout.
Good luck trading. ;)

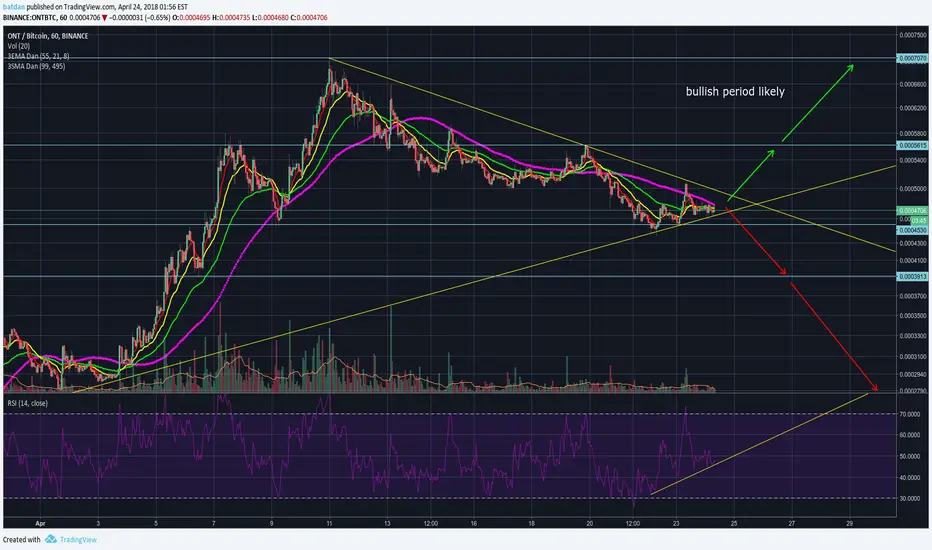
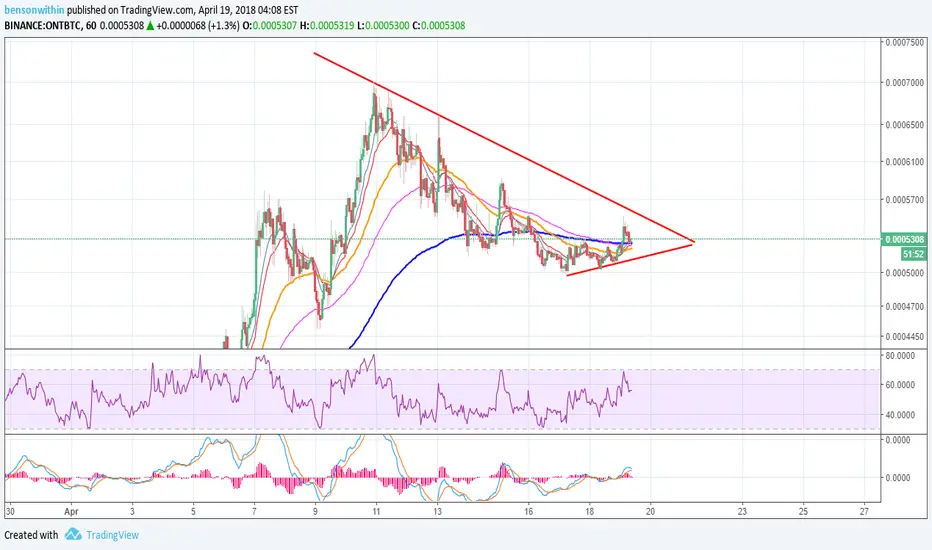
Ontology close to a break !I think that OnTology will start in a new bullish period
RSI bull's signal
EMA 9, 21, 55
SMA 99
300% possible earnings !
ONT making moves expect a good runNo description required everything is shown in the chart, comment and like if you agree.

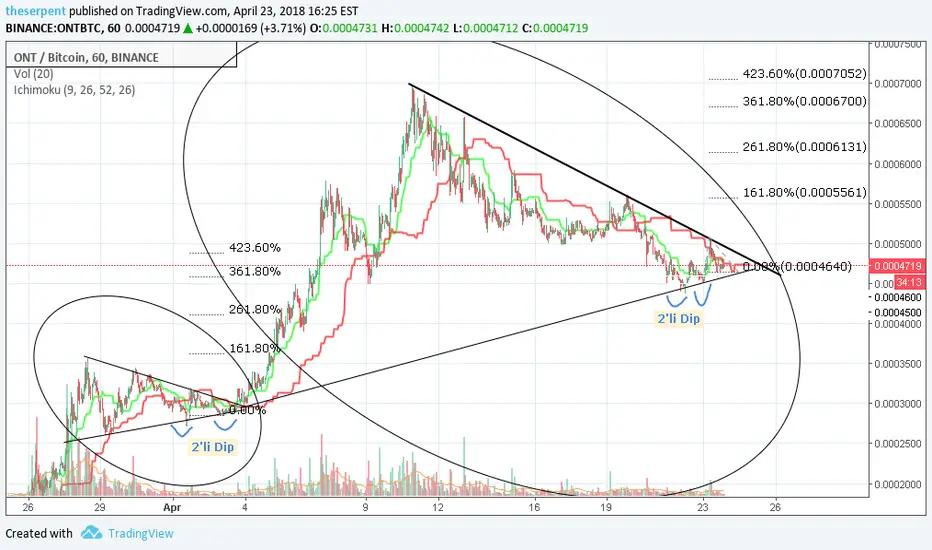
ONT $ONT $ONTBTCTrend dibinde ve üçgen formasyon sonunda 2'li dip....
Double bottom at the end of the trend/triangular formation...
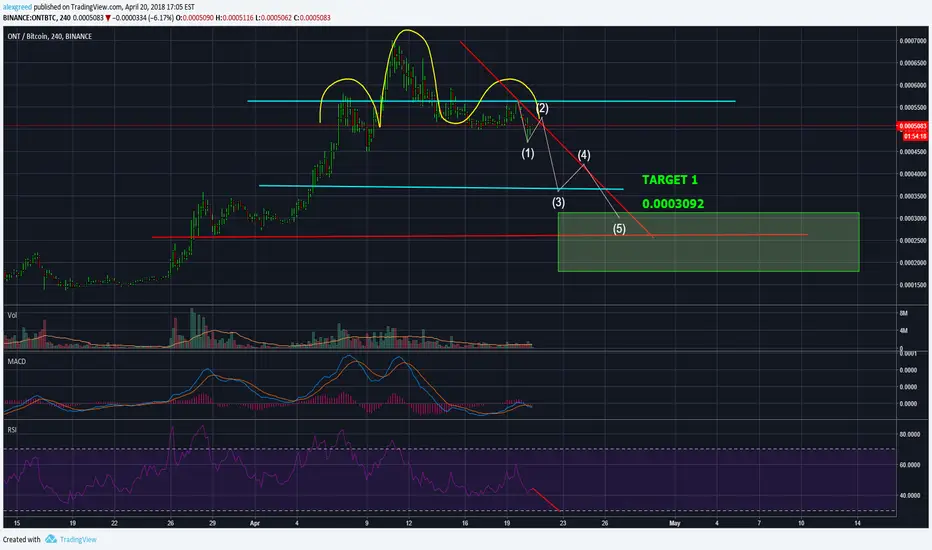
Ont on wave A of 4Good time to hop off IMO.... Hop back on on the 618 but we will have 1 more leg up IMO if you want to hold for a moment.

Ont Super Bullish charthVery Bullish chart possible break into the 3rd wave off the 236 retracement. this happens 15 percent of the time
$ONT #ONT - Bounce from support - LONG - A few resistance areas along the way but target for me is 5707 if ETH plays ball and continues it's run above the 200ma daily.
Watch Out For ONTKeep this one on your radar.
Ont always has good price action
Give it some time. Looks like it's getting ready for another breakout. Don't trade it just yet.
Wait for the 200 ema (blue line) to get underneath the price and for the 55 ema (orange line) to cross the 200 ema
Remember to wait on this to see where it goes, there is a possibility that it fails. I'll be sure to update it

Ontology head and shoulders spottedquick view, head and shoulders spotted, i will make more specific chart tommorow
ONT Head and ShouldersONT looks like it has created a head and shoulders pattern if it breaks the neckline then it could fall to where my red line goes.

ONT/BTC had an insane run! Retracement here, potential handle?!?ONT had such a nice run, it was so fun catching the bottom here and helping people get out of scary buys.
Had to let people know to just be patient and let it play out, the competitions on binance definitely helped!
So volume is overall down since it's top here, IF there is a bounce and the handle takes off, targets are set above in the 2.272-2.414 extensions~~

Is this ONT C&H in my head or???Just a pattern I see, no targets or entries.
I am a holder though, and will be paying close attention for the next few hours.
Back at it.$ONT breaking out of the triangle from the past couple days. Should prove to be an interesting alt season. Zoom out and look at the daily and you can see the bigger picture.

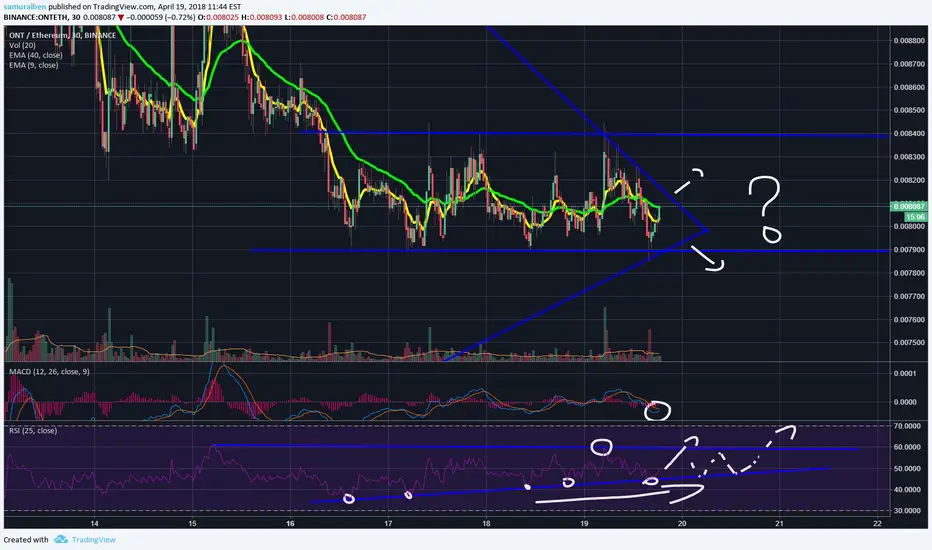
ONTETH setting up for upwards trend? looks like it might break here since going sideways for a while now everything seems to be going alright for now
could also just dumb always keep this in mind
Trade Safe
Ben
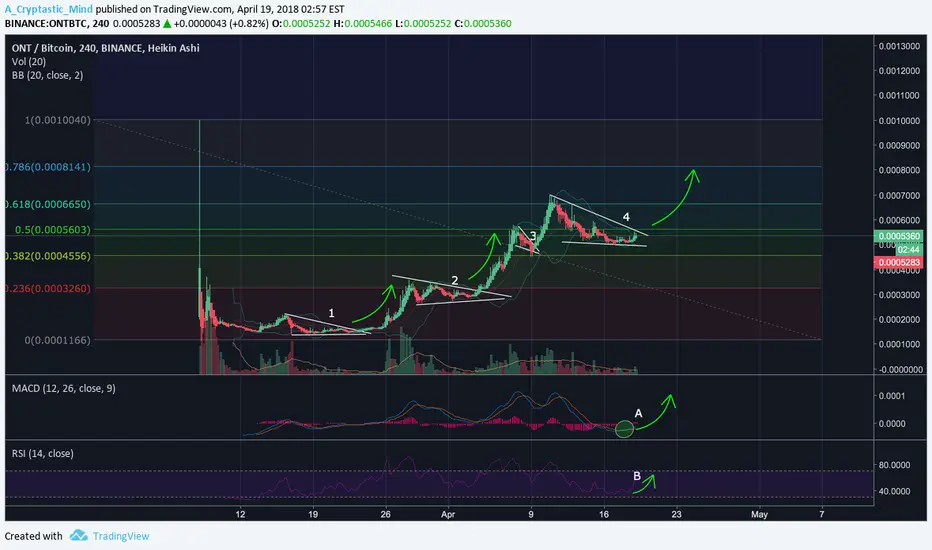
ONT – Bullish pennants all over the place – Pending break-outOntology has been really going for it, jumping from one bullish pennant to the next one. Today we are experiencing pennant number 4, accompanied by a golden cross in the MACD (A) and upward momentum in the RSI (B), so this one is likely to precede a strong next bull run.
Talking targets, the previous 61,8% Fibonacci level is first up at 6650 sat. After that, I believe we can hit 8141 sat. That’s a nice gain.
I’m long in this one for the longer term, but if you just want to make a nice trade, this is definitely a good opportunity.
There is also a nice divergence showing that there is indeed further accumulation, a good example showing this is this author's (@mertmaximilian) post:
E.g. cumulative volume index divergence on the daily:
This one speaks for itself. Good luck.
PS: merely my opinion, DYOR
PS2: always happy when you give a thumbs up :)