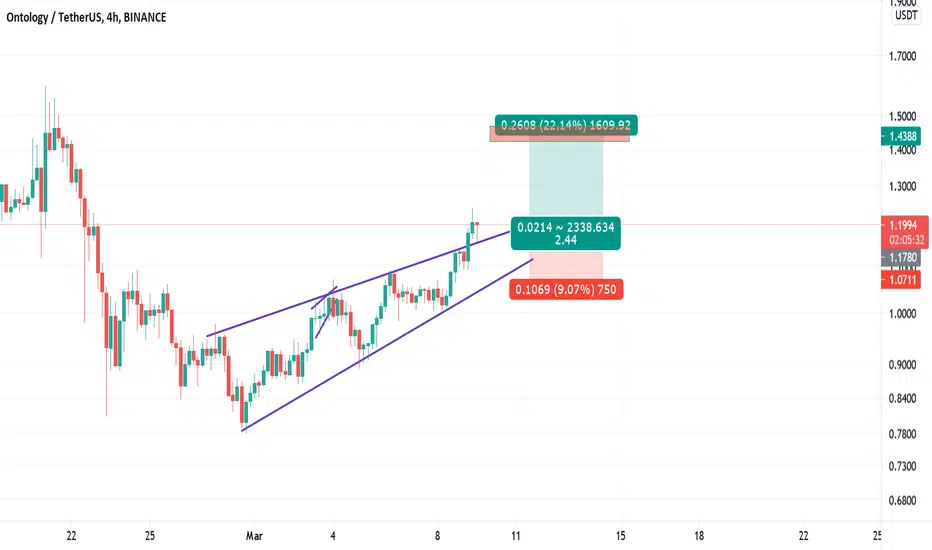
ONT/USDT - Bullish Triangle PatternHello traders and community, today we will tell ourselves shortly about the situation of ONT/USDT
Trend analysis
- As you can see from the ONT/USDT daily chart, the price of Ontology token is forming symmetrical triangle pattern (white zone on the chart) and also creating cup and handle pattern, that's why we can expect bullish movement (demonstrated on white lane) with 60 % probability. I recommend to wait for trustworthy signal for making a long trade position up to 2,3858 price level. Today's resistance level is on 1,3442 price level, support level is on 0,9838 price level and global trend stays bullish on this pair. Wish you good trades and luck with this token!
Chart pattern
- Symmetrical Triangle Pattern (processing)
- Cup and handle (processing)
Technical indicators
- RSI: market is still in boarders and is located near 57 level (not overheated, Neutral signal)
- MACD: MAs are prepared for upward movement + they get away from each other (Bull signal)
- BB: Volatility of the market started stabilizing after volatile movement accomplished (Neutral signal)
- MA (10,20): MA10 is above the level of MA20 and moving upward (Bull signal)
= Overall bullish signal movement
Dear friends, please push the like button, write comments below, follow me for more technical analysis and share this post with other traders - that would be the best support, Thank you for your attention!
Tell us about your opinion for making better decisions :)
P.S.: Information provided is only educational and should not be used to take action in the market.
Ontusdt


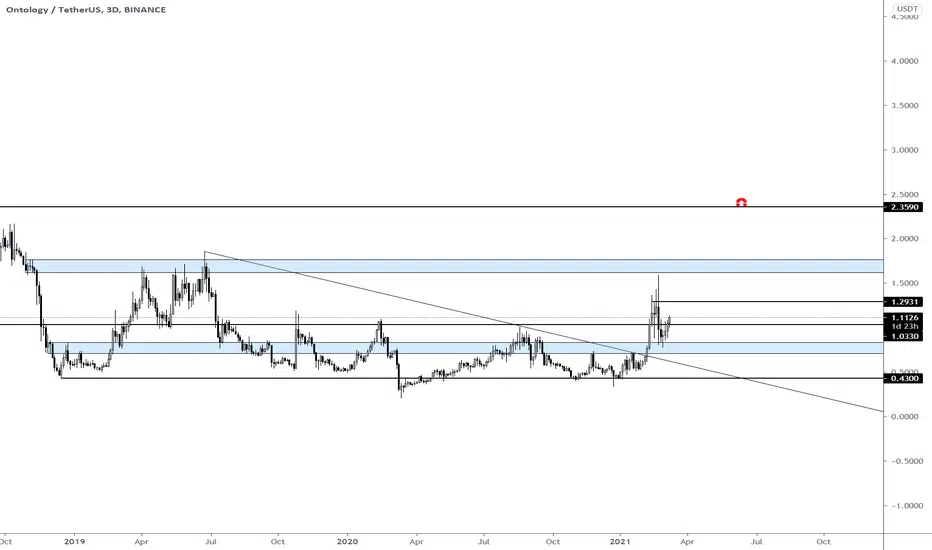
Ontology Falling wedge and Resistance breakoutOntology price is ready to breakout here the resistance it can move higher once breakout above the falling wedge and good close above the resistance
Ontology cryptocurrency price must close above the Resistance and flip the 1.20 zone.
Buy ontology when price close above 1.20 on daily
Stop : 0.87
Target : 1.25 , 1.34 , 1.42 , 1.5 , 1.65
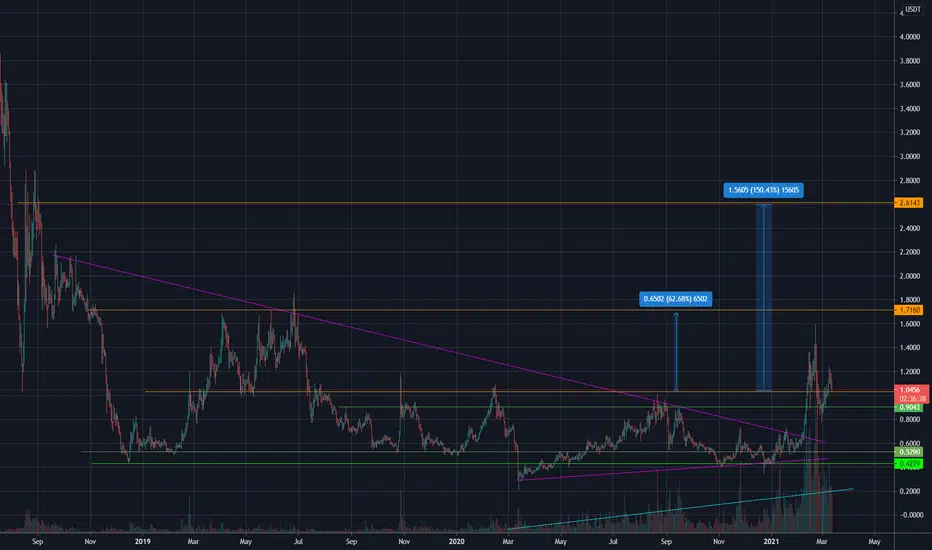
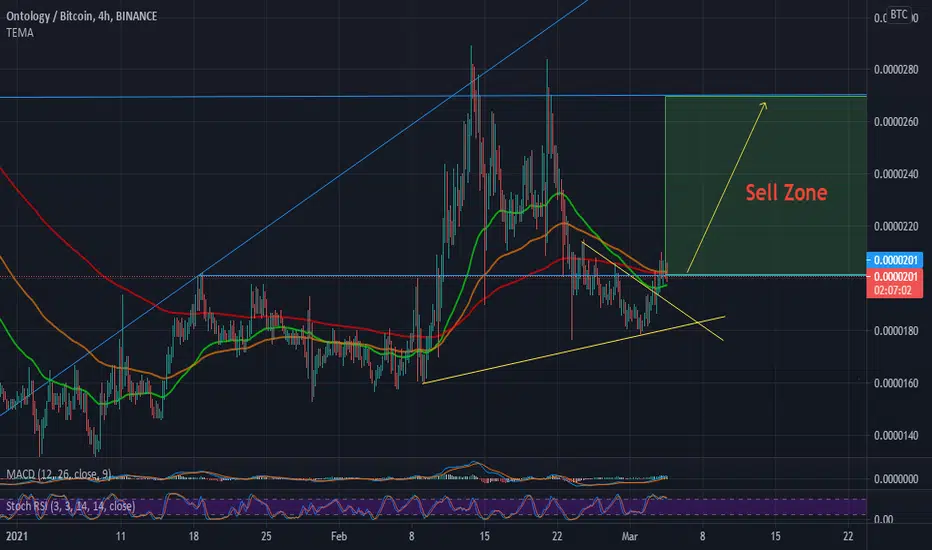
ONT/USDT Still >100% grow PotentialONT started its bullrun after the breakout of the falling wedge.
Currently in consolidation but look at the trading volume.
It is expected that ONT we make a next move upwards.
Enjoy the ride and don't be too greedy.
If you like the content, please like, comment and give this channel a follow.
Always do your own research and keep in mind that my charts and comments cannot be considered financial advice.
Cheers
ps.
Chart explanation:
Main lines:
- Green lines are tested support lines.
- Orange lines are resistance lines or, if we are above, possible support lines which were not tested yet.
- Cyan line is for volume trendline.
Helplines:
- Purple lines are trendlines we take a look at.
- Yellow lines are for visual help only.
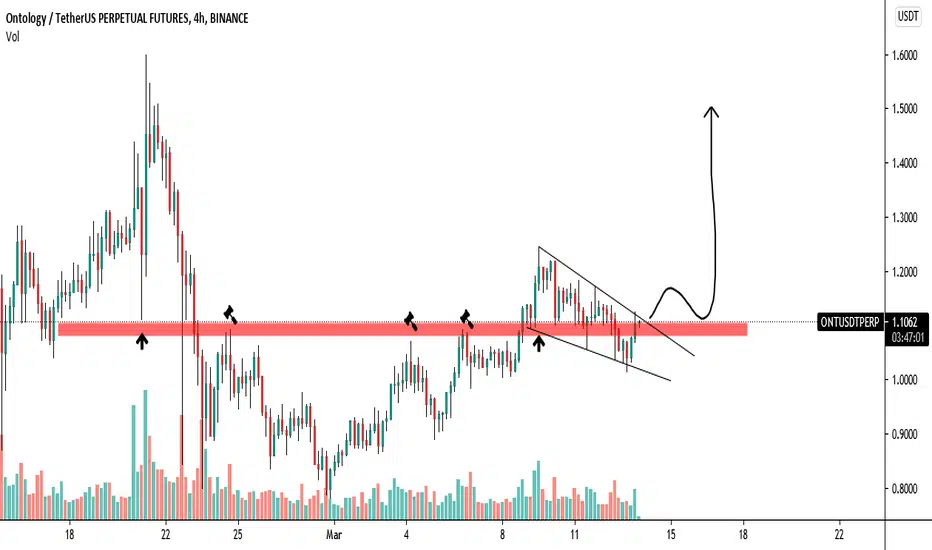
ONTUSDT (Waiting for the flag pattern breakout)ONTUSDT (1H CHART) Technical Analysis Update
Flag Pattern
ONT/USDT currently trading at $1.12
Buy-level: Only buy after flag pattern breakout ( Aove $1.14)
Stop loss: I will update once I see the breakout
Target 1: $1.19
Target 2: $1.24
Target 3: $1.35
Target 4: $1.50
Max Leverage: 2X
ALWAYS KEEP STOP LOSS...
Follow Our Tradingview Account for More Technical Analysis Updates, | Like, Share and Comment Your thoughts.

Scalping idea for ONTUSDTLet's see if it works or not. If BTC lets, it may break that pattern and may go up.
ONTUSDT Bullish AccumulationONTUSDT Bullish Accumulation.
Please read the chart carefully for the target area.

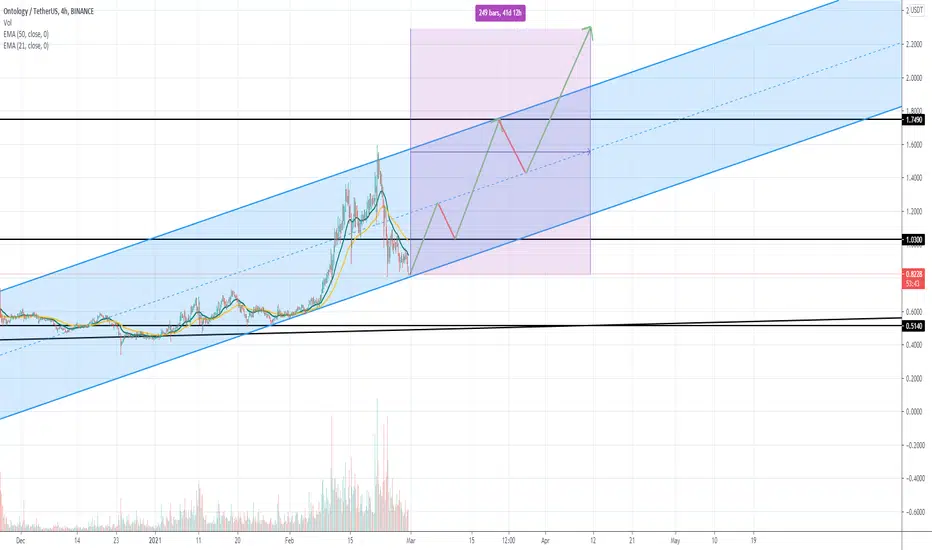
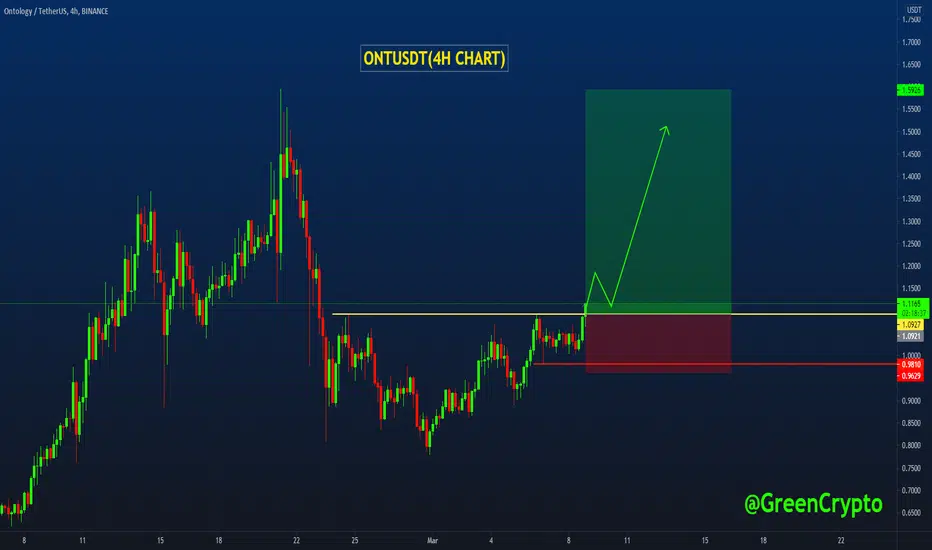
ONTUSDT ( Resistance breakout )ONTUSDT (4H CHART) Technical Analysis Update
Resistance Breakout
ONT/USDT currently trading at $1.10
Buy-level: Above $1.10
Stop loss: below $0.96
Target 1: $1.33
Target 2: $1.55
Target 3: $1.75
Max Leverage: 2X
ALWAYS KEEP STOP LOSS...
Follow Our Tradingview Account for More Technical Analysis Updates, | Like, Share and Comment Your thoughts.
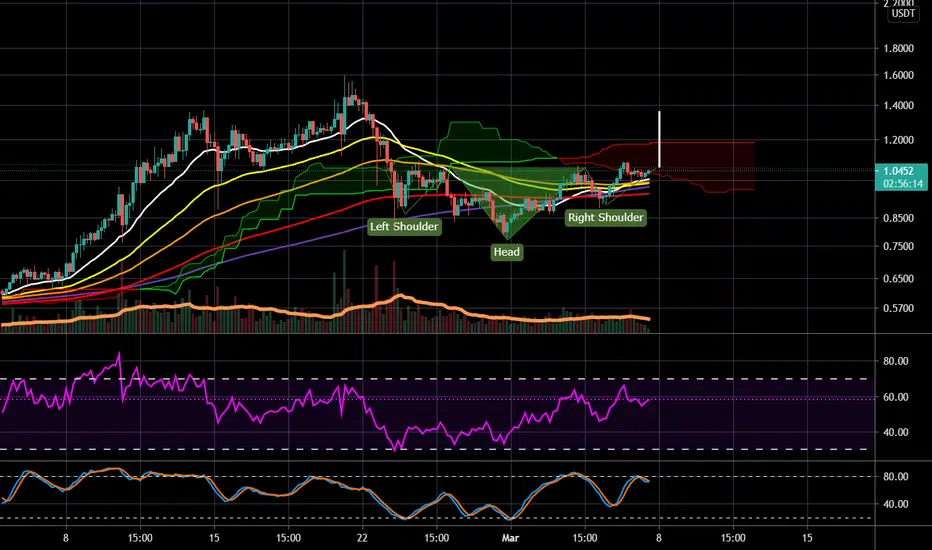
ONTUSDT 4H Inverted Head and Shoulders Trade SetupNEO GAS and ONT GAS have been moving quite strongly in the past couple of weeks, while ONT and NEO, their parent coins have been steadily gaining volume and ranging. Something big is coming! The 4HR has painted a nice trading range in the form of an inverted head and shoulders which could break up. Targets are shown on the chart as per classical charting techniques.
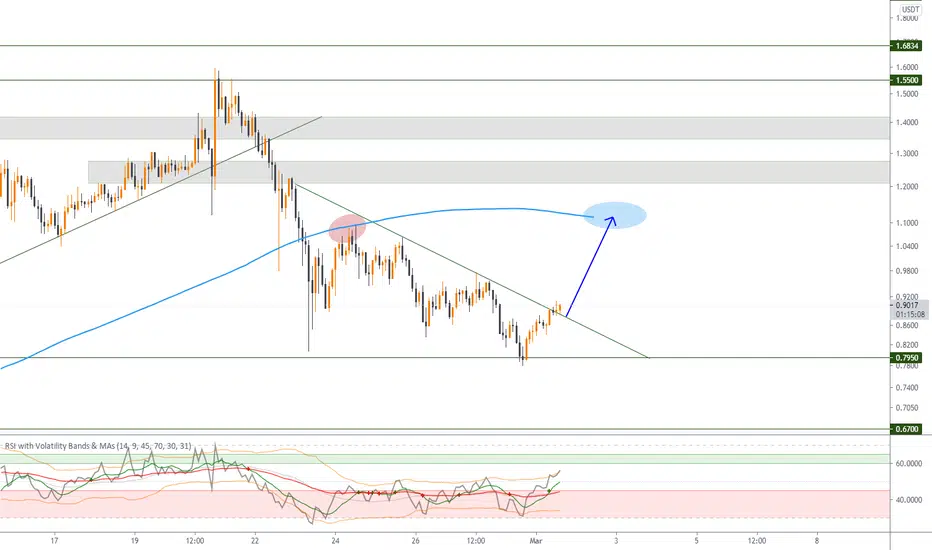
ONT/USDT : Above bearish zone BINANCE:ONTUSDT
Hello everyone 😃
ONT had a breakout from bearish trendline ( just like others... ).
But the important thing is Volatility;
Volatility had a bullish crossover recently and now it's above bearish zone !!
We expect a retest on MA 200 or higher for ONTOLOGY.
Attention: this isn't financial advice we are just trying to help people on their own vision.
Have a good day!
@Helical_Trades
ONTUSDTONT is going in the opposite direction of BTC, but it just had a rejection by resistance and bounced back up by a good support area. For opening a long position: Wait for a breakout which happens after the closure of a 4H candle above resistance. (as shown on chart)


Return of the popular ontology !Return of the popular ontology
In an hour-long time frame, an important resistance is breaking, and if it breaks and stabilizes high, it can grow well.
Buying position is offered

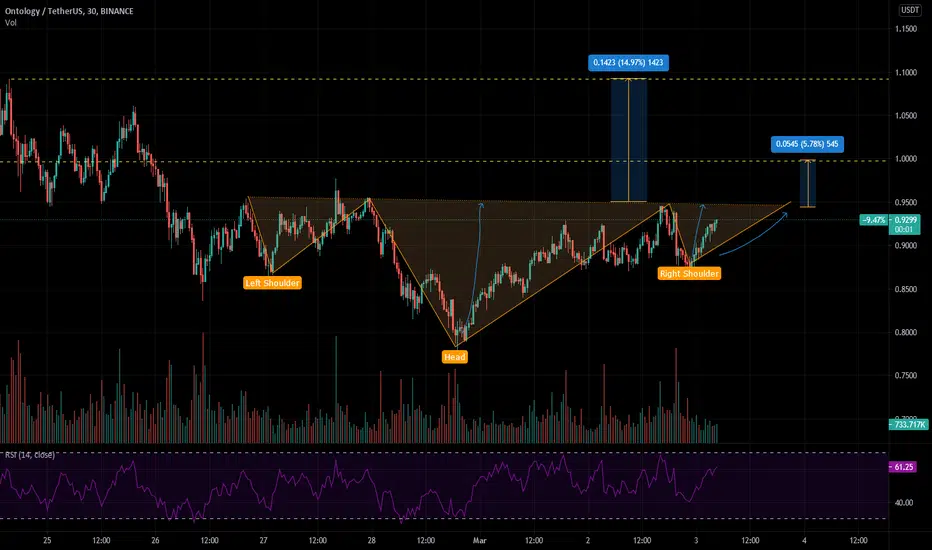
ONT/USDT Head and Shoulder Breakout.ONT/USDT pair has successfully retested the Neckline of the Inverse Head and Shoulder pattern after a high volume Breakout. Now, according to Wyckoff Accumulation Schematic, we need to see a Breakout of the AR resistance area (Red Area) to get to SOS .
NULS/USDT is a very similar setup:

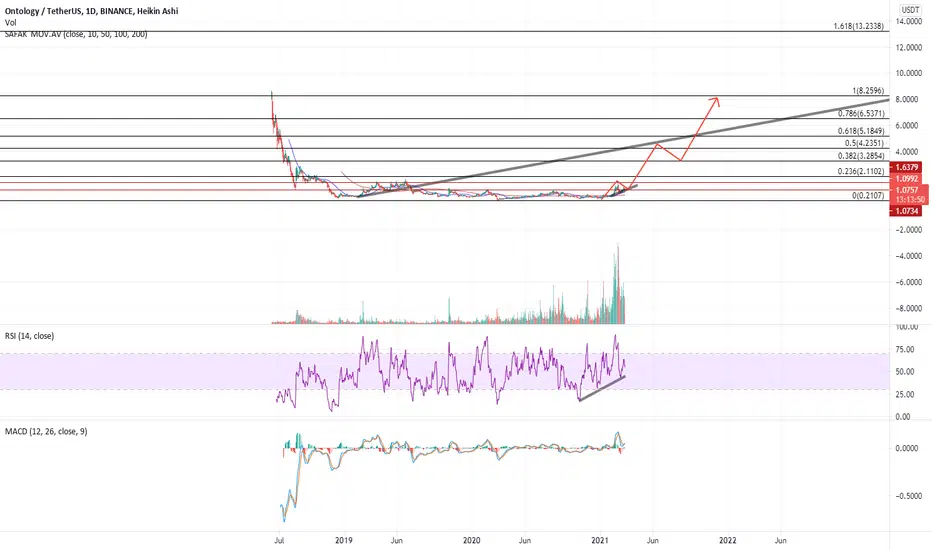
Bull trend based on Elliot wave theory and Fibonacci RetracementBased on the beginning of the rally in 2021.

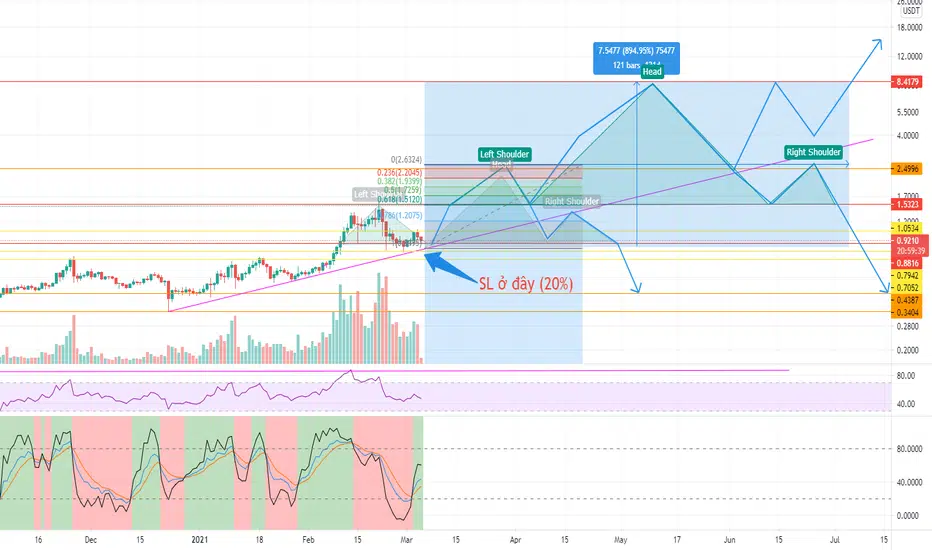
♨️ Important Hours for ONTUSDT : Will ONTUSDT Rise Up here?Personal Ideas :
if ONTUSDT rise up here, I think it will follow this pattern and will reach to 2$ channel.
how do you think about ONTUSDT? please write in the comments for me 🙏🏻