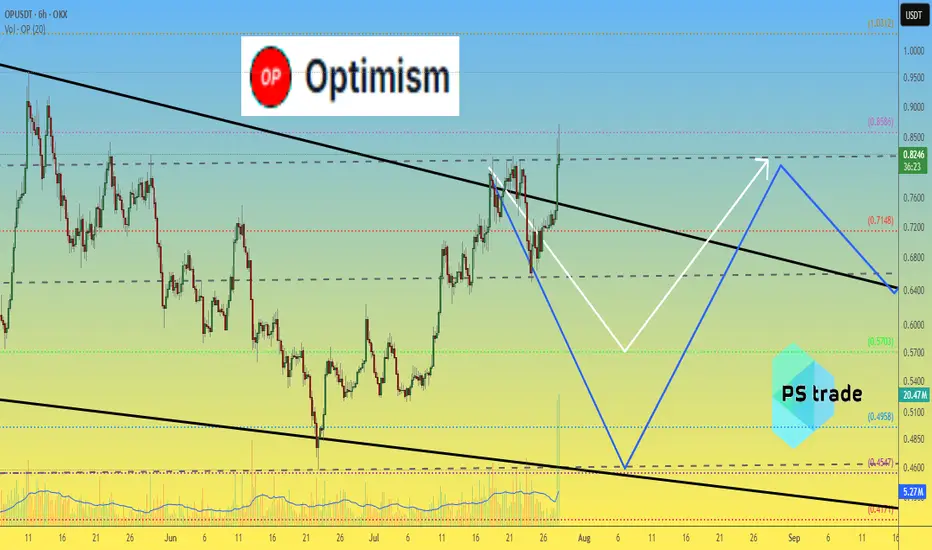
Optimism Op price analysis - be careful After the listing of #OP on the Korean exchange, known for its "pump events", we observe a surge in volume along with a breakout from the downtrend.
🐻 The current 6-hour candle on OKX:OPUSDT is attempting to form a pin bar — a potential reversal signal.
⚠️ High volumes often indicate the final phase of a move. Such pumps are usually short-lived — proceed with caution.
👌 Our previously published medium-term forecast for #Optimism remains relevant
________________
📚 Follow us ❤️ for daily crypto insights & updates!
🚀 Don’t miss out on important market moves!
Optimism
OP - Chance for +70%After weekly close we can see the volume coming in. On the chart we have resistance which if we break through then we can expect price 1.4 which is +70% from now.
If I have some advice for leverage trading I think its better to wait for daily close and then hunt retest if happens.
Rotations of money started already and I don't think is it a case for long run. We need to act, take profit and watch something else.
Like if you like analysis and idea.
Ivan

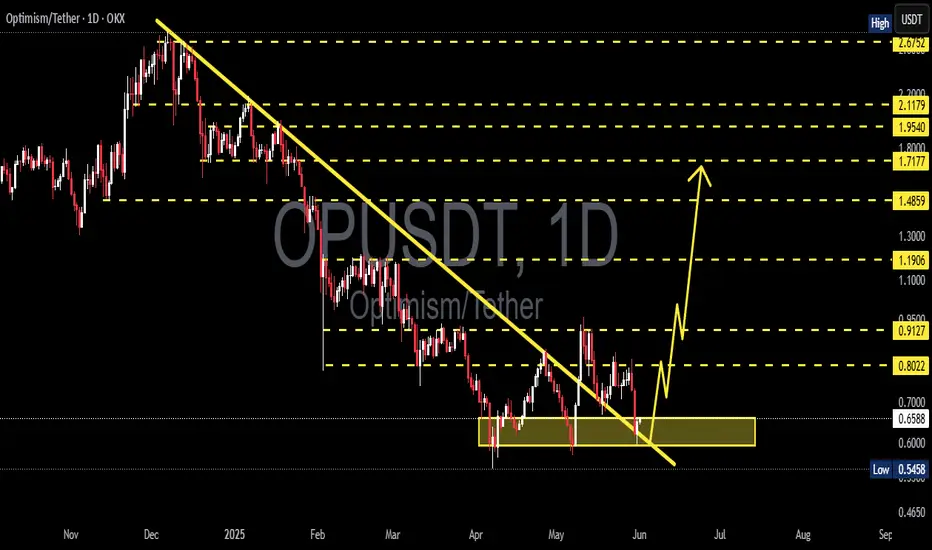
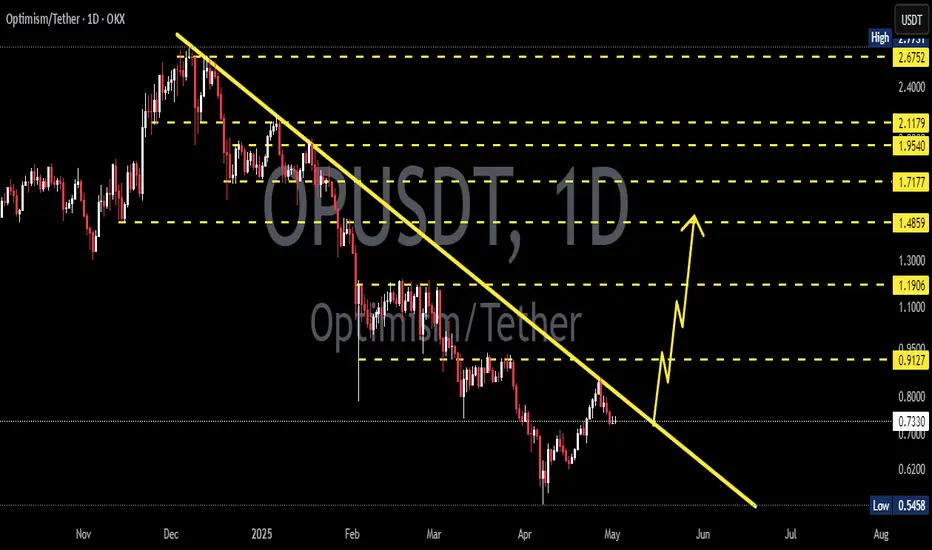
Optimism OP price analysisCurrently, the price of #OP does not look very optimistic (a little pun to start with )))
🟢 An optimistic forecast would be for the price of OKX:OPUSDT to rise to $1.40
🟡 But it looks like this growth will not happen now, but after a correction.
🔴 Correction: only to $0.57 or again to $0.45 — this is also an open question.
👌 Patience to holders and fans of the #Optimism project, the “microclimate” in the crypto market is improving — the time will come, and this coin will also be pumping...
_____________________
Did you like our analysis? Leave a comment, like, and follow to get more

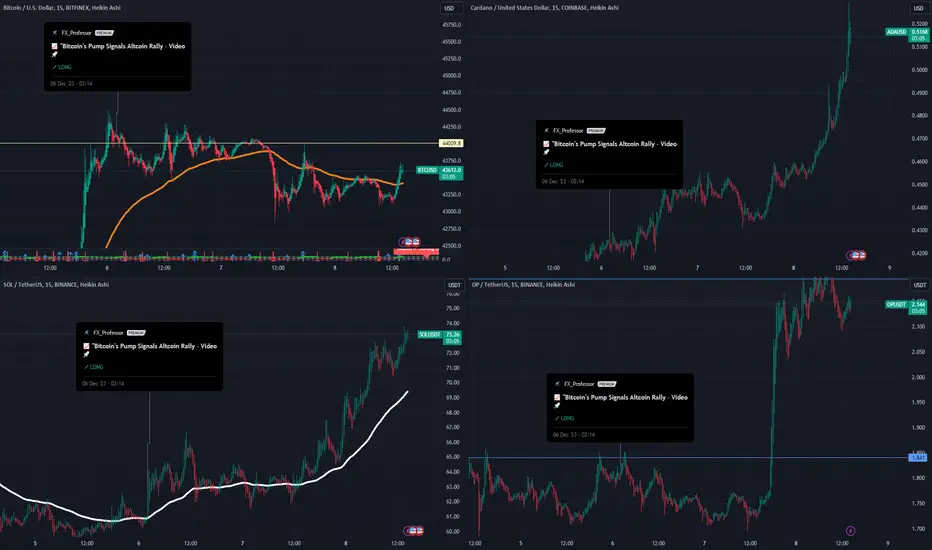
🐋 Deep Dive Part II: Whale Behavior & Market Mastery! 🌊📚Hey Crypto Enthusiasts! 🚀
In a recent analysis, I not only nailed Bitcoin's (BTC) movement but also illuminated the subsequent altcoin surge, driven by insightful whale behavior observations. Let's merge these insights with a focus on ADA (Cardano), OP (Optimism), SOL (Solana), and BTC. 📊
Cardano's (ADA) Meteoric Rise 🌟
ADA's journey began with a break above a pivotal support-resistance level. My entry point at 0.256 turned into a remarkable rally, hitting 52 cents. This movement was a classic case of altcoin buoyancy following Bitcoin's pause.
Optimism (OP) and the Altcoin Breakouts 🌈
In the shadow of Bitcoin's stagnation, altcoins like OP exhibited significant breakouts, showcasing the shifting focus of market whales from Bitcoin to promising altcoins.
Bitcoin (BTC) and Whale Dynamics 📉
Bitcoin's behavior provided a crystal ball into the whale activities. As BTC approached a major resistance level, it signaled a strategic move by whales to divert funds towards altcoins, catalyzing their surge.
Solana (SOL) and Market Trends ☀️
Solana's chart also mirrored this trend, highlighting the broader market dynamics influenced by these significant players.
🔍 Insight on Whale Behavior:
My analysis delved deep into the whale behavior, highlighting how Bitcoin's rally and subsequent pause was a precursor to altcoin dominance. This strategic pause in Bitcoin's ascent was a clear signal for the whales to redistribute their focus and capital, sparking a remarkable rise in altcoins like ADA, OP, and SOL. 🔄
The Bigger Picture - Understanding Market Shifts: What this trend teaches us is the importance of reading between the lines. Whale movements often precede major market shifts, and by understanding these patterns, we position ourselves to make informed decisions. 🧠
Future Outlook: As we continue to monitor these market dynamics, it's crucial to stay vigilant. The crypto market is known for its volatility, and while the current trend favors altcoins, it's essential to be prepared for any shifts that may arise. Always keep an eye on key resistance and support levels, market sentiment, and global economic factors that could influence the next big move. 🌐
Together, let's stay ahead of the curve in this fascinating and ever-evolving world of cryptocurrency. Your insights and engagement are what make this journey exciting and rewarding!
One Love,
The FXPROFESSOR 💙
part 1:
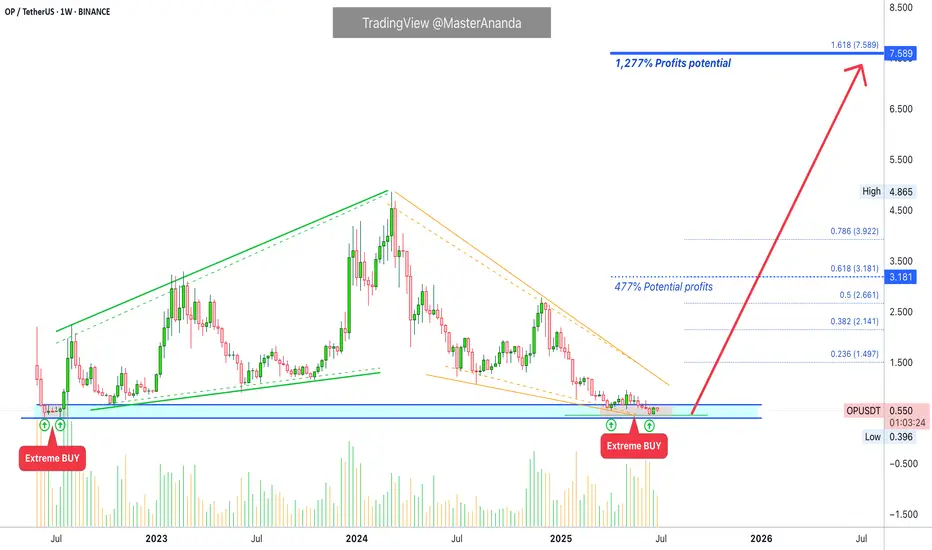
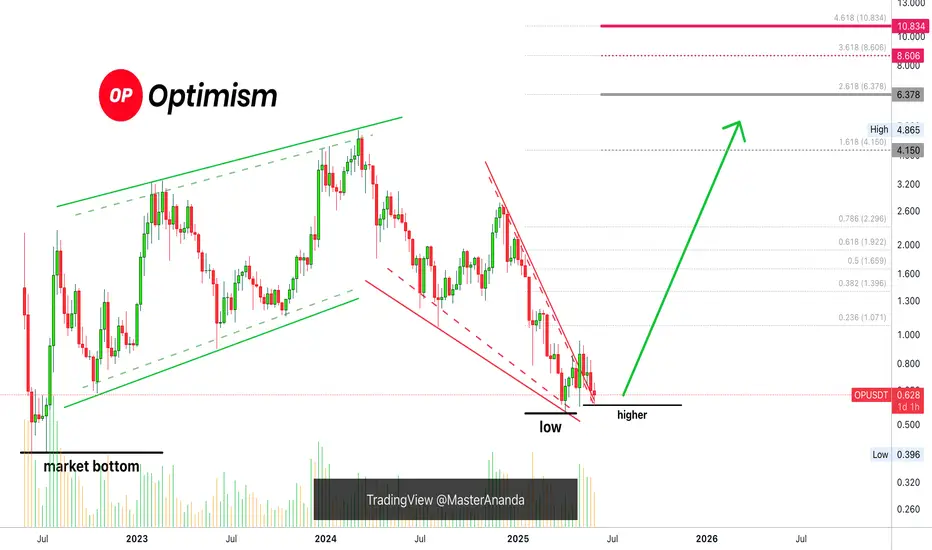
Optimism Extreme BUY: Easy 1277% Profits Potential—Can Go HigherOptimism is now moving within a "extreme BUY" zone. This is a price zone that was active only once between June and July 2022, one month only and then OPUSDT went on a massive rally. Total growth amounting to more than 1,111% from bottom to top.
This zone has been activated again for a little over one month and I believe it won't remain valid much longer. There is room for a new wave of growth but this time much more than 1,111%.
The target shown on the chart is a good one but I believe this trading pair/Cryptocurrency project can go higher when all is said and done.
Technical analysis —Bullish based on price action
On the 16-June week, 22-June specifically, Optimism (OPUSDT) hit its lowest price yet. 0.457. This is just a bit higher compared to the all-time low June 2022 at 0.396. We can easily say the bottom is in as this week the action is back above its 7-April 2025 low.
Higher targets
The next high target sits at $12, giving us a 2,078% potential for profits from current price. 0.551 at the time of writing.
Previous cycle vs current cycle
Optimism's first bullish cycle lasted 630 days. The next cycle, the one that is about to start now, can last an entire year, eight months... We are entering uncharted territory so it is hard to say.
One thing I can say based on TA is that this new wave will be much more steep compared to the last one. The climb will be really fast, it will be hard to adapt.
How to trade to maximize profits
The best way to approach this pair for sure success is by buying when prices are low, now. This would secure a smooth ride and happy profits on the way up.
If you are reading this now, your timing is awesome because we are looking at a bottom catch, this type of opportunity is only seen once every several years. For example, the last time OPUSDT traded this low was in mid-2022, three years ago. Once the bullish wave takes off, there is no going back. Once the bulls are in, low prices will be forever gone.
Thanks a lot for your continued support.
Namaste.
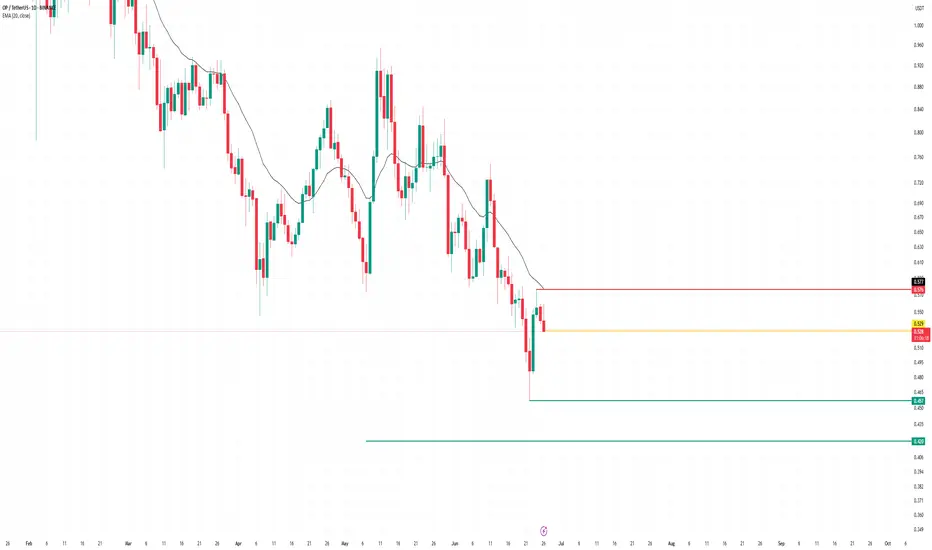
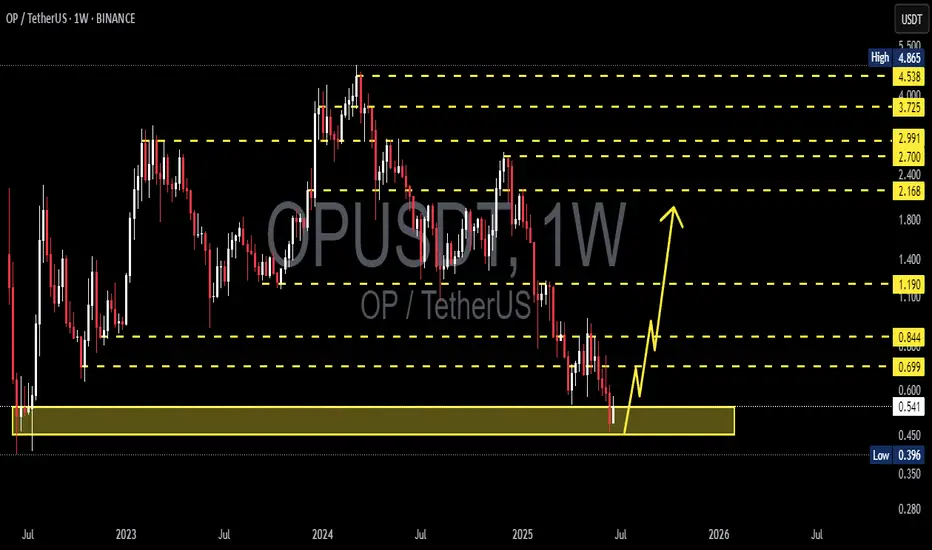
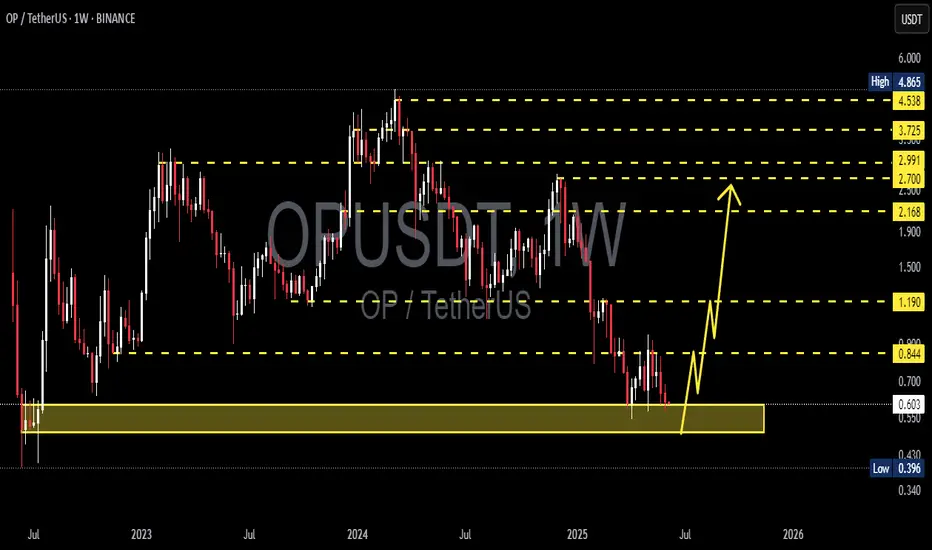
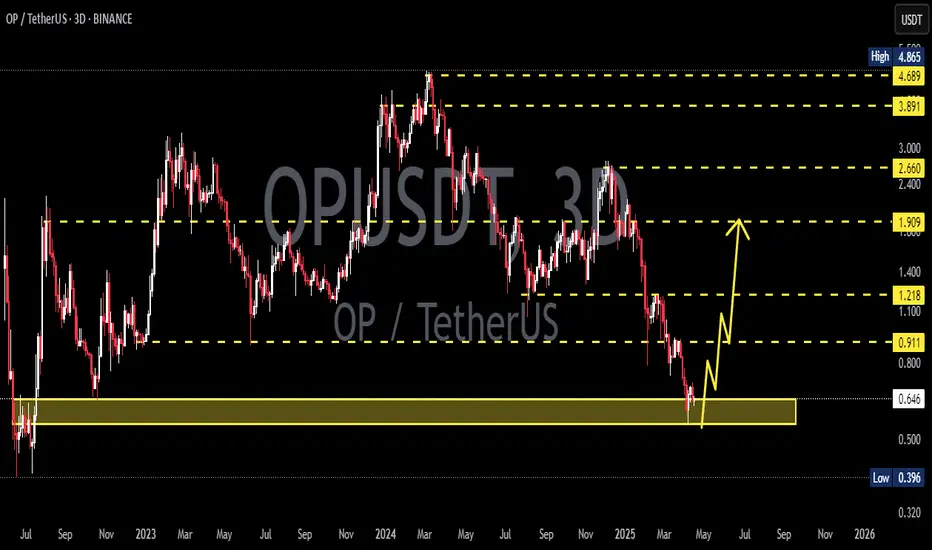
OP/USDT Weekly Reversal Zone: Strong Bounce ExpectedThe OP/USDT pair is currently showing strong signs of a potential trend reversal from a major long-term demand zone.
📊 Timeframe: 1W (Weekly)
🟨 Key Support Zone: 0.396 – 0.542 USDT
The price has revisited a historically strong support area that previously served as an accumulation zone since mid-2022. The recent bounce from this level reinforces the likelihood of a bullish reversal.
📈 Upside Targets (Resistance Levels):
1. Minor Resistances:
0.699
0.844
2. Mid-Term Target:
1.190 (key breakout confirmation level)
3. Long-Term Bullish Targets:
2.168
2.400
2.700
2.991
3.725
4.020
4.538
4.865 (Previous major high)
🛡️ Critical Demand Zone:
As long as price holds above the 0.396–0.542 range, bullish structure remains intact. A breakdown below this range could invalidate the setup.
🔄 Outlook:
The chart pattern suggests the formation of a higher low and a potential breakout in stages, supported by volume and positive sentiment. Watch the 0.699 and 0.844 levels for initial confirmation of buyer strength.
📌 Note:
This setup offers an attractive risk-reward ratio for mid to long-term traders watching for a trend reversal.
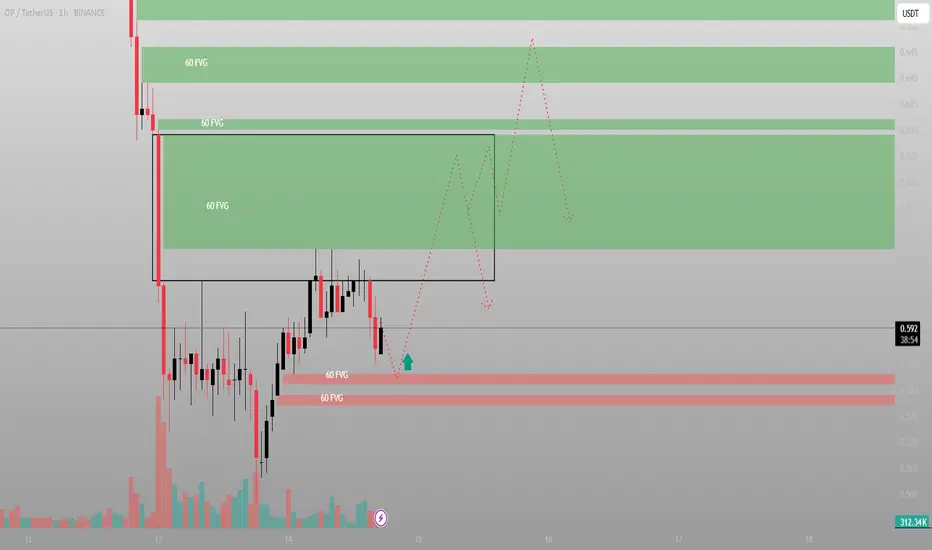
Everyone saw the drop. I saw the gapPrice nuked — but it didn’t break structure. It filled imbalance, paused, and now it's reloading beneath a stack of untouched FVGs. This isn't capitulation. It's orchestration.
The setup:
We’ve got layered 60-minute FVGs stacked from 0.61 to 0.66. That’s the destination — not the mystery. What matters is the origin. The rejection block around 0.58–0.59 has held clean, and we now have two bullish rejection wicks off that base.
Volume surged during the sweep — and fell on the retrace. That’s not distribution. That’s Smart Money filling.
Two entries — one outcome:
Entry 1: Tap into the red demand zone, wick the 0.58–0.579 region
Entry 2: Break and retest above minor FVG (0.60 reclaim confirmation)
Either way, the draw is the inefficiency stack above.
Execution Map:
Long from 0.579–0.583
SL: Below the base at 0.574
TP1: 0.615 (lower FVG)
TP2: 0.645 (full sweep)
Final: 0.660 liquidity run
Don’t fear the compression. That’s where the trap is set.
Final thought:
“Most traders fear price going sideways. I see it as silence before the algorithm speaks.”
#OP/USDT#OP
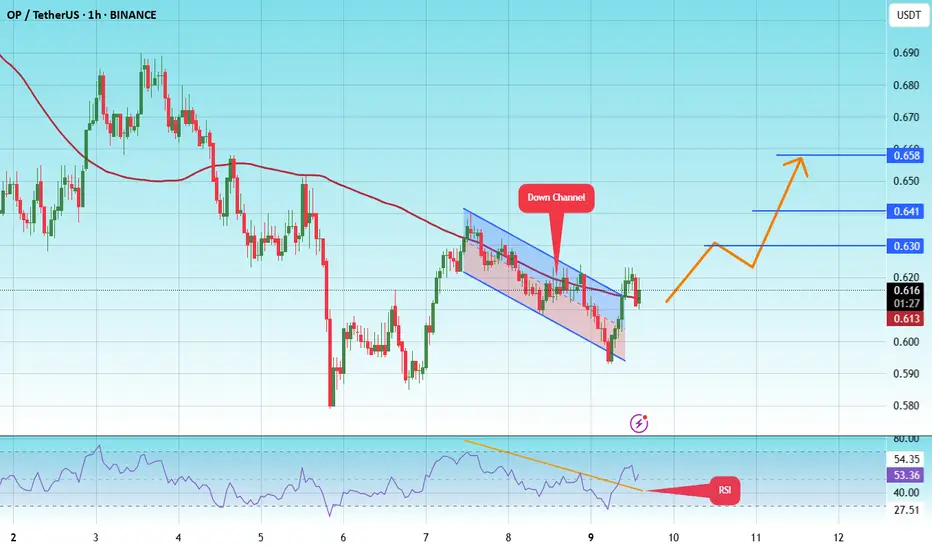
The price is moving within a descending channel on the 1-hour frame and is expected to break and continue upward.
We have a trend to stabilize above the 100 moving average once again.
We have a downtrend on the RSI indicator that supports the upward move with a breakout.
We have a support area at the lower limit of the channel at 0.600, acting as strong support from which the price can rebound.
Entry price: 0.616
First target: 0.630
Second target: 0.641
Third target: 0.658
OPUSDT 1W AnalysisOP ~ 1W Analysis
#OP Buy back gradually from here, this is the lowest support block for now with a short term target of at least 20%+ from here.
The 2025 Bull Market: Do Not Sell Unless You See A New All-Time How long have you been in this market? You are about to embark on a journey; you are about to experience/enjoy the most sought after phase of the cryptocurrency market, the bull market.
If you've been around for less than four years, you've seen nothing like it. It will blow your mind.
You can see the numbers on the charts, past action and there you have your proof, but nothing can prepare you for the actual experience. Even if you've experienced previous bull markets, the actual event is mind-blowing. We are dying for you to try it. We cannot wait anymore... We just want you to earn, make money, share, have fun and enjoy. We, the Cryptocurrency family, deeply love you and wish for you amazing results.
Don't be shy. Do not be afraid. Buy everything up like it is the end of the world. Once bought, hold. Do not sell. I repeat, do not sell until prices are high, really high up. For example, looking at Optimism, OPUSDT, wait for a new all-time high before taking profits.
Thanks a lot for your continued support.
Leave a comment if you enjoyed the article, it will only take ten seconds.
Namaste.
Don't miss today's signal.Hello friends
Based on the extensive and comprehensive analysis we conducted, we were able to obtain the buying points and targets for this currency for you so that you can buy in stages with risk and capital management.
*Trade safely with us*

OPUSDT 1D AnalysisOP ~ 1D Analysis
#OP Buy in stages from here with a short term target of at least 15%+ and a long term target of $2.7
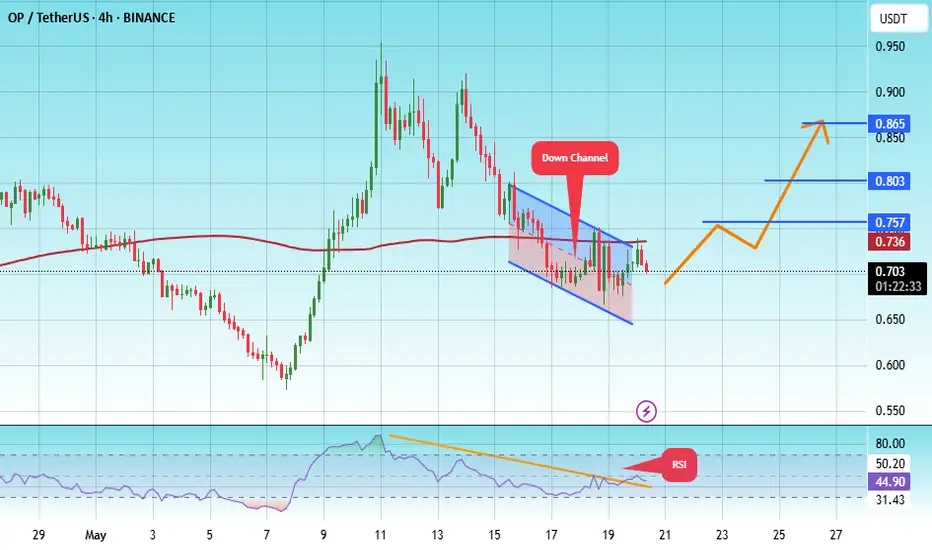
#OP/USDT#OP
The price is moving within a descending channel on the 1-hour frame, adhering well to it, and is heading for a strong breakout and retest.
We are seeing a bounce from the lower boundary of the descending channel, which is support at 0.653.
We have a downtrend on the RSI indicator that is about to be broken and retested, supporting the upward trend.
We are looking for stability above the 100 moving average.
Entry price: 0.702
First target: 0.757
Second target: 0.805
Third target: 0.865
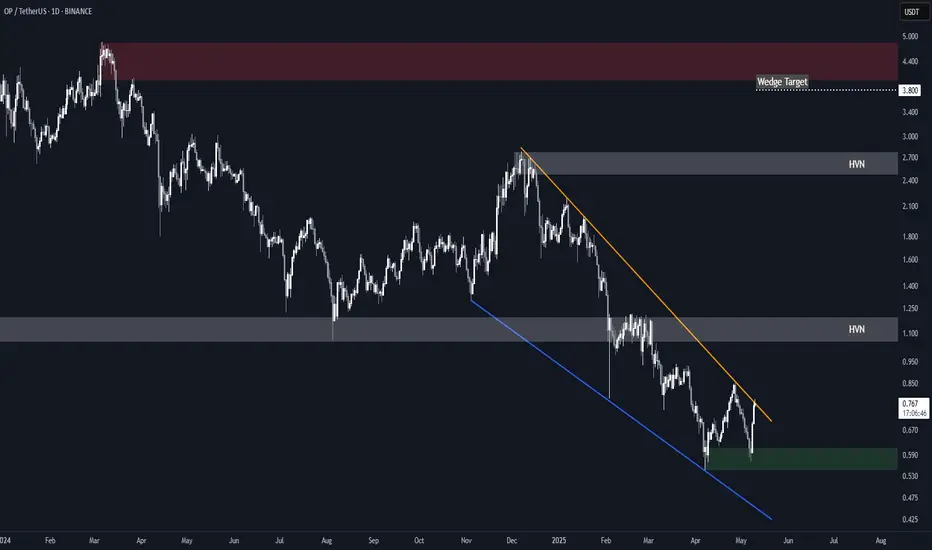
Optimism (OP) Falling WedgeBINANCE:OPUSDT is attempting a breakout from a 14 months long falling wedge.
A sustained break above the resistance in the near term would set the target at $3.80, just shy of the main $4.00-$4.80 supply zone.
Key Levels to Watch
• $0.55-$0.60: Main demand zone and invalidation point for the setup
• $1.00-$1.20: High Volume Node and key S/R dating back to June 2023.*
• $2.50-$2.80: High Volume Node and wedge high point.*
• $4.00-$4.80: Main supply zone.
* These could offer resistance and represent good levels for partial TPs.
OPUSDT 1D AnalysisOP ~ 1D Analysis
#OP Buy after successfully penetrating this resistant line with a short -term target of at least 15%+ from here.
Optimism Back Above Long-Term Support: Easy 480% PPI will base this entire analysis on a single signal, a break and recovery of support.
Optimism moved recently below its previous All-Time Low established October 2022. The break below this level only lasted a few days. A week closed below and immediately the next week a close happened above. This is a bullish signal. Support was tested and holds. It broke briefly but the fact that the action is back above it makes this situation a bullish one.
» As long as OPUSDT trades above 0.636, market conditions are strongly bullish.
This week we have a full green candle and the week closes today. This is a continuation of last week that closed at the top of the session, another bullish signal.
Some Altcoins are now producing three digits green in a single day, real projects. This type of action is only present in a bullish cycle. At the beginning of a bullish wave, in-between or at the top, never within a bearish cycle or bearish wave.
Bullish action is confirmed. Bullish reversal is confirmed. Higher prices will happen next.
» I have an easy target for you mapped on the chart for OPUSDT, 480%.
Thank you for reading.
There will be more... This target on the chart is only the start, we are set to experience growth long-term. You have not seen how the Altcoins market looks and feels when it grows for six months straight, it will be awesome, and then the bull run.
Namaste.

OPUSDT 3D AnalysisOP ~ 3D Analysis
#OP Buy gradually from here if you still have a Conviction on this coin with a short -term target of at least 15%+ from here.
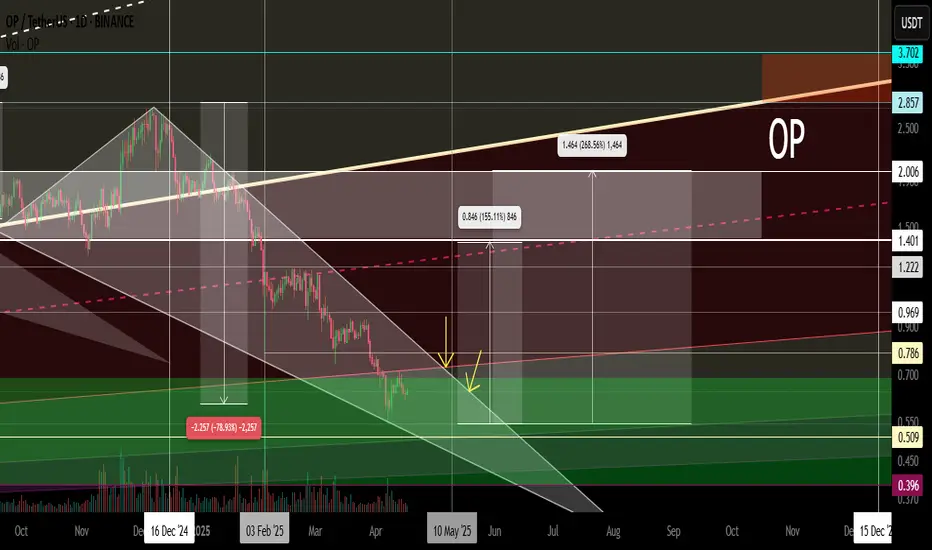
OP Secondary trend. Wedge. Reversal zones. 17 04 2025From the wedge breakout, the price reached the level of 2.857 (81%) and from it the trend reversal under the general trend of altcoins, breaking through the "neck" zone of the head and shoulders, thereby realizing this pattern on a large scale and reaching the reversal zone of the minimums of the level of 0.509. We went down to the range below along the fan. Consolidation above the dynamic support opens up the potential for movement to its resistance, I specifically put another meridian, as from it with a high degree of probability, even with the implementation of the bullish potential, there will be a significant pump / dump rollback. It just intersects with the previous consolidation of support, which in this case acts as resistance (those who previously bought in this zone will sell, thereby going into breakeven and stimulating the stop of the impulse and a rollback (logical probability).
Locally, again having formed on the fall, as before, a descending wedge in the secondary trend. It has not yet been fully formed, the price is not clamped. But, conditionally, the price is at the minimum zone. You can start gaining from the average price, or work on a breakthrough of the formation, observing risk and money management. If you are scared (it is always like this at the minimum zone) - then everyone is the same, and most refuse to buy, but willingly buy when the price is already expensive.
A breakthrough of this wedge is a corrective upward movement to the mirror resistance zone of the previous consolidation (highlighted in gray), if in general, a "revival of faith" is observed in alts.
Also after breakout of the wedge, if the market as a whole is bearish on alts, then they will make a cut (in this case, a repeated set) at the zone of minimums in a wide range of price slippage and the complete death of faith in the candy wrapper of "crypto whales", highlighted in green.
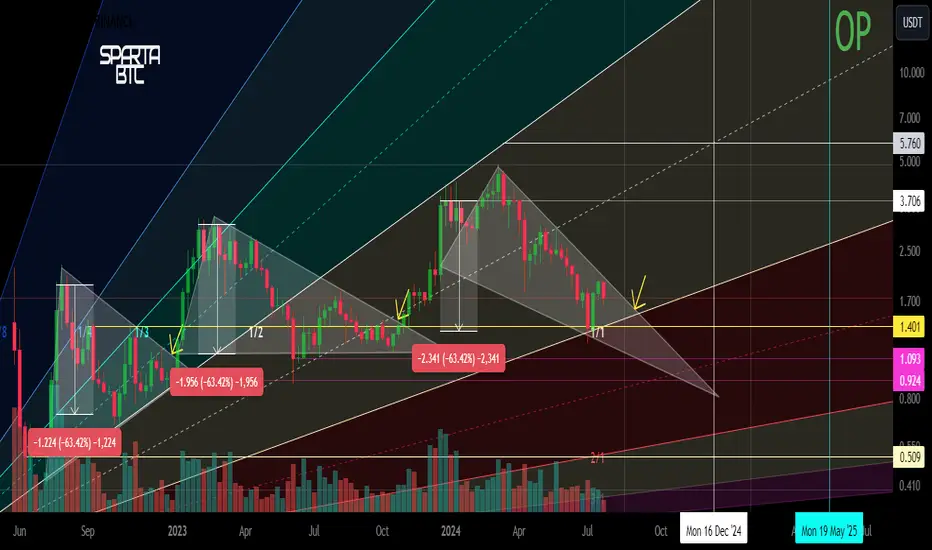
OP/USDT Major trend. 07 2024Logarithm. Time Frame 1 week. After the listing there were 3 cyclical pumping of the “participation” phase. PR, hype, connection of the majority in mass media. The reversal occurred with a typical breakout in the secondary trend of a triangle (first pumping) or a wedge (second pumping). Now the third wedge is forming, the price is near the dynamic Gann support (reaction from it), but still in the range of the descending wedge pattern.
On a line chart (liquidity, no slippage) the declines are cyclical at -63% each time according to the algorithm. Each successive top +55% of the previous secondary trend.
It is quite possible that something similar will happen again this time (not necessarily), but only ideally after holding dynamic fan support and breaking wedge resistance. I have purposely shown only medium-term targets after a trend break.
Gann's trend fan is plotted on the chart, i.e. dynamic support/resistance areas for the future.
Optimism customization - L2's blockchain scaling solution ETH Crypto funds have invested a total of $267 million.
Secondary trend Time frame 3 days
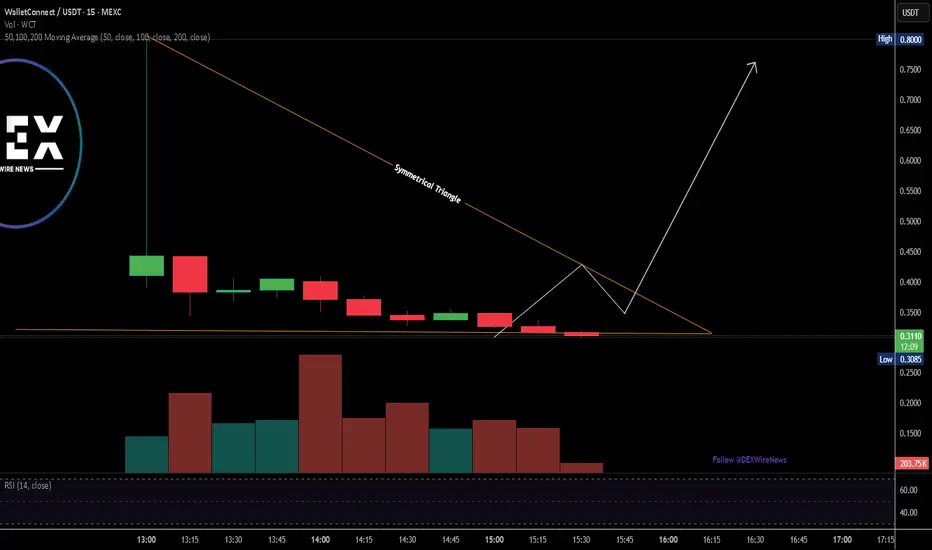
Breaking: The Wallet Connect Token $WCT Got Listed On ExchangesWallet Connect a platfrom known to be a mediator or connector to crypto wallets like metamask, Trustwallet, Phantom, etc., got listed on Binance, Bybit, OKX, and so many major exchanges today.
The asset saw an 80% uptick in price prior data from Binance feeds. while presently down to $0.32, the 15-minute price chart depicts a symmetrical triangle pattern and a breakout above the ceiling could cement the grounds for a $1 move.
While sitting on a market cap of $58.86M, NASDAQ:WCT is well feasible to bridged the the $1 resistant zone. For now, all eyes are set on the breakout of the symmetrical triangle pattern.
With the asset testing weak hands, NASDAQ:WCT could be on a cusp of a breakout.
What is WalletConnect and the WalletConnect Token ( NASDAQ:WCT )?
The WalletConnect Network is the onchain UX ecosystem powering 150 million connections for over 23 million users across 600 wallets, 40K app projects, and all chains. It is the open and decentralized network that enables users to connect to apps onchain, designed for both utility and ownership without compromises. The WalletConnect Token (WCT) is integral to the WalletConnect Network — fueling the onchain UX ecosystem by empowering its community of users, apps, and wallets to contribute to a better onchain future through shared incentives. Launching on Optimism’s OP Mainnet, the token will employ Ethereum’s security and OP Mainnet’s speed.
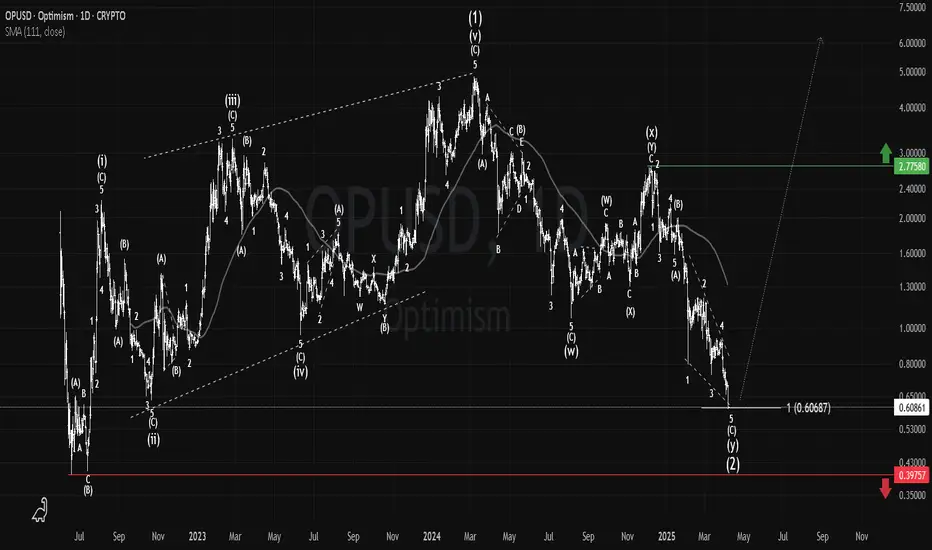
OP: Once in a Life-Time Chance?#Optimism may have completed its correction, showing a rare opportunity.
If the current low holds, it would mark the major bottom, completing a diagonal 1st wave followed by a WXY correction.
Passing $2.78 confirms targeting the ATH.
Breaking $0.39 invalidates the idea.
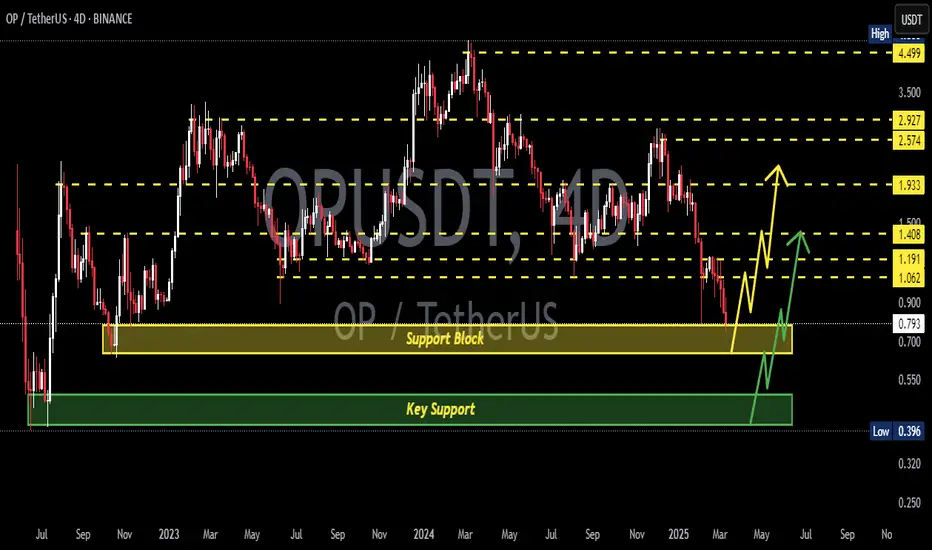
OPUSDT 4DOP ~ 4D Analysis
#OP Place two purchases at this support level, with a short -term target of at least 20%+.
This is a key support that needs attention.