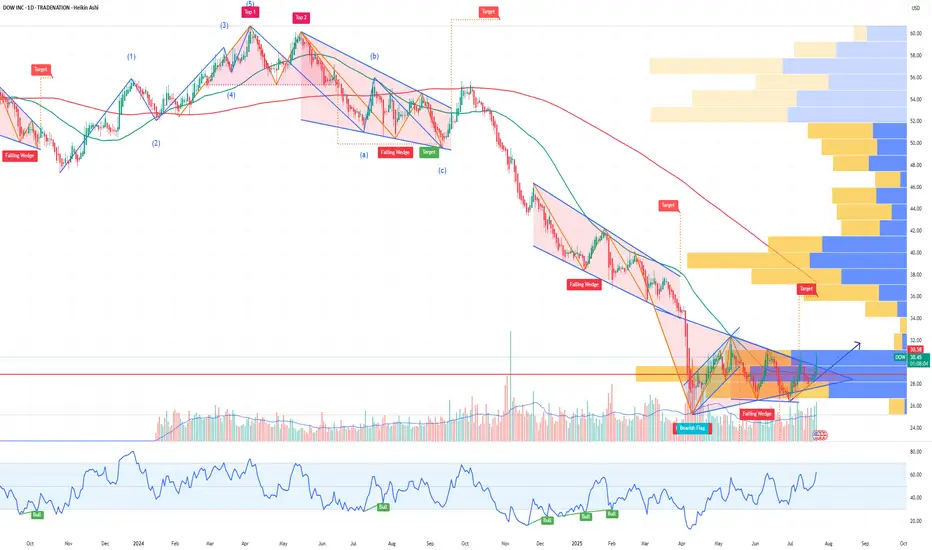
DOW Options Ahead of EarningsAnalyzing the options chain and the chart patterns of DOW prior to the earnings report this week,
I would consider purchasing the 30usd strike price Calls with
an expiration date of 2025-9-19,
for a premium of approximately $2.36.
If these options prove to be profitable prior to the earnings release, I would sell at least half of them.
Disclosure: I am part of Trade Nation's Influencer program and receive a monthly fee for using their TradingView charts in my analysis.
Optionsanalysis
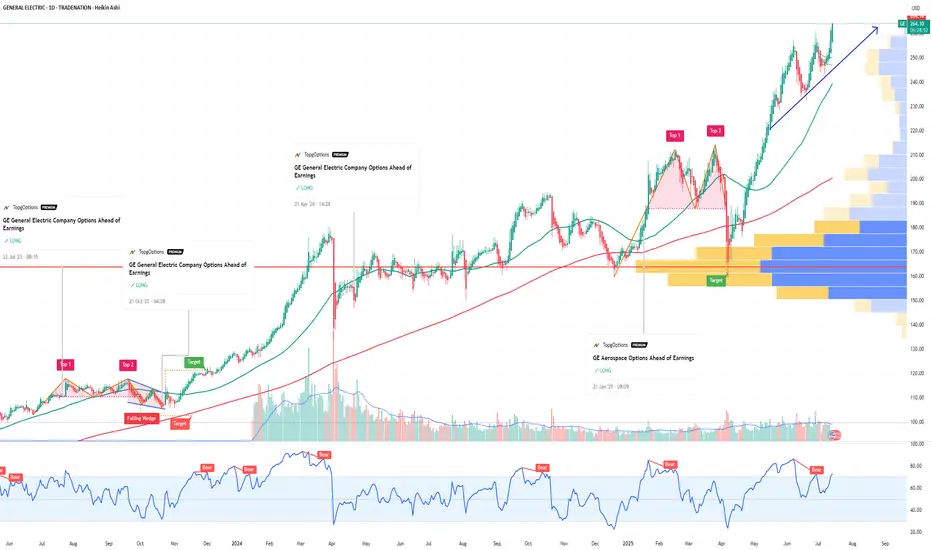
GE Aerospace Options Ahead of EarningsIf you haven`t bought GE before the rally:
Now analyzing the options chain and the chart patterns of GE Aerospace prior to the earnings report this week,
I would consider purchasing the 270usd strike price Calls with
an expiration date of 2025-8-15,
for a premium of approximately $8.60.
If these options prove to be profitable prior to the earnings release, I would sell at least half of them.
Disclosure: I am part of Trade Nation's Influencer program and receive a monthly fee for using their TradingView charts in my analysis.
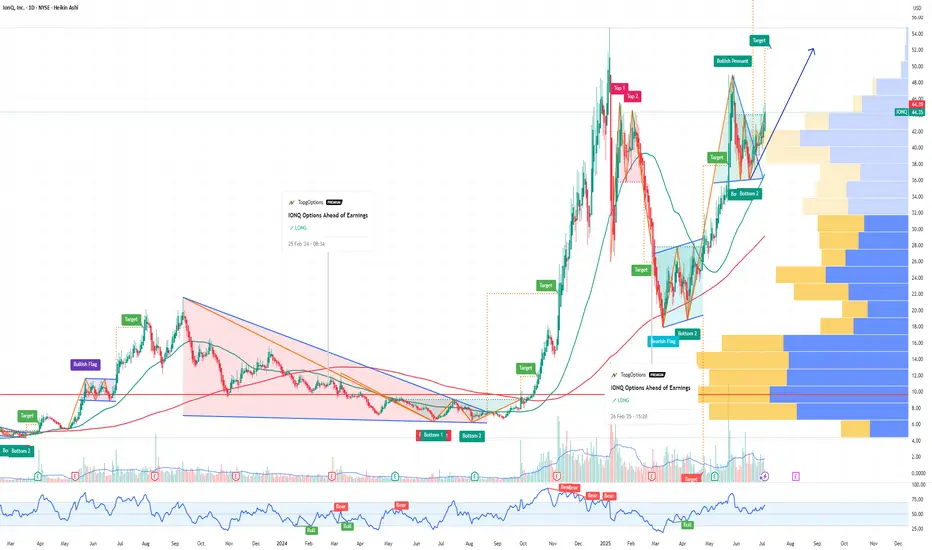
Why IonQ (IONQ) Could Be the NVDA of Quantum ComputingIf you haven`t bought IONQ before the rally:
Now you need to know that IonQ isn’t just another speculative quantum stock — The company is building a robust ecosystem around its best‑in‑class trapped‑ion architecture and targeting fault‑tolerant, networked quantum systems. With record bookings, major acquisitions, and a strong balance sheet, IonQ could emerge as the NVIDIA equivalent for quantum infrastructure.
Key Bullish Arguments
1) Superior Quantum Tech – Trapped‑Ion Advantage
IonQ’s trapped-ion processors boast 99.9% two-qubit fidelity, demonstrating higher accuracy and scalability than superconducting alternatives
These systems also operate at room temperature, meaning simpler deployment and lower costs
2) Ecosystem Strategy & Acquisitions
The $1.08B acquisition of Oxford Ionics (expected close in 2025) expands IonQ’s qubit control tech, pushing toward planned 80,000 logical‑qubit systems by decade’s end
Combined with ID Quantique and Lightsynq, IonQ is building a full-stack quantum and networking offering
3) Strong Revenue Growth & Cash Runway
Revenue soared from $22M in 2023 to $43.1M in 2024, with bookings of $95.6M
. Q1 2025 saw $7.6M revenue and EPS –$0.14, beating expectations; cash reserves near $697M provide years of runway
4) Real Commercial Deployments
IonQ sold its Forte Enterprise quantum system to EPB ($22M deal) for hybrid compute and networking, marking real-world commercial applications
5) AI & Quantum Synergy
Involvement in NVIDIA’s Quantum Day and hybrid quantum‑classical AI demos (e.g., blood pump simulation with Ansys, ~12 % faster) indicates strategic synergy and positions IonQ as a critical piece in the future AI stack
Recent Catalysts:
Texas Quantum Initiative passes – positions IonQ at forefront of U.S. state-backed innovation
Oxford Ionics acquisition pending – major expansion in qubit scale & tech
Barron’s analyst buys – industry analysts see long-term potential; IonQ among top quantum picks
Broader quantum optimism – McKinsey & Morgan Stanley forecasts highlight synergy between quantum and AI, benefiting IonQ
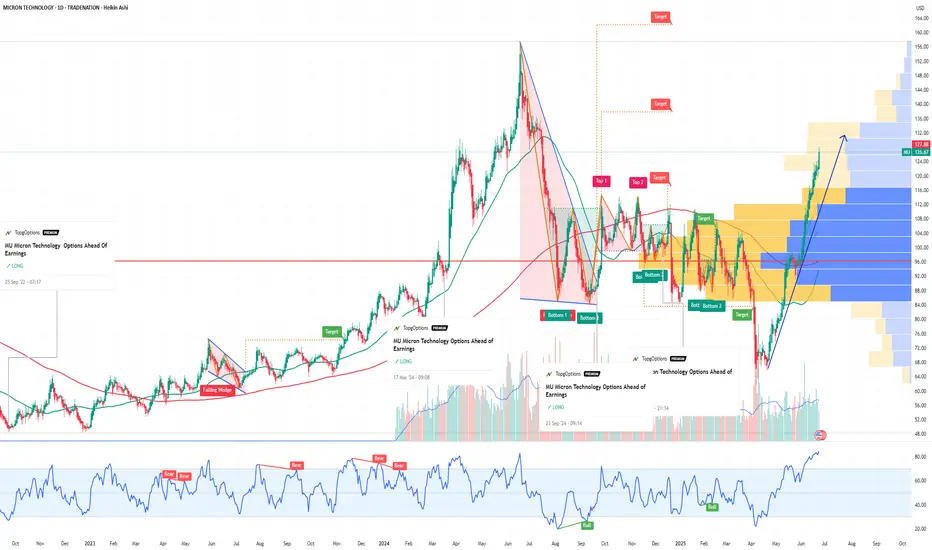
MU Micron Technology Options Ahead of EarningsIf you haven`t bought MU before the rally:
Now analyzing the options chain and the chart patterns of MU Micron Technology prior to the earnings report this week,
I would consider purchasing the 128usd strike price Calls with
an expiration date of 2025-6-27,
for a premium of approximately $5.52.
If these options prove to be profitable prior to the earnings release, I would sell at least half of them.
Disclosure: I am part of Trade Nation's Influencer program and receive a monthly fee for using their TradingView charts in my analysis.
AAOI Applied Optoelectronics potential rally by EOYApplied Optoelectronics AAOI is well-positioned for a strong rally toward $24 per share by the end of 2025, supported by multiple operational and strategic catalysts. A key recent development—the warrant agreement with Amazon—adds a powerful endorsement and financial backing that enhances the bullish case.
1. Amazon’s Strategic Warrant Agreement: A Major Vote of Confidence
On March 13, 2025, AAOI issued a warrant to Amazon.com NV Investment Holdings LLC, granting Amazon the right to purchase up to approximately 7.95 million shares at an exercise price of $23.70 per share.
About 1.3 million shares vested immediately, with the remainder vesting based on Amazon’s discretionary purchases, potentially up to $4 billion in total purchases over time.
This agreement signals Amazon’s strong confidence in AAOI’s technology and its critical role as a supplier of high-speed optical transceivers for Amazon Web Services and AI data center infrastructure.
The warrant price near $24 effectively sets a floor and a valuation benchmark, supporting the thesis that AAOI’s stock could reach or exceed this level by year-end.
2. Major Data Center Wins and Hyperscale Customer Re-Engagement
AAOI recently resumed shipments to a major hyperscale customer, with volume shipments of high-speed data center transceivers expected to ramp significantly in the second half of 2025.
This re-engagement with a key customer aligns with the surging demand for AI-driven data center infrastructure, providing a strong revenue growth catalyst.
3. Robust Revenue Growth and Margin Expansion
Q1 2025 revenue doubled year-over-year to nearly $100 million, with gross margins expanding to over 30%, reflecting operational efficiencies and favorable product mix.
The company expects to sustain strong quarterly revenue ($100–$110 million) and ramp production capacity to over 100,000 units of 800G transceivers per month by year-end, with 40% manufactured in the U.S.
4. Manufacturing Expansion and Supply Chain Resilience
AAOI is scaling manufacturing in the U.S. and Taiwan, enhancing supply chain robustness and positioning itself to benefit from potential government incentives for domestic production.
Its automated, largely in-house manufacturing capabilities provide a competitive edge in meeting hyperscale and AI data center demand.
In conclusion:
Amazon’s warrant agreement at a $23.70 strike price not only provides a direct valuation anchor near $24 but also serves as a powerful strategic endorsement of AAOI’s technology and growth prospects. Combined with robust revenue growth, expanding manufacturing capacity, and key customer re-engagement, AAOI has a compelling case to reach or exceed $24 per share by the end of 2025.

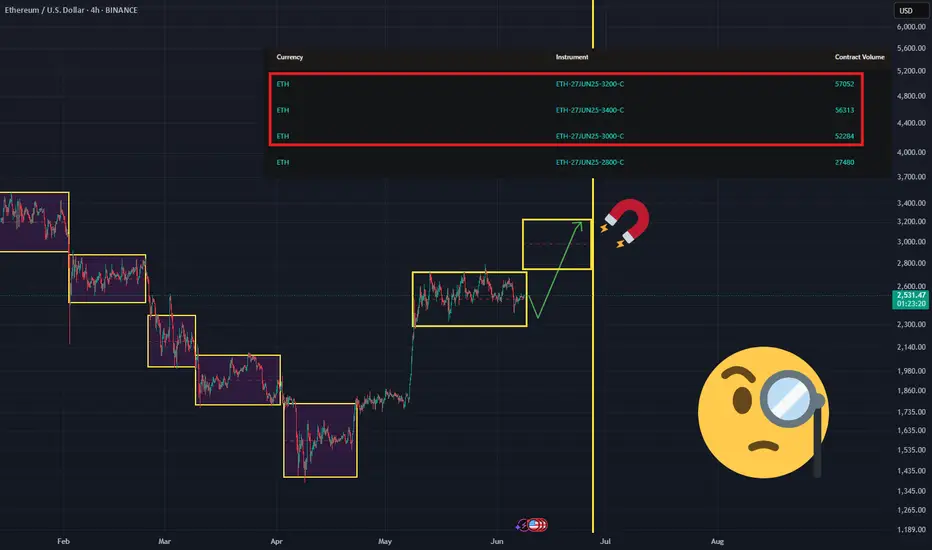
Once It Starts, It Might Be Too Late to Jump InHey guys, vacation’s over — time to get back behind the screen and into the reports. Naturally, I kicked things off with a deep dive into ETH options activity , because that’s where the real market whispers come from.
Here’s what stood out:
Over the past week, the biggest trading volume and open interest inflow came at strikes $3000–$3200–$3400 (see screenshot). Most of the action was in standalone calls , though a portion showed up as call spreads — meaning some players are betting on a controlled rally, not just blind bullishness.
The June 27, 2025 expiry remains the clear leader in open interest — still the date everyone’s watching.
With implied volatility at 67.9% , ETH has about a 68% probability (1σ) of reaching $2,950 by expiry — just 18 days away .
Key Takeaways:
$3000–$3200 looks totally within reach.
$3400 , though? Less than 15% chance based on current levels.
The sentiment among options traders is clearly bullish — they’re positioning for a breakout up from the sideways range, roughly by the full width of the pattern.
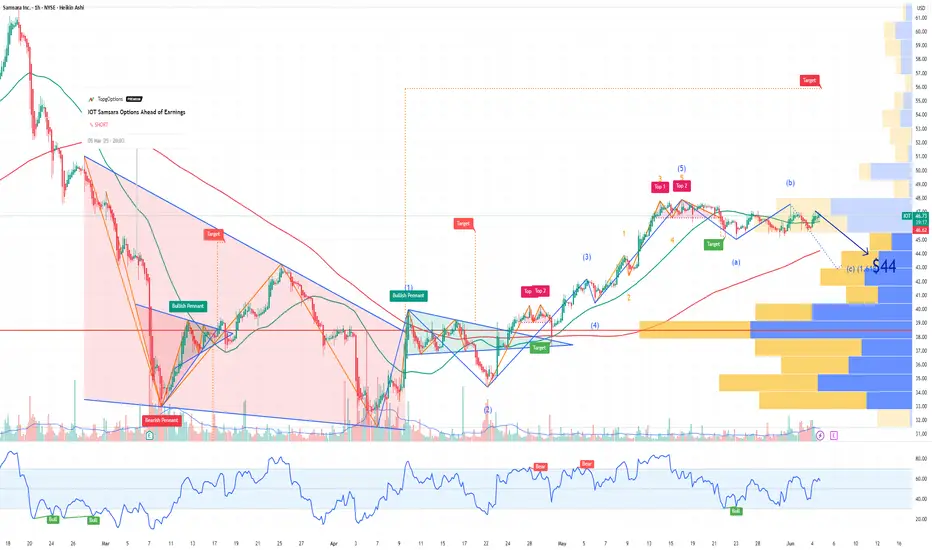
IOT Samsara Options Ahead of EarningsIf you haven`t sold IOT before the previous earnings:
Now analyzing the options chain and the chart patterns of IOT Samsara prior to the earnings report this week,
I would consider purchasing the 44usd strike price Puts with
an expiration date of 2025-6-6,
for a premium of approximately $1.90.
If these options prove to be profitable prior to the earnings release, I would sell at least half of them.
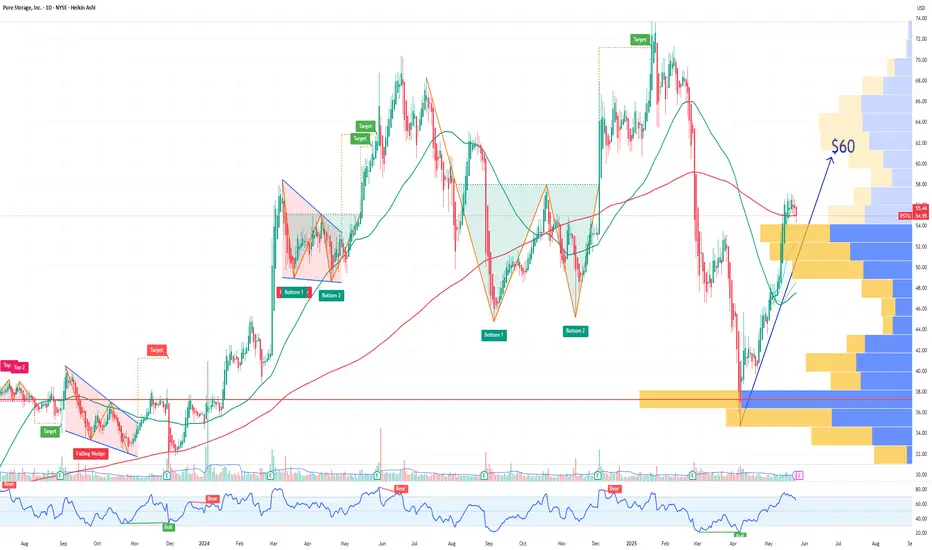
PSTG Pure Storage Options Ahead of EarningsAnalyzing the options chain and the chart patterns of PSTG Pure Storage prior to the earnings report this week,
I would consider purchasing the 60usd strike price Calls with
an expiration date of 2025-6-20,
for a premium of approximately $2.55.
If these options prove to be profitable prior to the earnings release, I would sell at least half of them.
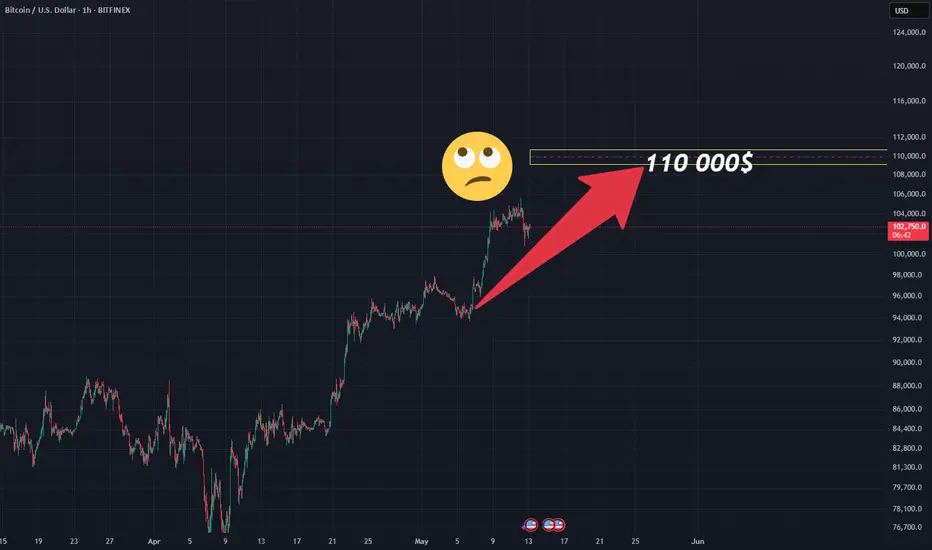
CME & Deribit Insights:Smart Money Takes Profits Ahead of ExpiryCME session update.
115 000$ partially closed just closed right before the price drop — someone had a piece of their options portfolio at 115,000 strike level already squared away. Safe to say it was an experienced player who got out near the top 💡
The good news: "he" still have about 2/3 of the portfolio open at that 115K strike.
The bad news: nothing’s happened yet …
But here’s what Deribit is showing us......
👀 Observation : In the May 30 options series, the highest trading volume is concentrated between 110,000–120,000 strike levels — which makes sense given the current underlying price.
But here’s the twist: this isn’t so much new positioning as it is existing players selling off . Yep — those moves were definitely noticed. Some traders are locking in profits, even though we’re still 17 days out from expiry .
Overall, classic playbook:
Smart money lightens the load , while the not-so-smart money tries to pick up the pieces.
(Though let’s be honest — there’s way less "dumb money" in options than in spot markets 😉)
💡 Sentiment remains Bullish, but correction is prevailing at the moment!
🎯 No Valuable Data, No Edge!
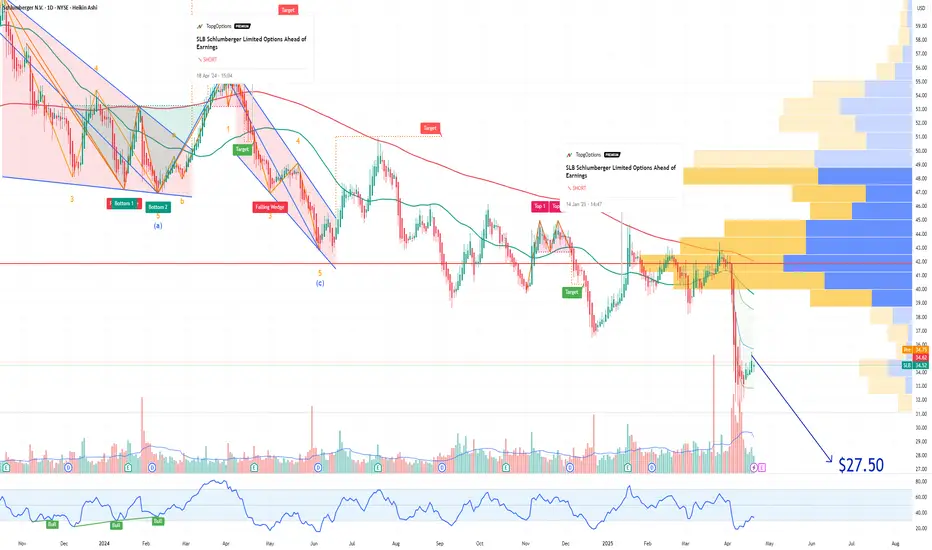
SLB Schlumberger Limited Options Ahead of EarningsIf you haven`t sold SLB before the previous earnings:
Now analyzing the options chain and the chart patterns of SLB Schlumberger Limited prior to the earnings report this week,
I would consider purchasing the 27.50usd strike price Puts with
an expiration date of 2026-3-20,
for a premium of approximately $2.01.
If these options prove to be profitable prior to the earnings release, I would sell at least half of them.
Trading Smarter, Not Harder: Decoding Institutional MovesThere’s an old saying in trading: “Follow the smart money.” But how do you know where the smart money is going? The answer lies not in guesswork but in data—specifically, the kind of institutional-grade data that most retail traders overlook. If you’re serious about understanding market dynamics, it’s time to dive into the world of **COT (Commitment of Traders) reports** and **options flow data** from the **CME (Chicago Mercantile Exchange)**. These tools are like your personal radar, cutting through the noise to reveal what the big players are doing.
Step 1: Understanding the Big Picture – Why Market Sentiment Matters
Before we zoom into the specifics, let’s start with the basics. Markets are driven by sentiment—the collective mood of participants. When fear dominates, prices fall; when greed takes over, they rise. But here’s the catch: Retail traders often react to sentiment after it’s already priced in. By the time you see a headline screaming “Market Crashes!” or “Record Highs!”, the opportunity has likely passed.
This is where systematic analysis comes in. Instead of relying on emotions or lagging indicators, smart traders use raw data to anticipate shifts in sentiment. And two of the most powerful sources of this data are **COT reports** and **CME options flow**.
Step 2: The Commitment of Traders (COT) Report – Peering Into the Mind of Institutions
The **COT report**, published weekly by the Commodity Futures Trading Commission (CFTC), provides a breakdown of positions held by different types of traders: commercial hedgers, non-commercial speculators (like hedge funds), and small retail traders. Here’s why it’s invaluable:
- **Commercial Hedgers**: These are the “smart money” players—producers and consumers who use futures markets to hedge their risk. For example, a sugar producer might sell futures contracts to lock in prices. Their actions often signal future supply and demand trends.
- **Non-Commercial Speculators**: These are the momentum-driven players who bet on price movements. Tracking their positioning helps identify potential reversals.
- **Small Traders**: Often considered the “dumb money,” their positions frequently coincide with market tops or bottoms.
By systematically analyzing the COT report, you will discover your ability to identify patterns and positioning levels of participants that signal trend reversals or the onset of corrections. Seriously, this will blow your mind! The insights you gain will be so groundbreaking that they will change your trading game forever.
Step 3: Options Flow – Real-Time Insights Into Institutional Activity
While the COT report offers a macro view, **options flow** gives you real-time insights into institutional activity. Directly through CME data feeds, you can track large block trades in options markets. Here’s why this matters:
It will take some time, observation, and comparison with price charts to learn how to uncover insights that lead to trades with a risk-reward ratio of 1:10 or even higher. This isn’t about needing to make options trades; that’s not a requirement. It’s about being able to trade the Forex market much more effectively by using entry points highlighted by options and futures market reports.
For example, over the past few weeks, the USD/JPY pair has been in a downtrend. Long before this happened, major players were accumulating positions in call options on the futures for the yen (which is equivalent to a decline in the yen). We discussed this before the drop occurred (you can easily find those analyses on our page ).
What’s remarkable is that there are many such insights available. For certain instruments (like precious metals and currency pairs), these insights appear with a certain regularity and provide excellent sentiment for opening positions or reversing positions in the opposite direction.
Step 4: Connecting the Dots – From General Trends to Specific Trades
Now that we’ve covered the tools, let’s talk about how to apply them systematically. Imagine you’re analyzing the sugar futures market (a favorite among commodity traders):
1. **Check the COT Report**: In the precious metals market, commercials are often positioned short, hedging against the risk of a decline in the underlying asset's value. When their net position hovers around zero , it typically signals a bullish trend for gold prices in the vast majority of cases.
2. **Analyze Options Flow**: when filtering options by sentiment, there are several key factors to consider:
- Size and value of the option portfolio
- Distance from the central strike (Delta)
- Time to expiration
- Appearance on the rise/fall of the underlying asset
Option portfolios with names such as vertical spread, butterfly, and condor (iVERTICAL SPREAD, IRON FLY/FLY, CONDOR/IRON CONDOR) have predictive sentiment regarding the direction of the asset's price movement. While "naked" options (PUT or CALL options) with above-average volume can signal that the price is encountering a significant obstacle at that level, leading to a potential bounce off that level (support or resistance).
3 **Combine with Retail Positions Analysis**: Look for opportunities to trade against the crowd. If retail sentiment is overwhelmingly bullish, consider a bearish position, and vice versa.
This layered approach ensures you’re not just reacting to headlines but making informed decisions based on valuable data.
Step 5: Why Systematic Analysis Sets You Apart
Here’s the truth: Most traders fail because they rely on intuition rather than evidence. They chase tips, follow social media hype, or get swayed by emotional biases. But markets reward discipline and preparation. By mastering tools like COT reports and options flow, you gain a competitive edge—a deeper understanding market breath! The path of least resistance!
Remember, even seasoned professionals don’t predict every move correctly.However, having a reliable structure allows you to maximize profits from transactions, eliminate noise and unnecessary (questionable) transactions.
Final Thoughts: Your Path to Mastery
If there’s one takeaway from this article, let it be this: The best traders aren’t fortune-tellers; they’re detectives. They piece together clues from multiple sources to form a coherent picture of the market. Start with the big picture (COT reports), zoom into real-time activity (options flow), and then refine your strategy with technical analysis.
So next time you open chart, don’t just look at price. Dive into the reports/data before. Ask questions. Connect the dots. Because in the world of trading, knowledge truly is power.
What’s your experience with COT reports or options flow? Share your thoughts in the comments below—I’d love to hear how you incorporate these tools into your trading routine!
**P.S.** If you found this article helpful, consider bookmarking it for future reference.

How "Max Pain" Can Become Your Ally in ETH TradingImagine standing on the edge of a cliff, peering down at a raging river below. That’s the feeling traders experience as the options expiration date approaches. At this moment, all bets are off, and the market is primed for sharp movements. Have you ever wondered how to turn this uncertainty into an advantage?
Let’s break it down. The ETH market is buzzing with tension: open interest in options is soaring, and the ratio of in-the-money to out-of-the-money puts stands at 48% to 52%. This means nearly half of all puts have intrinsic value. Professional market participants, like skilled magicians, hedge their positions, transforming them into delta-neutral setups.
But how do they do this? Right, by buying futures! This is the hidden growth driver we’ve been witnessing over the past few days. While I won’t dive into other factors like news, it’s crucial to understand that this dynamic could be the key to success.
Now, let’s talk about “Max Pain.” The Max Pain level for this options series landed on the March 2nd trigger point, where we saw a powerful bullish candle. But are the bulls stuck there? I’m pretty sure they are. Now, we’re left to watch whether the market can break free from this grip.
Personally, I see an opportunity to open a short position. But let’s see if the “law of gravity” will hold true for Max Pain this time.
Stay tuned If you want to stay updated on forex and crypto trading nuances!

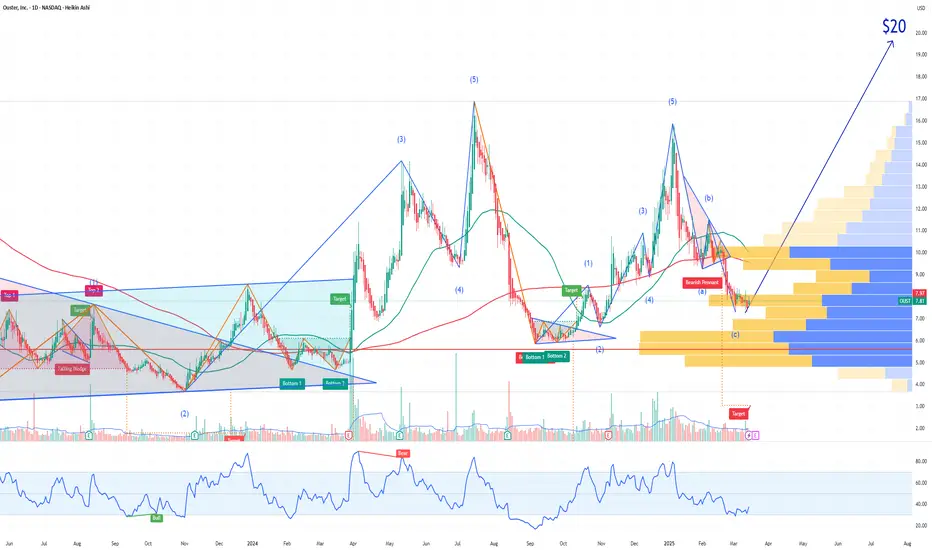
OUST Ouster Options Ahead of EarningsAnalyzing the options chain and the chart patterns of OUST Ouster prior to the earnings report this week,
I would consider purchasing the 20usd strike price Calls with
an expiration date of 2026-1-16,
for a premium of approximately $0.75.
If these options prove to be profitable prior to the earnings release, I would sell at least half of them.
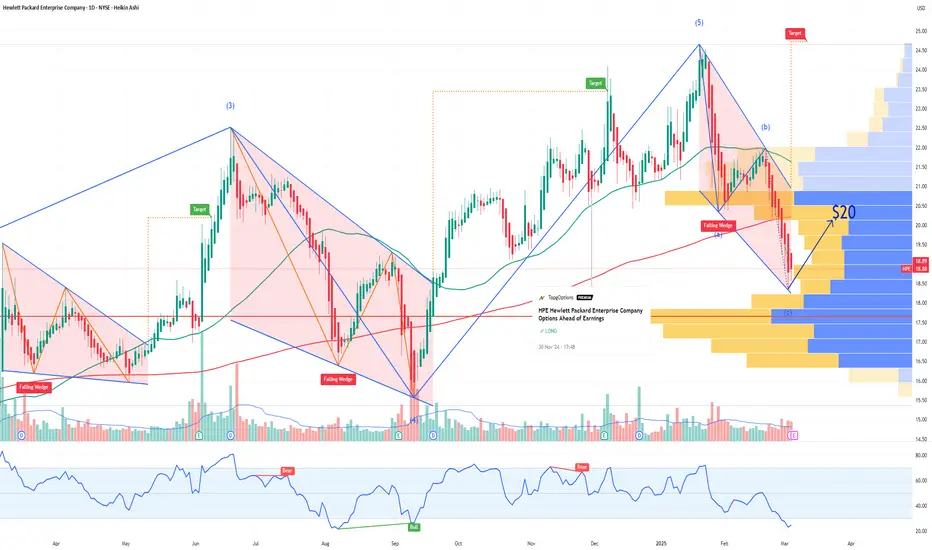
HPE Hewlett Packard Enterprise Company Options Ahead of EarningsIf you haven`t bought HPE before the previous earnings:
Noe analyzing the options chain and the chart patterns of HPE Hewlett Packard Enterprise Company prior to the earnings report this week,
I would consider purchasing the 20usd strike price Calls with
an expiration date of 2025-3-21,
for a premium of approximately $0.52.
If these options prove to be profitable prior to the earnings release, I would sell at least half of them.
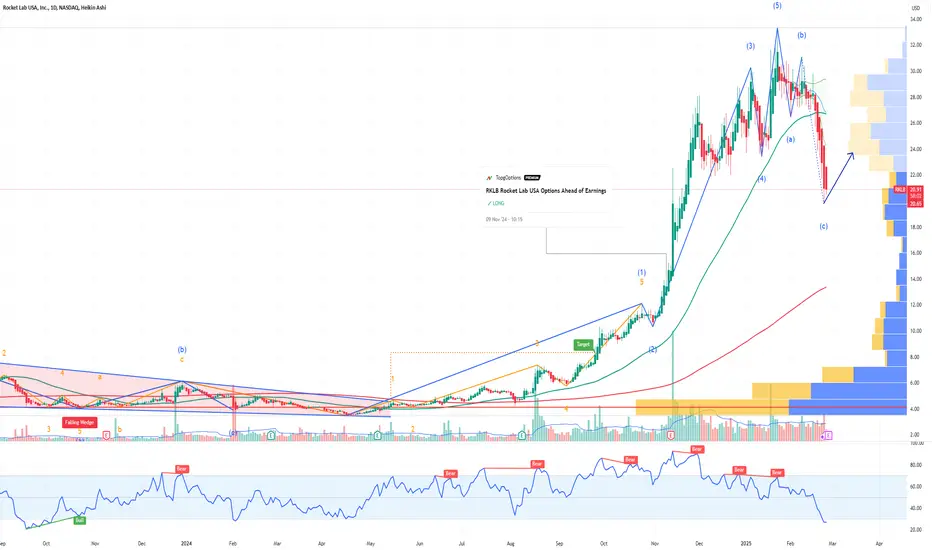
RKLB Rocket Lab USA Options Ahead of EarningsIf you haven`t bought RKLB before the previous earnings:
Now analyzing the options chain and the chart patterns of RKLB Rocket Lab USA prior to the earnings report this week,
I would consider purchasing the 21.5usd strike price Calls with
an expiration date of 2025-3-7,
for a premium of approximately $1.62.
If these options prove to be profitable prior to the earnings release, I would sell at least half of them.
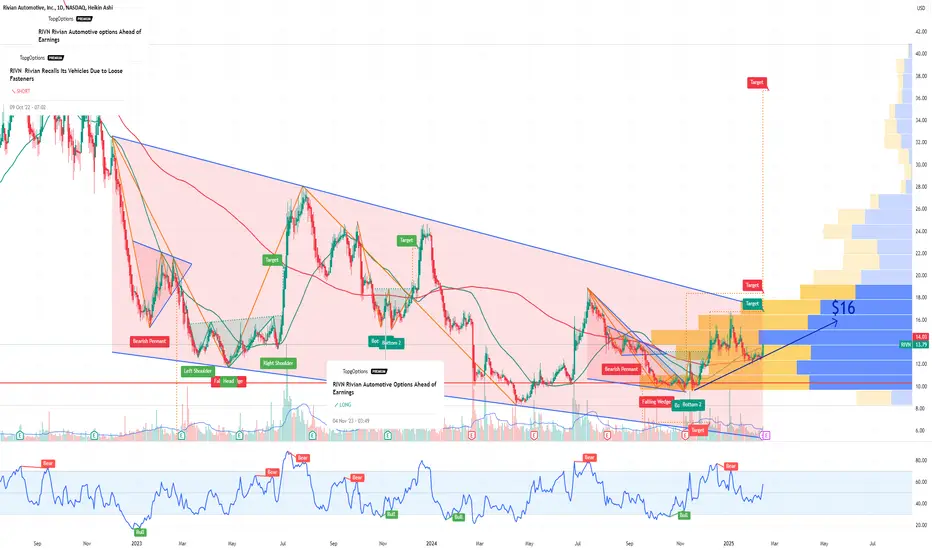
RIVN Rivian Automotive Options Ahead of EarningsIf you haven`t sold RIVN after the recalls:
Now analyzing the options chain and the chart patterns of RIVN Rivian Automotive prior to the earnings report this week,
I would consider purchasing the 16usd strike price Calls with
an expiration date of 2025-4-17,
for a premium of approximately $0.93.
If these options prove to be profitable prior to the earnings release, I would sell at least half of them.
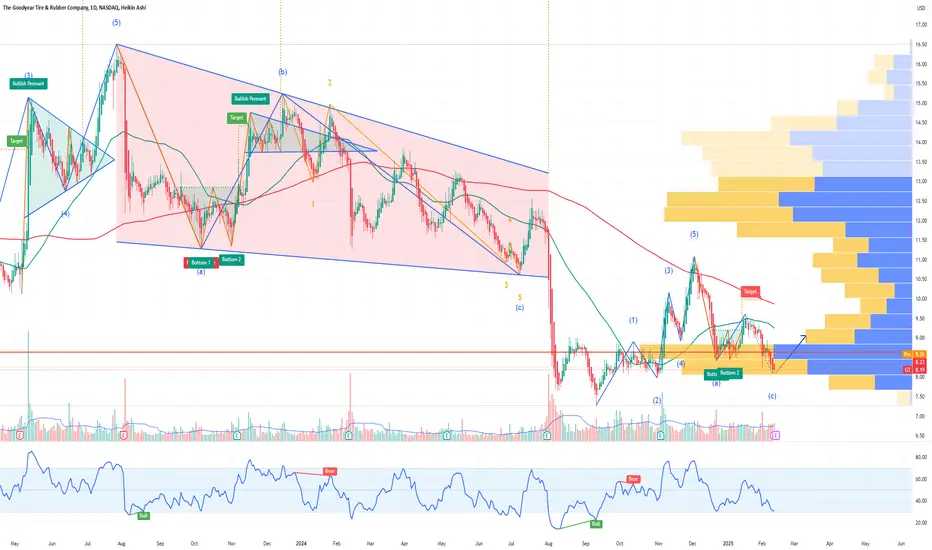
GT The Goodyear Tire & Rubber Company Options Ahead of EarningsAnalyzing the options chain and the chart patterns of AGT The Goodyear Tire & Rubber Company prior to the earnings report this week,
I would consider purchasing the 8usd strike price Calls with
an expiration date of 2025-2-21,
for a premium of approximately $0.57.
If these options prove to be profitable prior to the earnings release, I would sell at least half of them.
GOOGL Alphabet Options Ahead of EarningsIf you haven`t bought the dip on GOOGL:
Now analyzing the options chain and the chart patterns of GOOGL Alphabet prior to the earnings report this week,
I would consider purchasing the 200usd strike price Calls with
an expiration date of 2025-2-7,
for a premium of approximately $7.20.
If these options prove to be profitable prior to the earnings release, I would sell at least half of them.

META Platforms Options Ahead of Earnings If you haven`t bought META before the rally:
Now analyzing the options chain and the chart patterns of META Platforms prior to the earnings report this week,
I would consider purchasing the 660usd strike price Calls with
an expiration date of 2025-2-21,
for a premium of approximately $32.20.
If these options prove to be profitable prior to the earnings release, I would sell at least half of them.

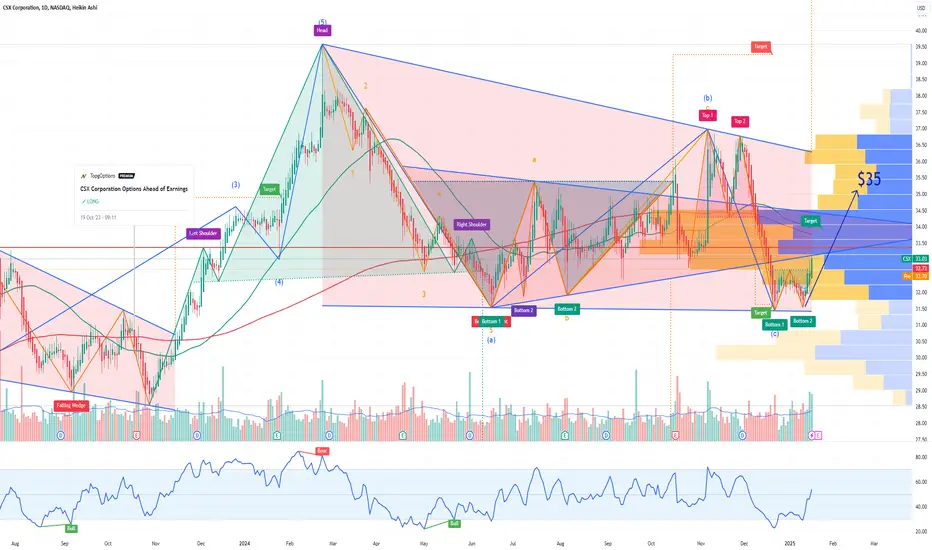
CSX Corporation Options Ahead of EarningsIf you haven`t bought CSX before the previous rally:
Now analyzing the options chain and the chart patterns of CSX Corporation prior to the earnings report this week,
I would consider purchasing the 35usd strike price Calls with
an expiration date of 2025-6-20,
for a premium of approximately $1.10.
If these options prove to be profitable prior to the earnings release, I would sell at least half of them.
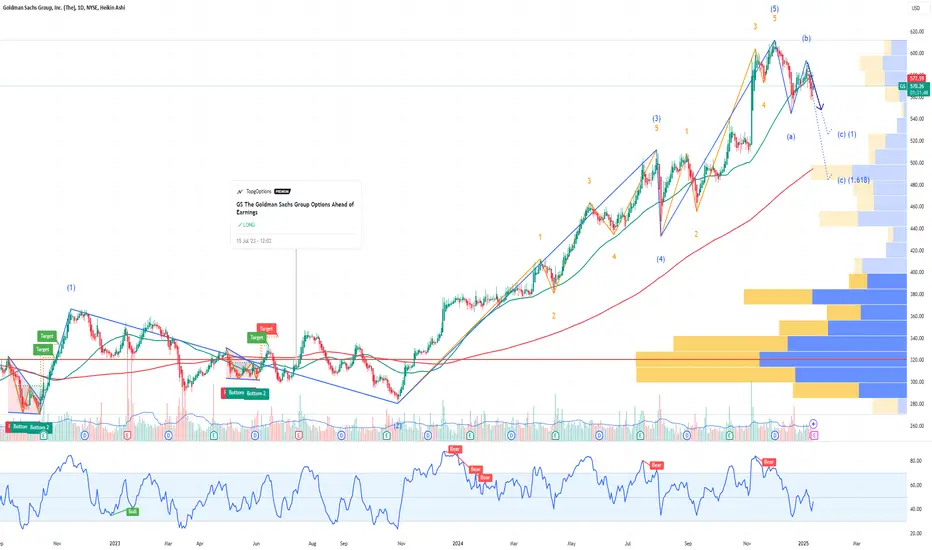
GS The Goldman Sachs Group Options Ahead of EarningsIf you haven`t bought the dip on GS:
Now analyzing the options chain and the chart patterns of GS The Goldman Sachs Group prior to the earnings report this week,
I would consider purchasing the 555usd strike price Puts with
an expiration date of 2025-1-17,
for a premium of approximately $4.60.
If these options prove to be profitable prior to the earnings release, I would sell at least half of them.
TTAN ServiceTitan Options Ahead of EarningsAnalyzing the options chain and the chart patterns of TTAN ServiceTitan prior to the earnings report this week,
I would consider purchasing the 130usd strike price Calls with
an expiration date of 2025-1-17,
for a premium of approximately $0.95.
If these options prove to be profitable prior to the earnings release, I would sell at least half of them.

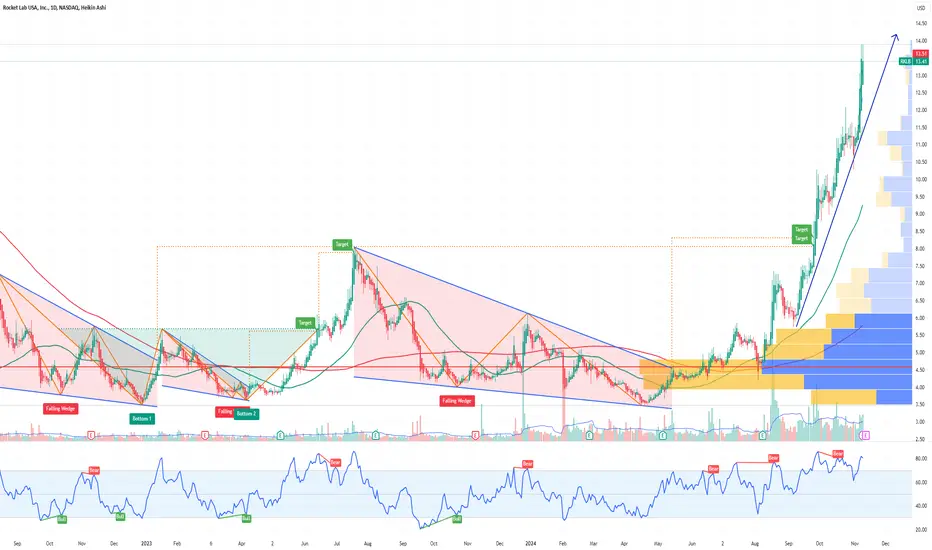
RKLB Rocket Lab USA Options Ahead of EarningsAnalyzing the options chain and the chart patterns of RKLB Rocket Lab USA prior to the earnings report this week,
I would consider purchasing the 13usd strike price Calls with
an expiration date of 2025-1-17,
for a premium of approximately $2.30.
If these options prove to be profitable prior to the earnings release, I would sell at least half of them.