SPG Approaching A Red Resistance ZoneNYSE:SPG has been in an uptrend since Oct. 2023, and is approaching a red resistance zone. I think there is likely to be resistance ahead, and I would look for an options puts trade setup.
Optionsstrategies

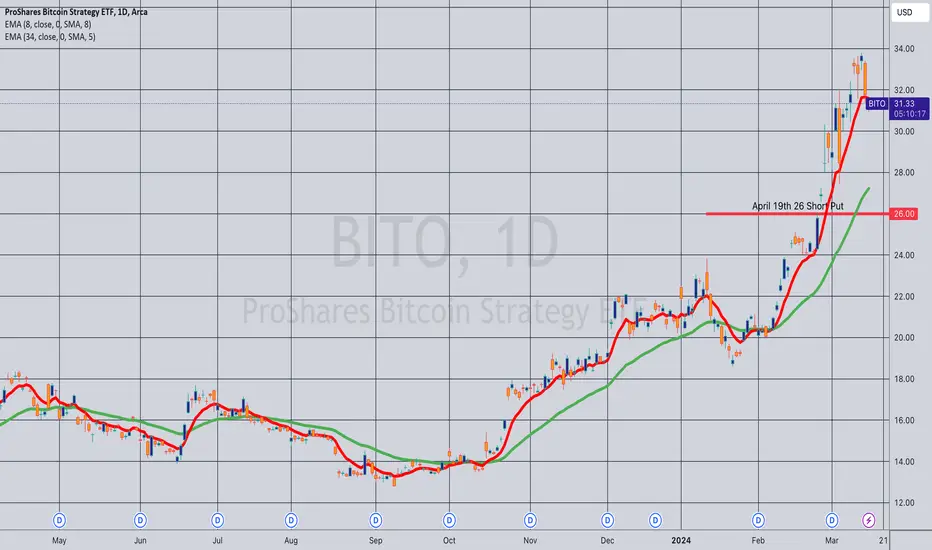
Opening (IRA): BITO April 19th 26 Short Put... for a 1.23 credit.
Comments: Adding to my covered call position (See Post Below) on weakness, converting the covered call into a covered strangle (i.e., short put + stock + short call). I went with April, since May appeared to be shit illiquid at where I'd want to pitch my tent.
I'm fine with being assigned additional stock here at the 26 strike, since my cost basis in my shares is currently 27.54, with the cost basis in any shares assigned via the 26 at 24.77, although my preference would be just to take profit on the covered call aspect at 50% max and the short put at 50% max and move on.
Naturally, if I also manage to grab the April dividend, that would be additionally bueno.
As a standalone trade:
Break Even/Buying Power Effect/Cost Basis in Any Assigned Shares: 24.77
Max Profit: 1.23 ($123)
ROC at Max: 4.97%
ROC at 50% Max: 2.48%
AAPL - 190 17 MAY 24 CALLs Looking into this continuation back to retest $182 for quick profit taking/exit on the AAPL 190 17 MAY 24 Calls.
Follow for more and live updates on this chart!

Options Blueprint Series: Perfecting the Butterfly SpreadIntroduction to the Butterfly Spread Strategy
A Butterfly Spread is an options strategy combining bull and bear spreads (calls or puts), with a fixed risk and capped profit potential. This strategy involves three strike prices, typically employed when little market movement is expected. It's an excellent fit for the highly liquid energy sector, particularly CL WTI Crude Oil Futures Options, where traders seek to capitalize on stability or minor price fluctuations.
Understanding CL WTI Crude Oil Futures Options
WTI (West Texas Intermediate) Crude Oil Futures are one of the world's most traded energy products. These futures are traded on the NYMEX and are highly regarded for their liquidity and transparency. The introduction of Micro WTI Crude Oil Futures has further democratized access to oil markets, allowing for more granular position management and lower capital requirements.
Key Contract Specifications for Crude Oil Futures:
Standard Crude Oil Futures (CL)
Contract Size: Each contract represents 1,000 barrels of crude oil.
Price Quotation: Dollars and cents per barrel.
Trading Hours: 24 hours a day, Sunday-Friday, with a 60-minute break each day.
Tick Size: $0.01 per barrel, equivalent to a $10.00 move per contract.
Product Code: CL
Micro Crude Oil Futures (MCL):
Contract Size: Each contract represents 100 barrels of crude oil, 1/10th the size of the standard contract.
Price Quotation: Dollars and cents per barrel.
Trading Hours: Mirrors the standard CL futures for seamless market access.
Tick Size: $0.01 per barrel, equivalent to a $1.00 move per contract.
Product Code: MCL
Options on Crude Oil Futures : Options on WTI Crude Oil Futures offer traders the ability to hedge price risk or speculate on the price movements. These options provide the flexibility of exercising into futures positions upon expiration.
Constructing a Butterfly Spread
The essence of a Butterfly Spread lies in its construction: It involves buying one in-the-money (ITM) option, selling two at-the-money (ATM) options, and buying one out-of-the-money (OTM) option. For CL WTI Crude Oil Futures Options, this could translate into buying an ITM call or put, selling two ATM calls or puts, and buying an OTM call or put, all with the same expiration date. The goal is to profit from the premium decay of the ATM options faster than the ITM and OTM options, especially as the futures price gravitates towards the middle strike price.
Using call options would typically generate positive delta making the strategy slightly bullish. Using put options would typically generate negative delta making the strategy slightly bearish.
Selection of Strike Prices: Identify suitable ITM, ATM, and OTM strike prices based on current crude oil futures prices and expected market movement. (The below chart example uses Support and Resistance UFO price levels to determine the optimal Strike Selection.)
Determine Expiration: Choose an expiration date that balances time decay with your market outlook.
Manage Premiums: The premiums paid and received for these options should result in a net debit, establishing your maximum risk.
Advantages and Risks
Advantages:
Defined Risk: The maximum potential loss is known at the trade's outset, limited to the net debit of establishing the spread.
Profit Potential: Profits are maximized if the futures price is at the middle strike at expiration.
Flexibility: Suitable for various market conditions, especially in a range-bound market.
Risks:
Limited Profit: The strategy caps the maximum profit, which is achieved under very specific conditions.
Commission Costs: Multiple legs mean higher transaction costs, which can erode profits.
Complexity: Requires careful planning and monitoring, making it less suitable for novice traders.
The construction of a Butterfly Spread in the context of CL WTI Crude Oil Futures Options highlights the strategic depth required to navigate the volatile energy market. Meanwhile, understanding its advantages and inherent risks equips traders with the knowledge to apply this strategy effectively, balancing the potential for profit against the complexity and costs involved.
Market Scenarios and Butterfly Spread Performance
The performance of a Butterfly Spread in CL WTI Crude Oil Futures Options is highly contingent on market stability and slight fluctuations. Given crude oil's propensity for volatility, identifying periods of consolidation or mild trend is crucial for this strategy's success.
Neutral Market Conditions: Ideal for a Butterfly Spread, where prices oscillate within a narrow range around the ATM strike price.
Volatility Impact: Sudden spikes or drops in crude oil prices can move the market away from the strategy's profitable zone, reducing its effectiveness.
Understanding these scenarios helps in planning entry and exit strategies, aligning them with expected market movements and historical price behavior within the crude oil market.
Executing the Strategy
Executing a Butterfly Spread involves precise timing and adherence to a pre-defined risk management plan. The entry point is critical, often timed with expected market stagnation or minor fluctuations.
Entry Criteria: Initiate the spread when volatility is expected to decrease, or ahead of market events predicted to have a muted impact.
Adjustments: If the market moves unfavorably, adjustments can be made, such as rolling out the spread to a further expiration or adjusting strike prices.
Exit Strategy: The ideal exit is at expiration, with the futures price at the ATM option's strike. However, taking early profits or cutting losses based on predefined criteria can optimize outcomes.
Case Study: Applying Butterfly Spread to Crude Oil Market
Let's explore a hypothetical scenario where a trader employs a Butterfly Spread in anticipation of a stable WTI Crude Oil market. The futures are trading at $80.63 per barrel. The trader expects the price to move down slowly due to mixed market signals even though key support and resistance (UFOs) price levels would indicate a potential fall.
As seen on the below screenshot, we are using the CME Group Options Calculator in order to generate fair value prices and Greeks for any options on futures contracts.
Underlying Asset: WTI Crude Oil Futures or Micro WTI Crude Oil Futures (Symbol: CL1! or MCL1!)
Strategy Setup:
Buy 1 ITM put option with a strike price of $82.5 (Cost: $3.00 per barrel)
Sell 2 ATM put options with a strike price of $78 (Credit: $0.92 per barrel each)
Buy 1 OTM put option with a strike price of $73.5 (Cost: $0.24 per barrel)
Net Debit: $1.40 per barrel ($3.00 - $0.92 - $0.92 + $0.24)
Maximum Profit: Achieved if crude oil prices are at $78 at expiration.
Maximum Risk: Limited to the net debit of $1.40 per barrel.
Over the following days/weeks, crude oil prices could fluctuate mildly due to competing factors in the market but ultimately close at $78 at the options' expiration. The trader's maximum profit scenario is realized, demonstrating the strategy's effectiveness in a stable market.
Risk Management Considerations
Executing a Butterfly Spread or any options strategy without a robust risk management plan is perilous.
The following considerations are essential for traders:
Use of Stop Loss Orders: To mitigate losses in unexpected market moves.
Hedging: Employing alternative positions to protect against adverse price movements.
Defined Risk Exposure: Always know the maximum potential loss before entering any trade.
Market Analysis: Continuous monitoring and analysis of the crude oil market for signs that may necessitate strategy adjustment.
Conclusion
The Butterfly Spread is a nuanced strategy that, when applied carefully, can offer traders of CL WTI Crude Oil Futures Options a means to capitalize on relatively slow market moves. While the potential for profit is capped, so is the risk, making it an attractive option for those with a precise market outlook. It exemplifies the strategic depth available to options traders, allowing for profit in less volatile market conditions.
When charting futures, the data provided could be delayed. Traders working with the ticker symbols discussed in this idea may prefer to use CME Group real-time data plan on TradingView: tradingview.sweetlogin.com This consideration is particularly important for shorter-term traders, whereas it may be less critical for those focused on longer-term trading strategies.
General Disclaimer:
The trade ideas presented herein are solely for illustrative purposes forming a part of a case study intended to demonstrate key principles in risk management within the context of the specific market scenarios discussed. These ideas are not to be interpreted as investment recommendations or financial advice. They do not endorse or promote any specific trading strategies, financial products, or services. The information provided is based on data believed to be reliable; however, its accuracy or completeness cannot be guaranteed. Trading in financial markets involves risks, including the potential loss of principal. Each individual should conduct their own research and consult with professional financial advisors before making any investment decisions. The author or publisher of this content bears no responsibility for any actions taken based on the information provided or for any resultant financial or other losses.

WRAP Wrap Technologies Options Ahead of EarningsAnalyzing the options chain and the chart patterns of WRAP Wrap Technologies prior to the earnings report this week,
I would consider purchasing the 2usd strike price Puts with
an expiration date of 2024-5-17,
for a premium of approximately $0.32.
If these options prove to be profitable prior to the earnings release, I would sell at least half of them.

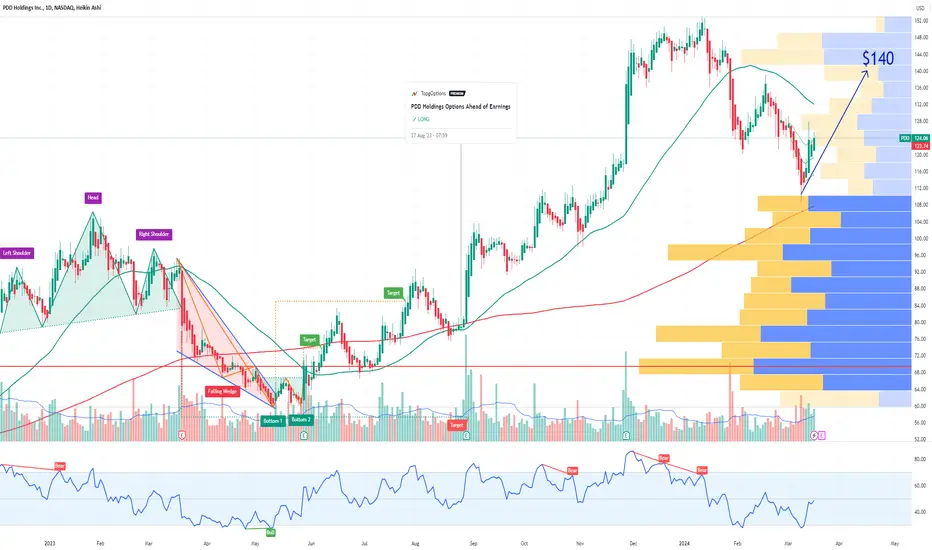
PDD Holdings Options Ahead of EarningsIf you haven`t bought PDD before the previous earnings:
Then analyzing the options chain and the chart patterns of PDD Holdings prior to the earnings report this week,
I would consider purchasing the 140usd strike price Calls with
an expiration date of 2024-6-21,
for a premium of approximately $10.75.
If these options prove to be profitable prior to the earnings release, I would sell at least half of them.
Opening (IRA): TQQQ April 19th 52 Short Put... for a 1.54 credit.
Comments: Adding a short put component to my TQQQ covered call (See Post Below) here on weakness.
Metrics:
Break Even/Buying Power Effect/Resulting Cost Basis In Stock: 50.46
Max Profit: 1.53/$153
ROC at Max: 3.03%
ROC at 50% Max: 1.52%
Will generally look to take profit on the covered call component at 50% max and the short put component at 50% max.

Opening (IRA): TQQQ April 19th 53 Monied Covered Call... for a 50.93 debit.
Comments: Selling the -75 delta strike against a one lot to emulate a 25 delta short put with built-in defense via the short call.
The call IV skew that I was looking to take advantage of before has evaporated somewhat, with the same strike short put paying about the same (1.94) as the max profit potential of this setup. Since I'm doing this in a cash secured environment, I don't get much BP relief over doing the monied versus the short put, so am really doing this setup for its "built-in defense" that I don't have to add in later, as I would should I want to defend a short put.
Will generally look to take profit on the entire setup at 50% max, look to roll out the short call at 50% max, and add at intervals, assuming I can get in at lower risk strikes.
Metrics:
Cost Basis/BPE/Break Even: 50.93
Max Profit: 2.07
ROC at Max: 4.06%
ROC at 50% Max: 2.03%

Opened (IRA): GDX March 15th 27 Monied Covered Call... for a 26.21 debit.
Comments: 42.2 IV/32.8% 30-day IV. Before I went to take a nap, added a "rung" on weakness here to my position, buying a one lot and selling a -75 call against. I already have a February monied on (See Post Below), so went out to March for this setup.
The call IV at the 27 strike: 37.32%. The put side at the same strike: 29.49% with their respective maxes being .79 for the 27 monied; .49 for the 27 short put.
As previously noted, this only makes sense in a cash secured environment where you don't get much BP relief by hanging out in the options. This cost 26.21 to put on in the IRA; the 27 short put would cost 26.51. Compare on margin: 26.21 buying power effect for this setup, 3.18 BPE for the 27 short put. Put another way: you generally don't do this setup on margin because it isn't BP efficient.
Metrics:
Buying Power Effect/Cost Basis/Break Even: 26.21
Max Profit (The Short Call Strike Price - Cost Basis): .79 ($79)
ROC %-age At Max: 3.01%/15.70% Annualized
ROC %-age at 50% Max: 1.51%/7.85% Annualized

How to Start Future and Options Trading?Future and option trading are popular investment strategies in the world of finance. Both involve making investments in financial instruments with the expectation of making a profit. While the two types of trading have their similarities, they are also quite different in terms of their structure and the risks involved.
Before you start trading in the Future and Options segment, you need to understand the basics of F&O first.
So, let’s understand its basics first.
What are futures?
Futures are financial contracts that allow traders to buy or sell an asset at a predetermined price and date in the future.
The price of the asset in the future is agreed upon at the time the contract is made. Futures trading can involve a wide range of assets, such as stocks, commodities, currencies, and bonds.
The main advantage of futures trading is that it allows traders to make investments in assets that they may not otherwise have access to.
It also provides a way for traders to hedge their existing investments. For example , if a trader owns a stock that they expect to decrease in value, they can sell a futures contract for that stock and lock in the current market price.
If the stock does decrease in value, the trader can buy back the futures contract at a lower price and make a profit.
What are the options?
Options are contracts that give traders the right, but not the obligation, to buy or sell an asset at a predetermined price and date in the future.
The price of the asset in the future is agreed upon at the time the contract is made, but the trader is not obligated to follow through with the trade. Options trading can also involve a wide range of assets.
The main advantage of options trading is that it provides traders with flexibility.
They can choose to buy or sell an option, depending on their investment goals. Options also provide traders with a way to limit their losses.
For example , if a trader owns a stock that they expect to decrease in value, they can buy a put option for that stock. If the stock does decrease in value, the trader can exercise the option and sell the stock at the predetermined price, limiting their losses.
Lot Size:
In the context of Futures and Options (F&O) trading, lot size refers to the standardized quantity of the underlying asset specified in the contract.
It represents the minimum number of units of the underlying asset that can be bought or sold in a single F&O transaction.
For example , if the lot size of a stock in the F&O market is 500, then a trader has to buy or sell a minimum of 500 units of that stock in a single transaction. The lot size is determined by the stock exchange and is specified in the contract specifications for each F&O instrument.
The lot size is an important factor in F&O trading as it determines the margin required for trading, the minimum quantity that can be traded, and the maximum loss that can be incurred in a single transaction.
Traders need to be aware of the lot size of the F&O contract they wish to trade to ensure they have sufficient capital to cover the margin requirements and to avoid inadvertently taking a larger position than intended.
It is also worth noting that the lot size of F&O contracts can change over time. Stock exchanges may adjust the lot size based on factors such as the liquidity of the underlying asset, market conditions, and regulatory requirements.
Traders should regularly check the contract specifications of the F&O instruments they are interested in trading to ensure they have the most up-to-date information on lot sizes.
Differences between futures and options:
While futures and options have some similarities, they also have some key differences. One of the main differences is that futures contracts are binding, while options contracts are not.
This means that traders who buy futures contracts are obligated to follow through with the trade, while traders who buy options contracts have the flexibility to choose whether or not to follow through with the trade.
Another difference is the level of risk involved. Futures trading is generally considered to be riskier than options trading because traders are obligated to follow through with the trade, even if the market conditions are not favourable.
Options trading, on the other hand, provides traders with more flexibility to limit their losses.
Future and option trading can be complex, and it is important for traders to understand the risks involved before making any investments.
It is also important for traders to have a clear understanding of their investment goals and to choose the trading strategy that best aligns with those goals.
Steps to start future and option trading:
Here are some steps to help you get started with F&O trading:
Learn the basics of F&O trading: F&O trading involves complex financial instruments and can be risky if you do not understand how it works.
You should educate yourself about the basics of F&O trading, including concepts such as lot size, margin, expiry, and strike price.
Develop a Trading Plan: Before you start trading, it is important to have a well-defined trading plan that includes your investment goals, risk tolerance, trading strategy, and money management rules.
You should also decide on the F&O instruments you want to trade, based on factors such as liquidity, volatility, and your level of expertise.
Start with a small investment: F&O trading involves high leverage and can result in significant profits or losses.
It is advisable to start with a small investment and gradually increase your exposure as you gain experience and confidence.
Monitor your positions: F&O trading requires active monitoring of your positions as the market can move quickly and your profit or loss can change rapidly.
You must use tools such as stop-loss orders and trailing stop-loss orders to manage your risk.
In conclusion:
F&O trading can be a profitable investment opportunity for traders who are willing to put in the time and effort to learn and develop a trading plan. However, it is important to understand the risks involved and to trade with caution.
___________________________
💻📞☎️ always do your research.
💌📫📃 If you have any questions, you can write me in the comments below, and I will answer them.
📊📌❤️And please don't forget to support this idea with your likes and comment
NNDM Nano Dimension Options Ahead of EarningsAnalyzing the options chain and the chart patterns of NNDM Nano Dimension prior to the earnings report this week,
I would consider purchasing the 3usd strike price Calls with
an expiration date of 2024-5-17,
for a premium of approximately $0.15.
If these options prove to be profitable prior to the earnings release, I would sell at least half of them.

Options Blueprint Series Strangles vs. StraddlesIntroduction
In the realm of options trading, the choice of strategy significantly impacts the trader's ability to navigate market uncertainties. Among the plethora of strategies, the Strangle holds a unique position, offering flexibility in unclear market conditions without the upfront costs associated with more conventional approaches like the Straddle. This article delves into the intricacies of the Strangle strategy, emphasizing its application in the volatile world of Gold Futures trading. For traders seeking a foundation in the Straddle strategy, refer to our earlier discussion in "Options Blueprint Series: Straddle Your Way Through The Unknown" -
In-Depth Look at the Strangle Strategy
The Strangle strategy involves purchasing a call option and a put option with the same expiration date but different strike prices. Typically, the call strike price is higher than the current market price, while the put strike price is lower. This approach is designed for situations where a significant price movement is anticipated, but the direction of the movement is uncertain. It's particularly effective in markets prone to sudden swings, making it a valuable strategy for Gold Futures traders who face volatile market conditions.
Advantages of the Strangle strategy include its lower upfront cost compared to the Straddle strategy, as options are bought out-of-the-money (OTM). This aspect makes it a more accessible strategy for traders with budget constraints. The potential for unlimited profits, should the market make a strong move in either direction, further adds to its appeal.
However, the risks include the total loss of the premium paid if the market does not move significantly and both options expire worthless. Therefore, timing and market analysis are critical when implementing a Strangle in the gold market.
Example: Consider a scenario where Gold Futures are trading at $1,800 per ounce. Anticipating volatility, a trader might purchase a call option with a strike price of $1,820 and a put option with a strike price of $1,780. If gold prices swing widely enough in either direction, the strategy could yield substantial profits.
Strangle vs. Straddle: Understanding the Key Differences
The Strangle and Straddle strategies are both designed to capitalize on market volatility, yet they differ significantly in execution and ideal market conditions. While the Straddle strategy involves buying a call and put option at the same strike price, the Strangle strategy opts for different strike prices. This fundamental difference impacts their cost, risk, and potential return.
Cost Implications: The Strangle strategy is generally less expensive than the Straddle due to the use of out-of-the-money options. This lower initial investment makes the Strangle appealing to traders with tighter budget constraints or those looking to manage risk more conservatively.
Risk Exposure and Profit Potential: Although both strategies offer unlimited profit potential, the Strangle requires a more significant price move to reach profitability due to its out-of-the-money positions. Consequently, the risk of total premium loss is higher with Strangles if the anticipated volatility does not materialize to a sufficient degree.
Market Conditions: Straddles are best suited for markets where significant price movement is expected but without clear directional bias. Strangles, given their lower cost, might be preferred in situations where substantial volatility is anticipated but with a slightly lower conviction level, allowing for larger market moves before profitability.
In the context of Gold Futures and Micro Gold Futures, traders might lean towards a Strangle strategy when expecting major market events or economic releases that could induce significant gold price fluctuations. The choice between a Strangle and a Straddle often comes down to the trader's market outlook, risk tolerance, and cost considerations.
Application to Gold Futures and Micro Gold Futures
Implementing a Strangle in the Gold Futures market requires a keen understanding of underlying market conditions and volatility. Given the precious metal's sensitivity to global economic indicators, political instability, and changes in demand, traders can leverage the Strangle strategy to capitalize on expected price swings without committing to a directional bet. When applying a Strangle to Gold Futures, selecting the appropriate strike prices becomes crucial. The goal is to position the OTM options in a way that balances the potential for significant price movements with the cost of premiums paid. This balance is critical in scenarios like central bank announcements or inflation reports, where gold prices can experience sharp movements, offering the potential for Strangle strategies to flourish.
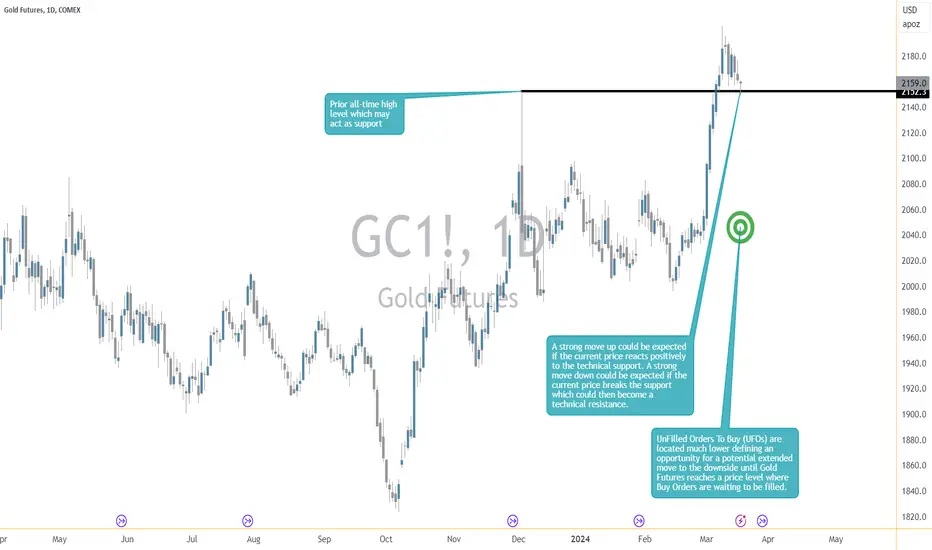
Long Straddle Trade-Example
Underlying Asset: Gold Futures or Micro Gold Futures (Symbol: GC1! or MGC1!)
Strategy Components:
Buy Put Option: Strike Price 2275
Buy Call Option: Strike Price 2050
Net Premium Paid: 11.5 points = $1,150 ($115 with Micros)
Micro Contracts: Using MGC1! (Micro Gold Futures) reduces the exposure by 10 times
Maximum Profit: Unlimited
Maximum Loss: Net Premium paid
Risk Management
Effective risk management is paramount when employing options strategies like the Strangle, especially within the volatile realms of Gold Futures and Micro Gold Futures trading. Traders should be acutely aware of the expiration dates and the time decay (theta) of options, which can erode the potential profitability of a Strangle strategy as the expiration date approaches without significant price movement in the underlying asset. To mitigate such risks, it's common to set clear criteria for adjusting or exiting the positions. This could involve rolling out the options to a further expiration date or closing the position to limit losses once certain thresholds are met.
Additionally, the use of stop-loss orders or protective puts/calls as part of a broader trading plan can provide a safety net against unforeseen market reversals. Such techniques ensure that losses are capped at a predetermined level, allowing traders to preserve capital for future opportunities.
Conclusion
The Strangle and Straddle strategies each offer unique advantages for traders navigating the Gold Futures market's uncertainties. By understanding the distinct characteristics and application scenarios of each, traders can make informed decisions tailored to their market outlook and risk tolerance. While the Strangle strategy offers a cost-effective means to leverage expected volatility, it also necessitates a disciplined approach to risk management and an acute understanding of market dynamics.
When charting futures, the data provided could be delayed. Traders working with the ticker symbols discussed in this idea may prefer to use CME Group real-time data plan on TradingView: tradingview.sweetlogin.com This consideration is particularly important for shorter-term traders, whereas it may be less critical for those focused on longer-term trading strategies.
General Disclaimer:
The trade ideas presented herein are solely for illustrative purposes forming a part of a case study intended to demonstrate key principles in risk management within the context of the specific market scenarios discussed. These ideas are not to be interpreted as investment recommendations or financial advice. They do not endorse or promote any specific trading strategies, financial products, or services. The information provided is based on data believed to be reliable; however, its accuracy or completeness cannot be guaranteed. Trading in financial markets involves risks, including the potential loss of principal. Each individual should conduct their own research and consult with professional financial advisors before making any investment decisions. The author or publisher of this content bears no responsibility for any actions taken based on the information provided or for any resultant financial or other losses.
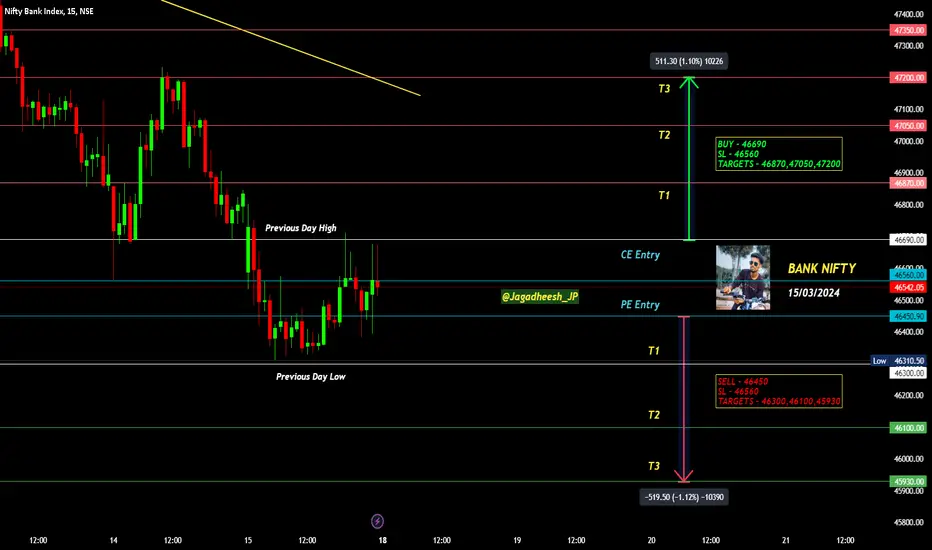
BANK NIFTY INTRADAY LEVELS FOR 18/03/2024BUY ABOVE - 46690
SL - 46560
TARGETS - 46870,47050,47200
SELL BELOW - 46450
SL - 46560
TARGETS - 46300,46100,45930
NO TRADE ZONE - 46450 to 46690
Previous Day High - 46690
Previous Day Low - 46300
Based on price action major support & resistance's are here, the red lines acts as resistances, the green lines acts as supports. If the price breaks the support/resistance, it will move to the next support/resistance line. White lines indicates previous day high & low, high acts as a resistance & low acts as a support for next day.
Trendlines are also significant to price action. If the price is above/below the trendlines, can expect an UP/DOWN with aggressive move.
Please NOTE: this levels are for intraday trading only.
Disclaimer - All information on this page is for educational purposes only,
we are not SEBI Registered, Please consult a SEBI registered financial advisor for your financial matters before investing And taking any decision. We are not responsible for any profit/loss you made.
Request your support and engagement by liking and commenting & follow to provide encouragement
HAPPY TRADING 👍
NIFTY INTRADAY LEVELS FOR 18/03/2024BUY ABOVE - 22060
SL - 22010
TARGETS - 22120,22170,22210
SELL BELOW - 21980
SL - 22010
TARGETS - 21940,21900,21850
NO TRADE ZONE - 21980 to 22060
Previous Day High - 22120
Previous Day Low - 21940
Based on price action major support & resistance's are here, the red lines acts as resistances, the green lines acts as supports. If the price breaks the support/resistance, it will move to the next support/resistance line. White lines indicates previous day high & low, high acts as a resistance & low acts as a support for next day.
Trendlines are also significant to price action. If the price is above/below the trendlines, can expect an UP/DOWN with aggressive move.
Please NOTE: this levels are for intraday trading only.
Disclaimer - All information on this page is for educational purposes only,
we are not SEBI Registered, Please consult a SEBI registered financial advisor for your financial matters before investing And taking any decision. We are not responsible for any profit/loss you made.
Request your support and engagement by liking and commenting & follow to provide encouragement
HAPPY TRADING 👍

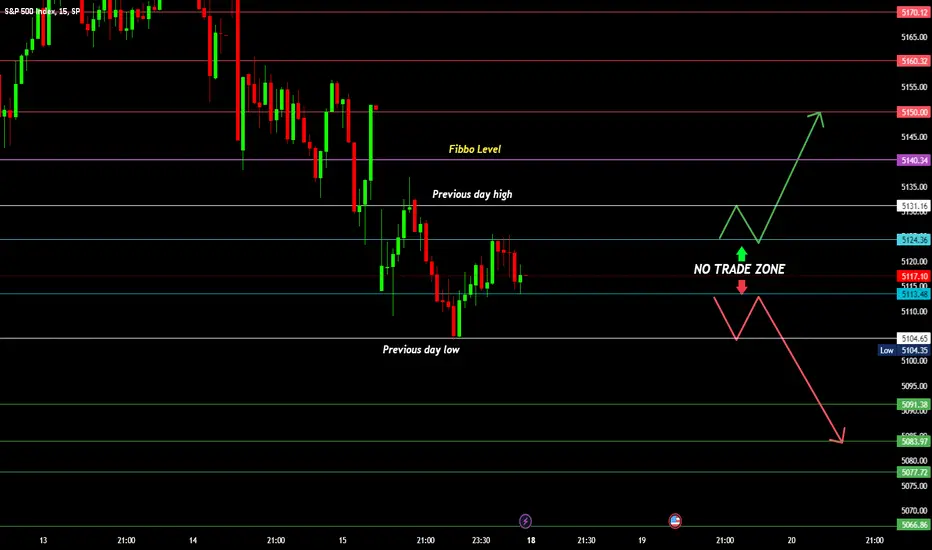
S&P 500 INTRADAY LEVELS FOR 18/03/2024BUY ABOVE - 5124
SL - 5113
TARGETS - 5131,5140,5150
SELL BELOW - 5113
SL - 5124
TARGETS - 5104,5091,5083
NO TRADE ZONE - 5113 to 5124
Previous Day High - 5131
Previous Day Low - 5104
Based on price action major support & resistance's are here, the red lines acts as resistances, the green lines acts as supports. If the price breaks the support/resistance, it will move to the next support/resistance line. White lines indicates previous day high & low, high acts as a resistance & low acts as a support for next day.
Trendlines are also significant to price action. If the price is above/below the trendlines, can expect an UP/DOWN with aggressive move.
Please NOTE: this levels are for intraday trading only.
Disclaimer - All information on this page is for educational purposes only,
we are not SEBI Registered, Please consult a SEBI registered financial advisor for your financial matters before investing And taking any decision. We are not responsible for any profit/loss you made.
Request your support and engagement by liking and commenting & follow to provide encouragement
HAPPY TRADING 👍
Google all time highGoogle is not letting me tag em..
Anyways, All Time High is on the table. Again, know the rules of the business.
March 17, 2024, 8:40 am, Sunday
