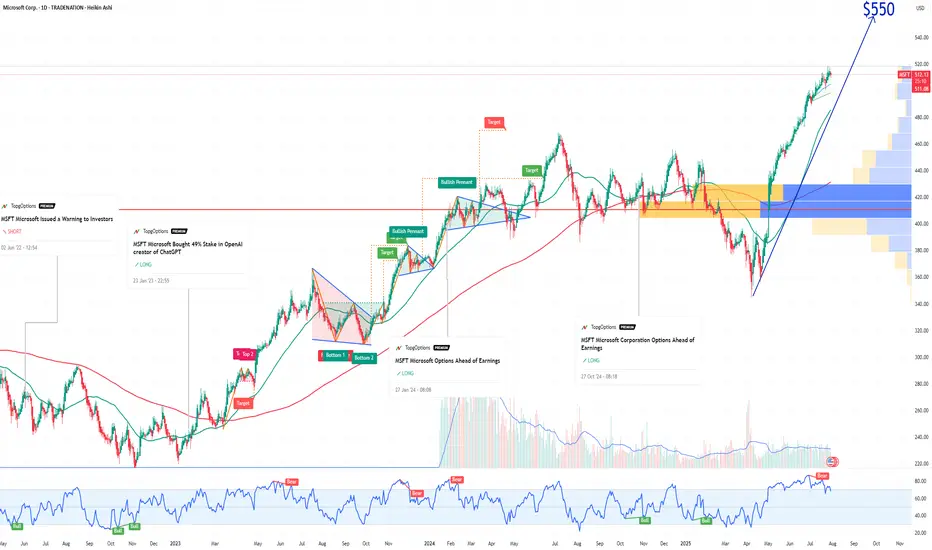
MSFT Microsoft Corporation Options Ahead of EarningsIf you haven`t bought MSFT when they announced the 49% stake in OpenAI:
Now analyzing the options chain and the chart patterns of MSFT Microsoft Corporation prior to the earnings report this week,
I would consider purchasing the 550usd strike price Calls with
an expiration date of 2025-12-19,
for a premium of approximately $14.75.
If these options prove to be profitable prior to the earnings release, I would sell at least half of them.
Disclosure: I am part of Trade Nation's Influencer program and receive a monthly fee for using their TradingView charts in my analysis.
Optionstrading
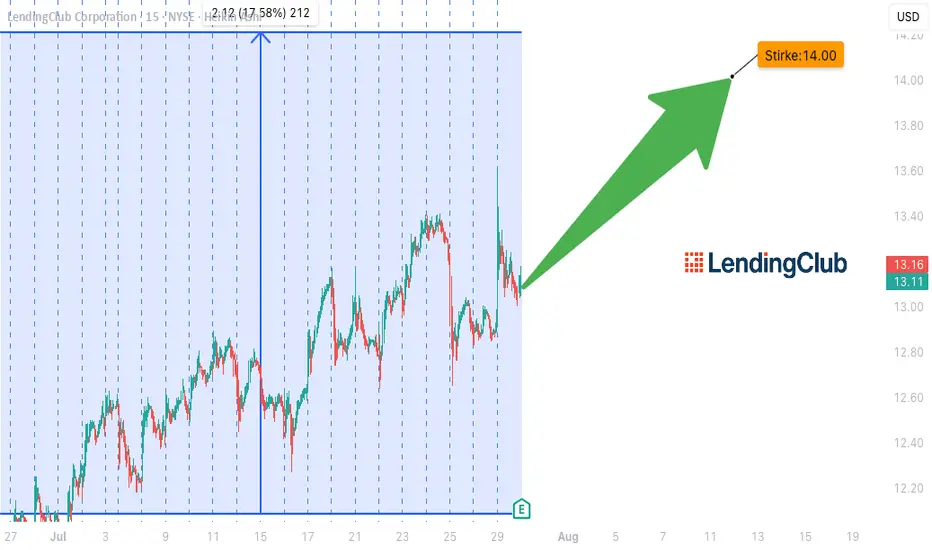
LC EARNINGS PLAY – STRIKE WHILE IT'S HOT!**
🚨 **LC EARNINGS PLAY – STRIKE WHILE IT'S HOT!** 🚨
📅 **Earnings Season Heat Check: LC | Jul 29**
💰 **Positioning for a Post-Earnings POP!**
---
🔥 **The Setup:**
LC’s earnings momentum is real –
📈 TTM Rev Growth: **+13.1%**
💹 EPS Surprise Rate: **150% avg**
📊 75% Beat Rate History
💵 Analyst Consensus: **Strong Buy (1.8/5)**
---
📉 **Technical Tailwind:**
✅ Price above 20D + 200D MA
✅ RSI: **60.07** – room to run
📈 Volume Spike: **+61% above 10-day avg**
🚀 Options flow targeting **\$14 CALLS** w/ OI: **864** / Vol: **737**
---
📌 **TRADE IDEA**
🎯 Buy: **\$14.00 Call @ \$0.70**
📆 Exp: **Aug 15, 2025**
🎯 Target: **\$2.10** (Risk/Reward = 1:3)
🛑 Stop: **\$0.35**
---
⚠️ **Earnings Risk:** IV crush real.
🎯 Exit within 2 hours **post-EPS** if no move.
Macro tailwinds + financial sector rotation = 🚀 fuel.
**Beta = 2.45** → Big move potential incoming!
---
🧠 Confidence Level: **75%**
⏰ Timing: Pre-Earnings Close
🧾 Model-Driven Strategy | No Hype, Just Edge.
---
💥 Let’s ride the LC earnings wave – \$15+ in sight! 💥
\#LendingClub #LC #EarningsPlay #OptionsTrading #TradingView #StocksToWatch #CallOption #Fintech #SwingTrade #EarningsHustle #BullishSetup #IVCrush #EarningsGamma #ShortTermTrade
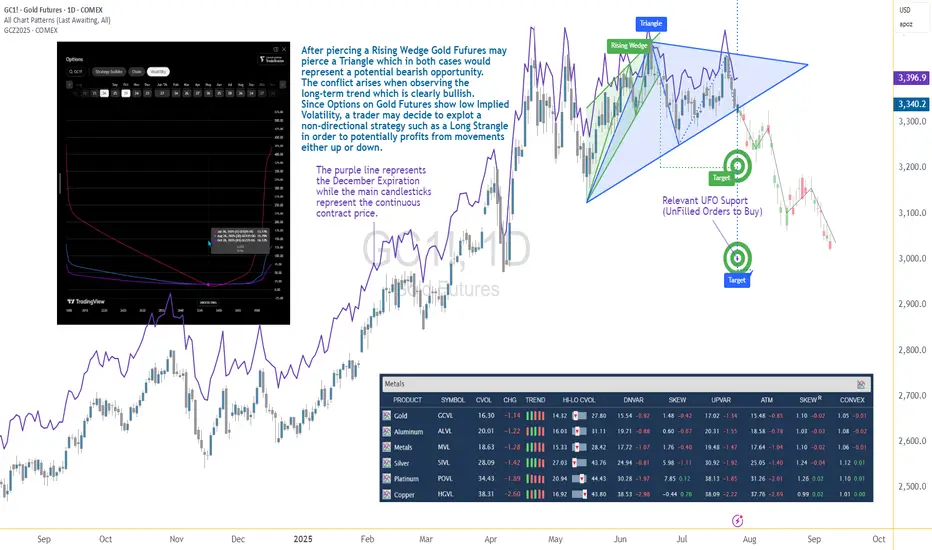
Options Blueprint Series [Intermediate]: Gold Triangle Trap PlayGold’s Volatility Decline Meets a Classic Chart Setup
Gold Futures have been steadily declining after piercing a Rising Wedge on June 20. Now, the market structure reveals the formation of a Triangle pattern nearing its apex — a point often associated with imminent breakouts. While this setup typically signals a continuation or reversal, the direction remains uncertain, and the conflict grows when juxtaposed with the longer-term bullish trajectory Gold has displayed since 2022.
The resulting dilemma for traders is clear: follow the short-term bearish patterns, or respect the dominant uptrend? In situations like these, a non-directional approach may help tackle the uncertainty while defining the risk. This is where a Long Strangle options strategy becomes highly relevant.
Low Volatility Sets the Stage for an Options Play
According to the CME Group’s CVOL Index, Gold’s implied volatility currently trades near the bottom of its 1-year range — hovering just above 14.32, with a 12-month high around 27.80. Historically, such low readings in implied volatility are uncommon and often precede sharp price movements. For options traders, this backdrop suggests one thing: options are potentially underpriced.
Additionally, an IV analysis on the December options chain reveals even more favorable pricing conditions for longer-dated expirations. This creates a compelling opportunity to position using a strategy that benefits from volatility expansion and directional movement.
Structuring the Long Strangle on Gold Futures
A Long Strangle involves buying an Out-of-the-Money (OTM) Call and an OTM Put with the same expiration. The trader benefits if the underlying asset makes a sizable move in either direction before expiration — ideal for a breakout scenario from a compressing Triangle pattern.
In this case, the trade setup uses:
Long 3345 Put (Oct 28 expiration)
Long 3440 Call (Oct 28 expiration)
With Gold Futures (Futures December Expiration) currently trading near $3,392.5, this strangle places both legs approximately 45–50 points away from the current price. The total cost of the strangle is 173.73 points, which defines the maximum risk on the trade.
This structure allows participation in a directional move while remaining neutral on which direction that move may be.
Technical Backdrop and Support Zones
The confluence of chart patterns adds weight to this setup. The initial breakdown from the Rising Wedge in June signaled weakness, and now the Triangle’s potential imminent resolution may extend that move. However, technical traders must remain alert to a false breakdown scenario — especially in trending assets like Gold.
Buy Orders below current price levels show significant buying interest near 3,037.9 (UFO Support), suggesting that if price drops, it may find support and rebound sharply. This adds further justification for a Long Strangle — the market may fall quickly toward that zone or fail and reverse just as violently.
Gold Futures and Micro Gold Futures Contract Specs and Margin Details
Understanding the product’s specifications is crucial before engaging in any options strategy:
🔸 Gold Futures (GC)
Contract Size: 100 troy ounces
Tick Size: 0.10 = $10 per tick
Initial Margin: ~$15,000 (varies by broker and volatility)
🔸 Micro Gold Futures (MGC)
Contract Size: 10 troy ounces
Tick Size: 0.10 = $1 per tick
Initial Margin: ~$1,500
The options strategy discussed here is based on the standard Gold Futures (GC), but micro-sized versions could be explored by traders with lower capital exposure preferences.
The Trade Plan: Long Strangle on Gold Futures
Here's how the trade comes together:
Strategy: Long Strangle using Gold Futures options
Direction: Non-directional
Instruments:
Buy 3440 Call (Oct 28)
Buy 3345 Put (Oct 28)
Premium Paid: $173.73 (per full-size GC contract)
Max Risk: Limited to premium paid
Breakeven Points on Expiration:
Upper Breakeven: 3440 + 1.7373 = 3613.73
Lower Breakeven: 3345 – 1.7373 = 3171.27
Reward Potential: Unlimited above breakeven on the upside, substantial below breakeven on the downside
R/R Profile: Defined risk, asymmetric potential reward
This setup thrives on movement. Whether Gold rallies or plunges, the trader benefits if price breaks and sustains beyond breakeven levels by expiration.
Risk Management Matters More Than Ever
The strength of a Long Strangle lies in its predefined risk and unlimited reward potential, but that doesn’t mean the position is immune to pitfalls. Movement is key — and time decay (theta) begins to erode the premium paid with each passing day.
Here are a few key considerations:
Stop-loss is optional, as max loss is predefined.
Precise entry timing increases the likelihood of capturing breakout moves before theta becomes too damaging. Same for exit.
Strike selection should always balance affordability and distance to breakeven.
Avoid overexposure, especially in low volatility environments that can lull traders into overtrading due to the potentially “cheap” options.
Using strategies like this within a broader portfolio should always come with well-structured risk limits and position sizing protocols.
When charting futures, the data provided could be delayed. Traders working with the ticker symbols discussed in this idea may prefer to use CME Group real-time data plan on TradingView: tradingview.sweetlogin.com - This consideration is particularly important for shorter-term traders, whereas it may be less critical for those focused on longer-term trading strategies.
General Disclaimer:
The trade ideas presented herein are solely for illustrative purposes forming a part of a case study intended to demonstrate key principles in risk management within the context of the specific market scenarios discussed. These ideas are not to be interpreted as investment recommendations or financial advice. They do not endorse or promote any specific trading strategies, financial products, or services. The information provided is based on data believed to be reliable; however, its accuracy or completeness cannot be guaranteed. Trading in financial markets involves risks, including the potential loss of principal. Each individual should conduct their own research and consult with professional financial advisors before making any investment decisions. The author or publisher of this content bears no responsibility for any actions taken based on the information provided or for any resultant financial or other losses.
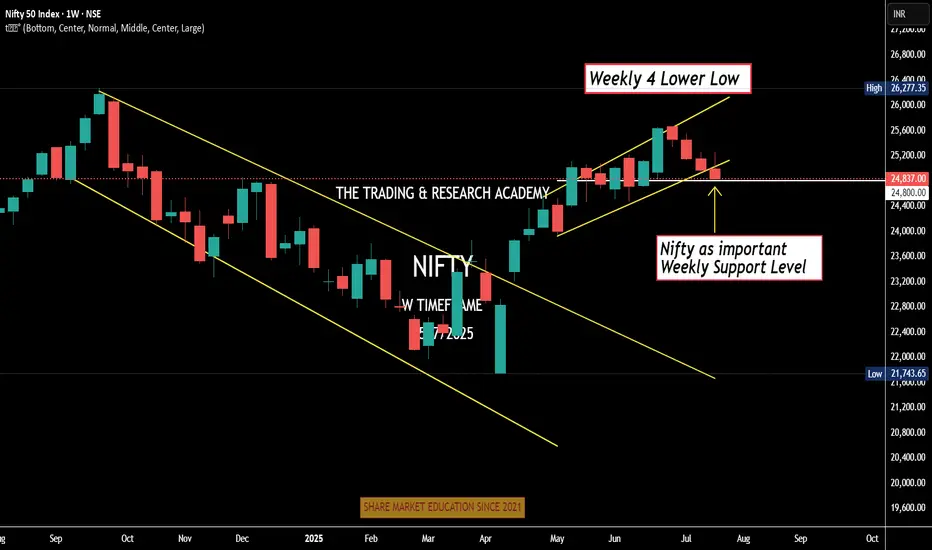
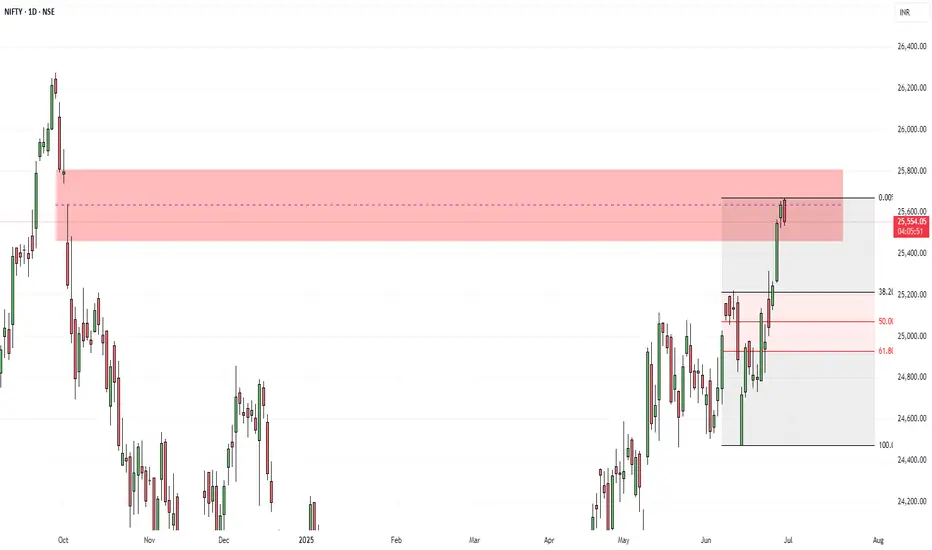
Weekly Nifty Analysis Next week, can we have a small bounce in #Nifty?
4 Lower Low
Daily channel Breakdown
Index at crucial weekly support level
Can one bullish week / Doji be expected. One news here or there & boom!
We have monthly expiry this week, let's see.
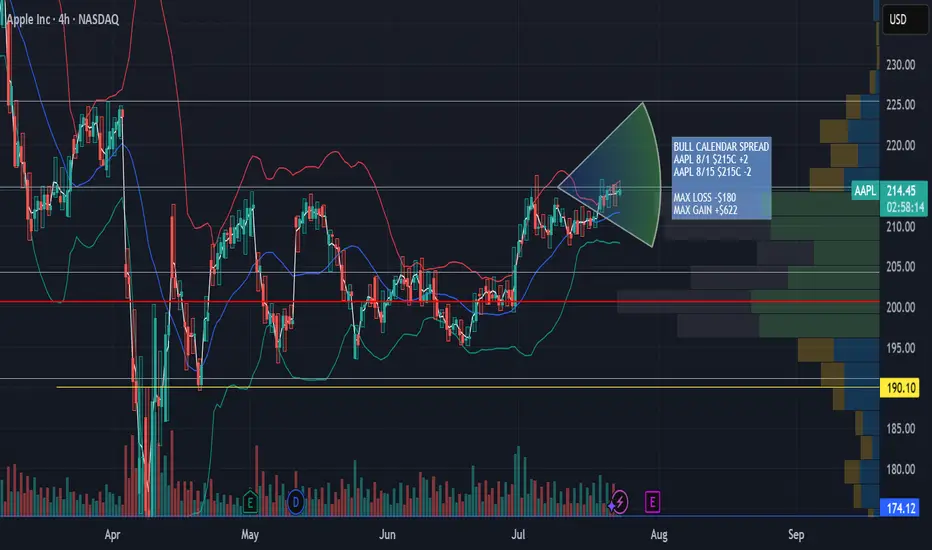
AAPL Aug 1st - Aug 8th 215 Calendar Call SpreadAAPL Aug 1st - Aug 8th 215 Calendar Call Spread
AAPL earnings after market close 7/31/25. Looking for an upward move into earnings with resistance at $225 then retesting support at $215. This zone falls between the .5 and .618 fib retracement. Great risk/ reward ratio 3.5:1
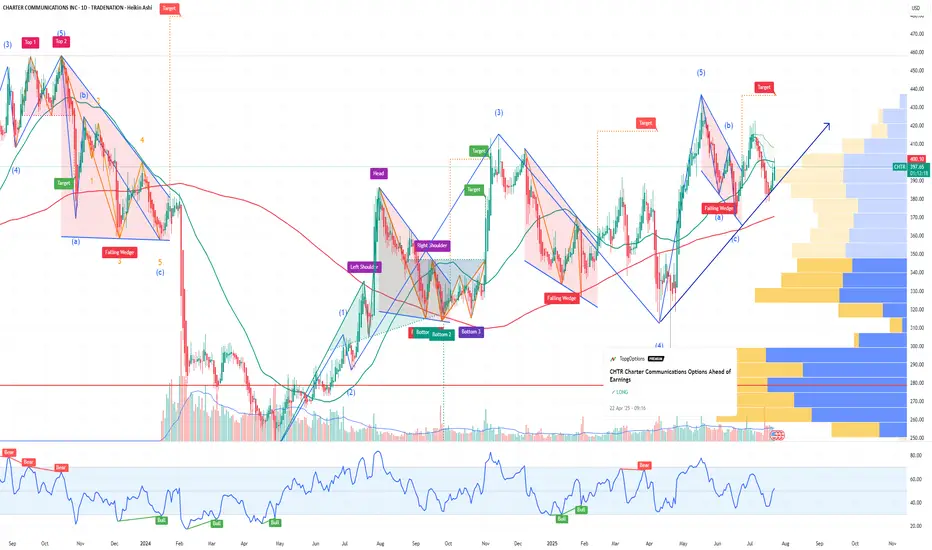
CHTR Charter Communications Options Ahead of EarningsIf you haven`t bought CHTR before the previous earnings:
Now analyzing the options chain and the chart patterns of CHTR Charter Communications prior to the earnings report this week,
I would consider purchasing the 387.5usd strike price Calls with
an expiration date of 2025-7-25,
for a premium of approximately $22.55.
If these options prove to be profitable prior to the earnings release, I would sell at least half of them.
Disclosure: I am part of Trade Nation's Influencer program and receive a monthly fee for using their TradingView charts in my analysis.
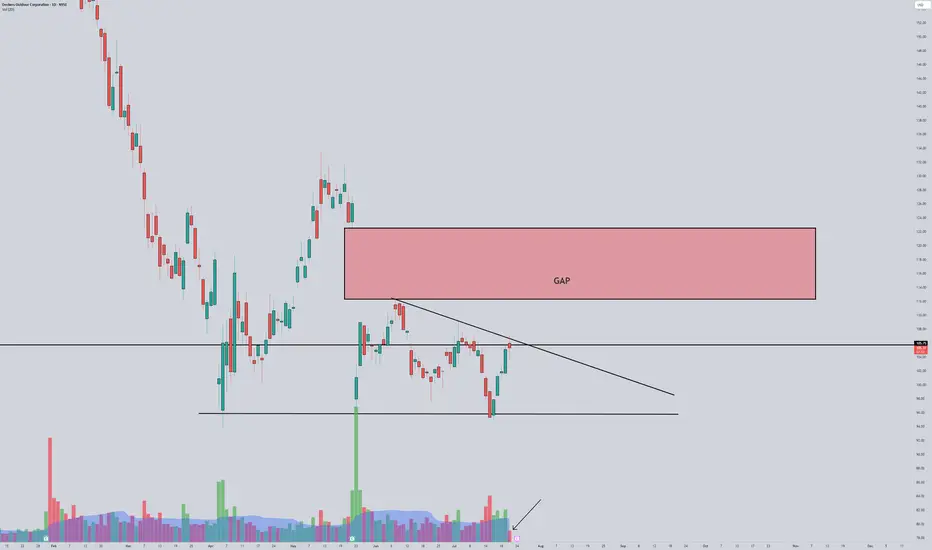
Intriguing setupOn 7/21 a OTM call flow came in for 114c expiring this Friday July 25th
Almost $130k in calls on a strike that has very low OI.
We have a beautiful gap above and a possible flag break in very low volume today.
Also, ER on thursday.
Do they know something??
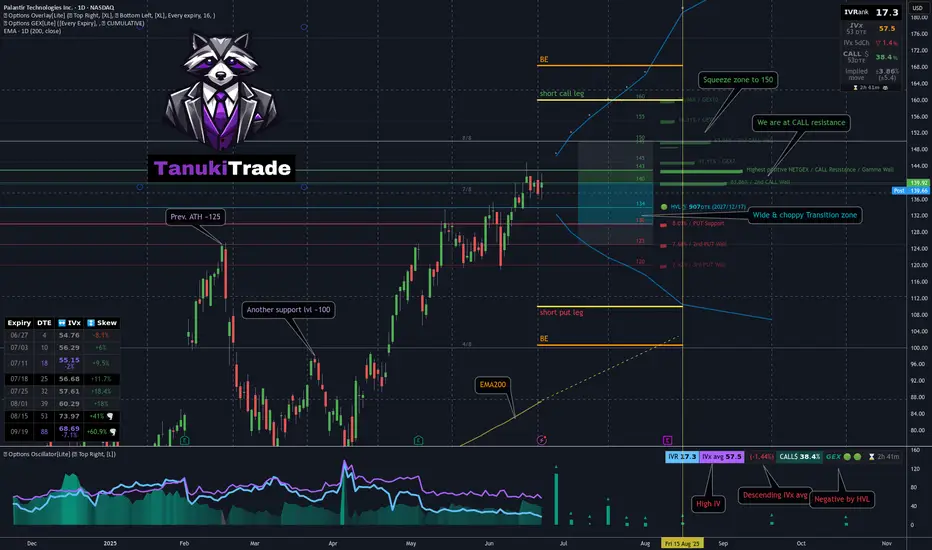
Jade Lizard on PLTR - My 53DTE Summer Theta PlayMany of you — and yes, I see you in my DMs 😄 — are trading PLTR, whether using LEAPS, wheeling, or covered calls.
I took a closer look. And guess what?
📈 After a strong move higher, PLTR was rejected right at the $143 call wall — pretty much all cumulative expiries cluster resistance there
Using the GEX Profile indicator, scanning all expirations:
After a brief dip, the market is repositioning bullish
Squeeze zone extends up to 150
The most distant GEX level is sitting at 160
On the downside, 130 is firm support, with some presence even at 120 — the market isn’t pricing in much risk below that
📉 From a technical standpoint:
We’re near all-time highs
125 (previous ATH) and 100 are key support levels
The OTM delta curve through August is wide, and the call side is paying well — with a current call pricing skew
🔬 IVx is at 57, trending lower + call pricing skew📉 IV Rank isn't particularly high, but the directional IVx matters more here
💡 Summer Theta Play: Jade Lizard on PLTR
Since I’ll be traveling this summer and don’t want to micromanage trades, I looked for something low-touch and high-confidence — and revisited an old favorite: the Jade Lizard.
If you're not familiar with the strategy, I recommend checking out Tastytrade's links and videos on Jade Lizards.
🔹 Why this setup?
Breakeven sits near $100, even with no management
On TastyTrade margin:~$1800 initial margin ~$830 max profit
53 DTE — plenty of time for theta to work
Earnings hit in August — I plan to close before then
Covers all bullish GEX resistance zones
Quickly turns profitable if IV doesn’t spike
Highly adjustable if needed
My conclusion: this strategy covers a much broader range than what the current GEX Profile shows across all expirations — so by my standards, I consider this to be a relatively lower-risk setup compared to most other symbols right now with similar theta strategies.
🔧 How would I adjust if needed?
If price moves up:
I’d roll the short put up to collect additional credit
Hold the call vertical as long as the curve supports it
If price drops:
Transition into a put ratio spread
Either extend or remove the call vertical depending on conditions
🛑 What’s the cut loss plan?
I have about 20% wiggle room on the upside, so I’m not too worried — but if price rips through 160 quickly, I’ll have to consider early closure.
If that happens, the decision depends on time:
If late in the cycle with low DTE:→ Take a small loss & roll out to next month for credit
If early with lots of DTE remaining:→ Consider converting to a butterfly, pushing out the call vertical for a small debit→ Offset this with credit from rolling the put upward
As always — stay sharp, manage your risk, and may the profit be with you.
See you next week!– Greg @ TanukiTrade
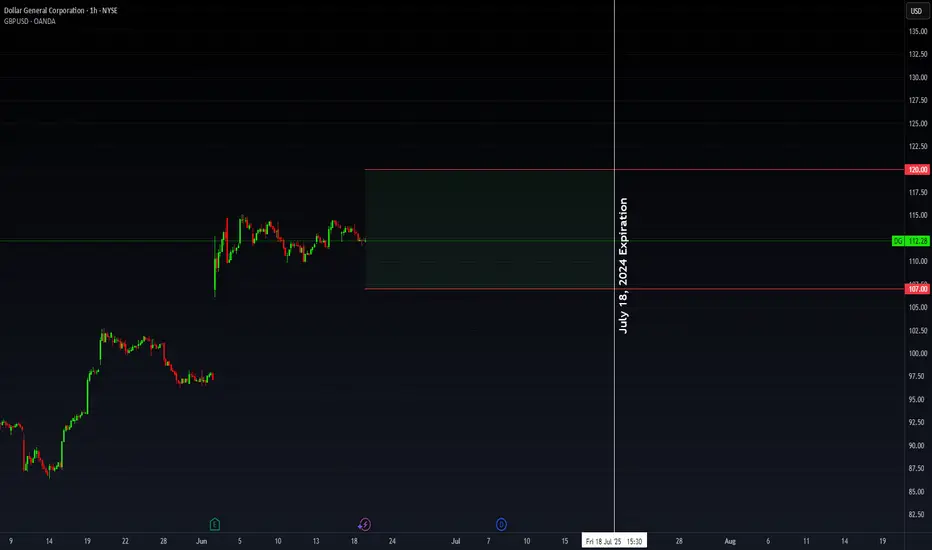
DG Trading Setup: Capitalizing on RangeDollar General has experienced a stabilization phase following its Q1 2025 results, with same-store sales increasing 2.4% and revenue growing 5.3% to $10.4 billion. The company has regained traction in the discount retail space, mitigating previous challenges related to shrink and operational inefficiencies.
Institutional Flow & Market Positioning
Recent institutional flow highlights large orders in DG’s 115 call and 110 put, signaling either:
- A range-bound setup, where smart money expects the stock to stay between $110-$115 in the near term.
- Potential volatility, with institutions hedging both directions ahead of an unexpected move.
Considering the ATR (18) and standard deviation (7.353), this aligns with a low-breakout probability, making range-based strategies the optimal play. The absence of earnings between now and July further supports sideways movement expectations.
Options Trade Setup: Iron Condor
To capitalize on premium decay and IV contraction, I’m structuring an iron condor:
- Sell 115 Call / Buy 120 Call
- Sell 110 Put / Buy 105 Put
This strategy ensures limited risk while collecting premium in a high-probability range trade.
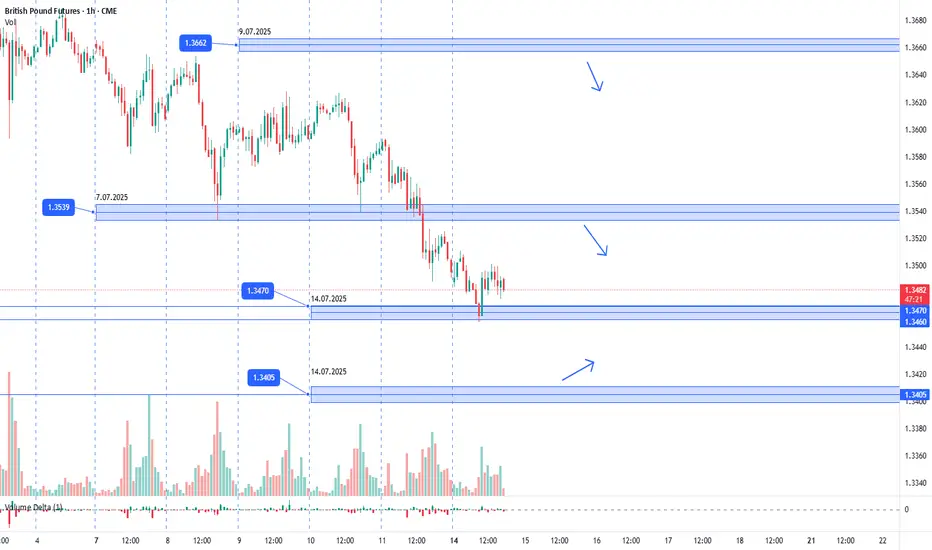
GBPUSD. 14.07.2025. The plan for the next few days.The nearest interesting resistance zone was already worked out in the morning and gave a good reaction. Let's mark the others where we can expect a reaction. It's not certain that there will be a major reversal, but I think we'll see a correction that can be monetized. We're waiting for a reaction and looking for an entry point.
The post will be adjusted based on any changes.
Don't forget to click on the Rocket! =)
XAUUSDDear traders,
In my previous analysis, I mentioned that gold could extend its short-term decline after being rejected from the range boundary. However, that bearish structure was quickly invalidated following a sharp upside move, signaling a potential trend reversal. If this momentum continues, I anticipate that price may soon reach the levels of 3,355 and 3,365.
Feel free to leave a comment if you have any thoughts to add. Good luck!

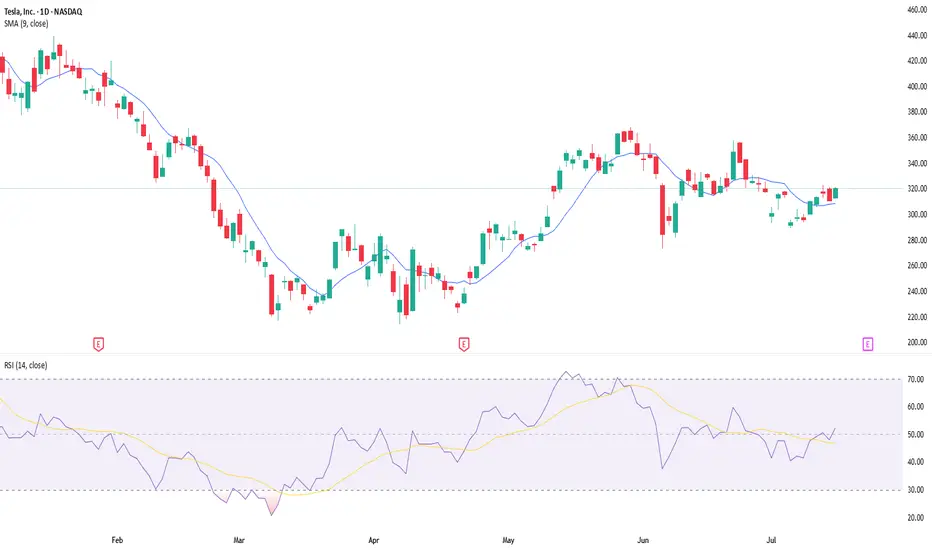
Tesla earnings setup favours upsideTesla is scheduled to report its second-quarter results on Wednesday 23 July, after the New York close of trading. The company is forecast to report revenue of $22.8bn, representing a 10.5% year-on-year decline, with earnings expected to decrease 19% to $0.34 per share. Gross profit margins are also anticipated to contract by 2.3 percentage points to 16.4%, down from 18.7% last year.
Tesla does not provide traditional guidance but instead offers a business outlook. In its first-quarter release, the company noted difficulties in assessing the impact of shifting global trade policies and stated it would revisit its 2025 guidance during the second-quarter update. Consequently, investors will undoubtedly be focused on any insights regarding 2025 delivery forecasts, especially given the weak performance in the first half of 2025.
Given the current uncertainty, the market is pricing in a 7.5% rise or fall in the shares following the earnings release. Options positioning is relatively neutral, with only a slight bullish bias. However, there is significant support for the stock between $280 and $300, marked by substantial put gamma levels. Conversely, resistance from call gamma exists between $325 and $330. This setup suggests that it could be easier for the stock to rise rather than fall following the results.
The technical chart clearly illustrates this scenario, highlighting strong support around $290 that dates back to March. More recently, the shares have encountered resistance around the $330 mark. If Tesla can successfully break above this resistance, the stock could move towards approximately $360, while downside seems limited to around $290 to $300.
Written by Michael J. Kramer, founder of Mott Capital Management.
Disclaimer: CMC Markets is an execution-only service provider. The material (whether or not it states any opinions) is for general information purposes only and does not take into account your personal circumstances or objectives. Nothing in this material is (or should be considered to be) financial, investment or other advice on which reliance should be placed.
No opinion given in the material constitutes a recommendation by CMC Markets or the author that any particular investment, security, transaction, or investment strategy is suitable for any specific person. The material has not been prepared in accordance with legal requirements designed to promote the independence of investment research. Although we are not specifically prevented from dealing before providing this material, we do not seek to take advantage of the material prior to its dissemination.
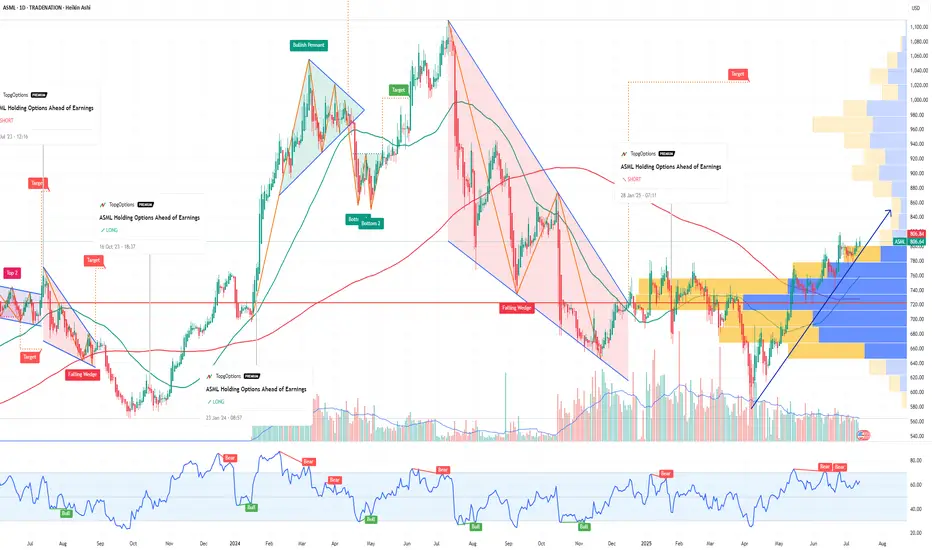
ASML Holding Options Ahead of EarningsIf you haven`t bought the dip on ASML:
Now analyzing the options chain and the chart patterns of ASML Holding prior to the earnings report this week,
I would consider purchasing the 800usd strike price Calls with
an expiration date of 2025-7-25,
for a premium of approximately $32.00.
If these options prove to be profitable prior to the earnings release, I would sell at least half of them.
Disclosure: I am part of Trade Nation's Influencer program and receive a monthly fee for using their TradingView charts in my analysis.
MP Materials Options Ahead of EarningsIf you haven`t bought MP before the previuos earnings:
Now analyzing the options chain and the chart patterns of MP Materials prior to the earnings report this week,
I would consider purchasing the 25usd strike price Calls with
an expiration date of 2025-6-20,
for a premium of approximately $2.97.
If these options prove to be profitable prior to the earnings release, I would sell at least half of them.

Carvana Leading Auto Retail – Outpacing LAD & AN-Financial Performance & Momentum:
Carvana reported a record-breaking adjusted EBITDA of $488M in Q1 2025, up $253M YoY, with an EBITDA margin of 11.5% (+3.8pp YoY). The company's strong operational efficiency positions it as a leader in the auto retail industry, nearly doubling the margins of competitors like Lithia Motors (LAD) and AutoNation (AN).
- Competitive Positioning & Growth Outlook:
Carvana’s EBITDA quality is superior due to lower non-cash expenses, enhancing long-term sustainability. The company expects sequential EBITDA growth in Q2 and targets 13.5% EBITDA margins within 5-10 years.
-Peer Comparison:
- Lithia Motors (LAD): EBITDA margin at 4.4% (up from 4% YoY), facing tariff-related headwinds that could impact pricing and demand.
- AutoNation (AN): SG&A as a percentage of gross profit rose to 67.5% in Q1, expected to stay between 66-67% in FY 2025, pressuring margins further.
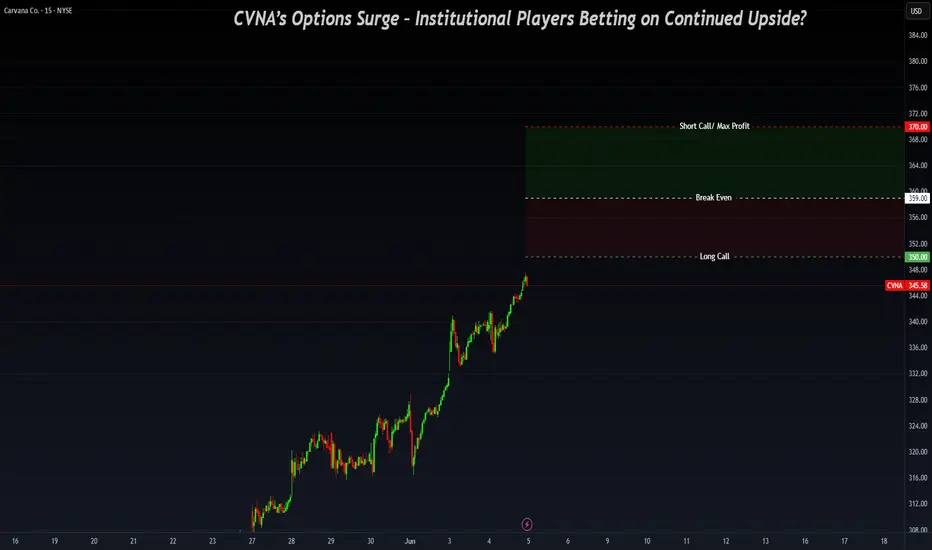
-Options Flow & Institutional Activity - Key Levels: $350/$370
Recent institutional flow activity indicates strong positioning around $350/$370 strikes, potentially signaling a vertical spread in play rather than outright selling:
1️⃣ Momentum Confirmation:
- CVNA has strong upside momentum following its Q1 results, reinforcing a bullish outlook for near-term price action.
- Institutional traders may be accumulating bullish vertical spreads rather than unwinding positions.
Vertical Spread Setup ($350/$370 Strikes)
- Long Call ($350 Strike) → Signals expectations for further upside.
- Short Call ($370 Strike) → Caps max profit while reducing cost.
- Breakeven Price: $359 → CVNA must close above $359 for profitability.
Profit & Risk Zones
- Above $370: Maximum profit achieved.
- Between $359-$370: Partial profit zone (spread remains in play).
- Below $359: Spread loses value, making recovery dependent on extended upside momentum.
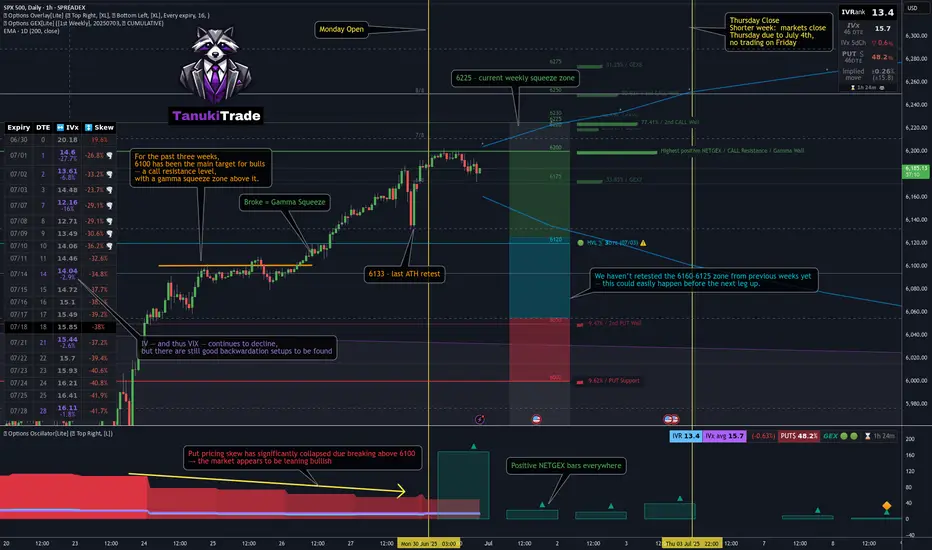
06/30 Weekly Gamma Exposure Outlook🧠 SPX Weekly Outlook — Gamma Breakout + Short Week Setup
The bulls finally broke through after weeks of painful grinding — and they did so with force.
📈 Thursday & Friday brought a textbook gamma squeeze as SPX sliced through the long-standing 6100 call wall , triggering sharp upside acceleration.
We are now firmly in positive Net GEX territory.
🔺 Entire GEX structure has shifted higher.
🎯 New squeeze zone at 6225 , with major call resistance near 6200 .
🔍 What Just Happened?
📊 The 6060–6120 zone acted as a tough resistance range for weeks — until last week’s breakout.
💥 Put skew collapsed , suggesting downside hedges are being unwound.
📉 VIX and IV keep dropping , confirming a shift toward lower-volatility environment .
🧲 Strong Net GEX across expiries created sustained upward dealer pressure → we’re in long gamma mode .
✅ Bullish Bias — But Stay Tactical
We're in a bullish gamma regime , so dips are likely to be bought.
Key pullback zone to watch: 6125–6060 .
🛠️ Strategy Ideas:
• Wait for a 6060–6125 retest before re-entering longs
• Use shorter-DTE bull put spreads or 0DTE gamma scalps above 6130+
• Scale out or trim risk near 6200–6225
⚠️ Risks to Watch
We’re overextended short-term.
🚨 Losing 6130–6125 could spark a quick flush to 6050 .
Bearish signals to monitor:
• IV spike or renewed put buying
• Loss of 6100 = no-man’s land without confirmation
• Consider short-term debit put spreads if breakdown confirms
🗓️ Short Trading Week Note
🇺🇸 U.S. markets closed Friday, July 5 for Independence Day.
This compresses flows into 4 sessions. Expect:
📌 Early week dealer hedging
📌 Possible positioning unwind on Thursday
💡 Weekly Trade Idea — Structure in Place
💼 Setup:
• Put Butterfly below spot
• 3x Call Diagonal Spreads above spot (5pt wide)
• Slight net negative delta , 11 DTE
🎯 Why it works:
• Leverages IV backwardation
• Profits from time decay
• Favors a stable or modestly bullish week
• Takes advantage of horizontal skew (July 11 vs July 14)
💰 Profit Target: 10–20% return on ~$1,730 risk.
Take profits before time decay kills the center valley — don’t overstay. 🏃💨
📌 Final Thoughts:
The 6100 breakout was technically & gamma-structurally significant ,
but big moves often retest before continuing.
Let price breathe.
Stay aligned with gamma exposure profile. 🔄
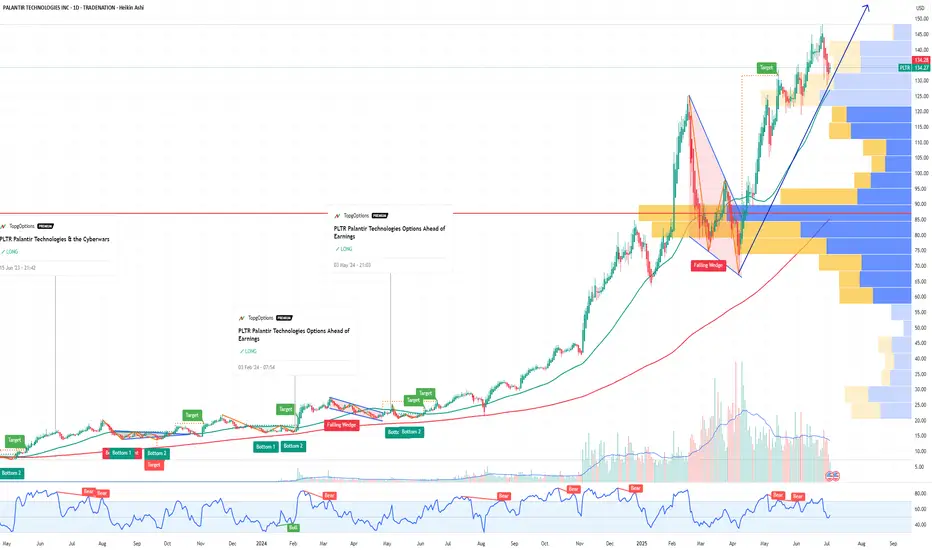
Why Palantir (PLTR) Could Be the NVDA of Government AI If you haven`t bought PLTR before the massive rally:
Palantir Technologies (PLTR) is proving it’s more than just another AI hype play — it’s becoming a core piece of the secure AI infrastructure for governments and large enterprises worldwide.
Key Bullish Arguments
1) Strong Government Moat
PLTR’s deep relationship with the U.S. government, NATO, and allies provides sticky, long-term revenue streams. In an age of geopolitical tension, this is exactly the type of mission-critical AI spending that stays funded.
2) Expanding Commercial Footprint
The commercial segment is no longer a side project. Palantir’s Foundry and Apollo platforms help enterprises deploy AI at scale — securely, in-house, and without sending sensitive data to open systems. Recent deals in healthcare, energy, and critical infrastructure show they’re broadening their customer base.
3) Profitability & Balance Sheet
Palantir is GAAP profitable for six consecutive quarters, with strong free cash flow and zero debt. For a growth stock in AI, this gives it rare staying power if macro conditions tighten.
4) Technical Strength
The stock broke out above ~$125–$130 support and is now testing key resistance in the $140–$148 range. Weekly momentum remains bullish, and institutional accumulation (A/D line) remains strong.
5) AI Tailwinds Remain
While the general AI trade has cooled for some names, PLTR’s unique moat in secure and domain-specific AI makes it more defensible than generic “AI SaaS” stocks. New contracts or AI platform updates could reignite momentum this summer.
Possible Summer Catalysts
New multi-year government deals — especially in defense and cybersecurity.
Major commercial partnerships — especially in healthcare or energy.
AI platform upgrades — more integrations with LLMs or domain-specific AI.
Inclusion in AI-focused ETFs — or further index rebalancing inflows.
Disclosure: I am part of Trade Nation's Influencer program and receive a monthly fee for using their TradingView charts in my analysis.
$META Chart updateNASDAQ:META just took out ATHs here's an update on my path tp $750, and possibily higher.

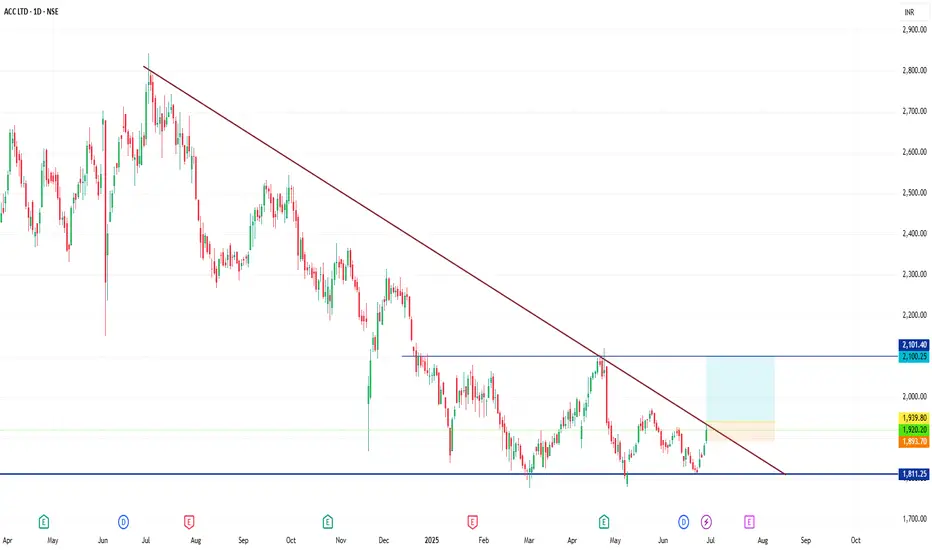
Nifty is Bearish for next week. But Why ? "Ask me in comments".Nifty is facing resistance at this level for a specific reason. this week it can be bearish and continue to go down side.
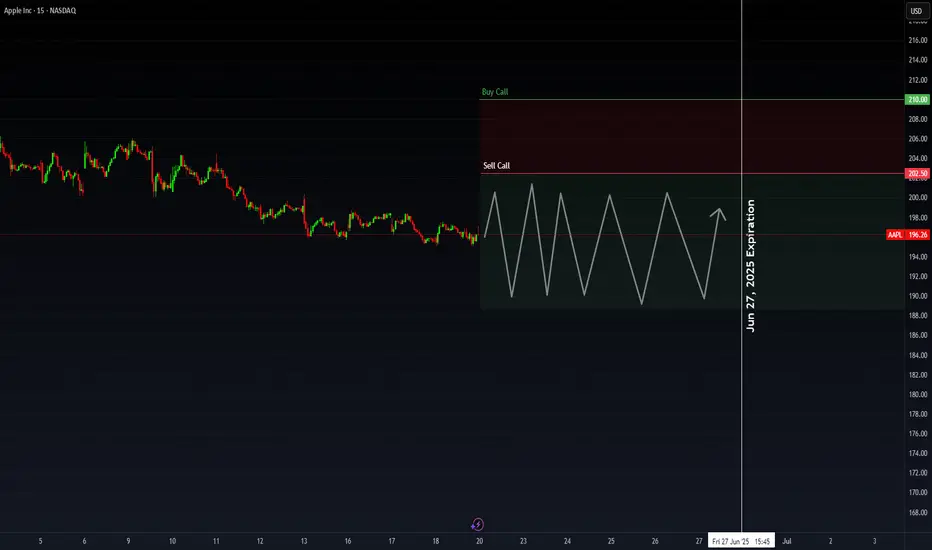
AAPL: Premium PlayApple beat expectations this quarter—revenue, profit, EPS—all slightly better than analysts hoped. But the stock dropped to $196.26, down from $212.83. Why? Investors are still worried about tariffs, margin pressure, and supply chain changes.
Tim Cook talked about strong product sales (iPhone, Mac, iPad) and all-time high Services revenue. But he also admitted tariffs and regulatory issues are weighing on Apple’s outlook.
My Covered Call Strategy
I’m selling the $202.5 call and buying the $210 call for June 27, 2025. Big money seems to be doing the same—there was a huge premium sale over $2 million, likely betting Apple stays range-bound short term.
- Why this works:
- Resistance near $202.50 gives me a clear ceiling
- Apple fundamentals are strong, but macro risk caps upside
Chart Notes
- Resistance: $202.50 and $210
- Support: Around $192.50
Bottom line:
I like this trade as a way to bring in income while defining my risk. If Apple grinds sideways or pushes a bit higher, the trade still pays. Clean structure, high odds.
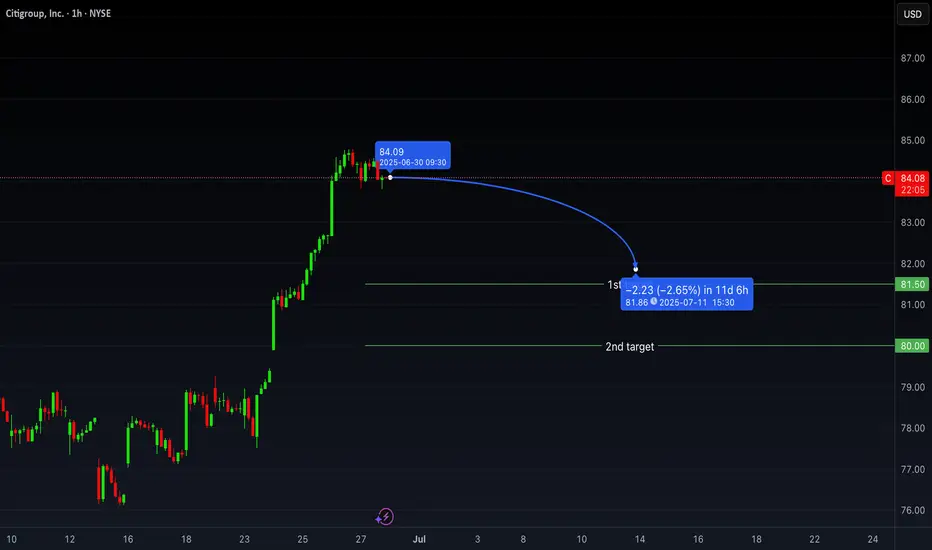
Watching for Pullback Below $84 in Citigroup (C)Over the past month, Citigroup shares have appreciated 8.58%, outperforming both the Finance sector's 1.91% gain and the S&P 500's 3.92% increase. This relative outperformance may signal strength, but short-term positioning and market structure suggest a potential shift.
Expecting a Sharp Move Below $84 – Option Flow Insight
Despite the recent strength, I anticipate a significant downward move below the $84 level in the upcoming week. This expectation is based on notable option activity detected in the Times & Sales feed, specifically large put orders suggesting bearish positioning.
In response to this setup, I plan to execute a bearish vertical spread, specifically:
Buying the $84 puts
Selling the $80 puts
This strategy limits downside risk while still profiting from a potential retracement.
Fundamental Picture Ahead of Earnings
Citigroup's next earnings release is scheduled for July 15, 2025. The company is expected to report:
EPS of $1.70 (+11.84% YoY)
Revenue of $20.85B (+3.51% YoY)
For the full year, the Zacks Consensus Estimate forecasts:
EPS of $7.38 (+24.03%)
Revenue of $83.84B (+3.33%)
While these figures suggest healthy growth, it's important to note that recent analyst estimate revisions have been modestly negative, with the EPS estimate decreasing 0.27% over the last 30 days. Citigroup currently holds a Zacks Rank #3 (Hold), reflecting a neutral sentiment from analysts.
Valuation Metrics
From a valuation standpoint:
Forward P/E: 10.75, notably below the industry average of 15.02
PEG ratio: 0.61, versus the industry average of 1.26
This indicates that Citigroup is undervalued relative to its peers, especially when considering growth prospects, which could provide some support. However, short-term bearish flows may dominate price action heading into earnings.
Industry Outlook
The Financial - Investment Bank industry, which includes Citigroup, currently has a Zacks Industry Rank of 96, placing it in the top 40% of over 250 industry groups. Historically, industries in the top half outperform those in the bottom half by a factor of 2 to 1.
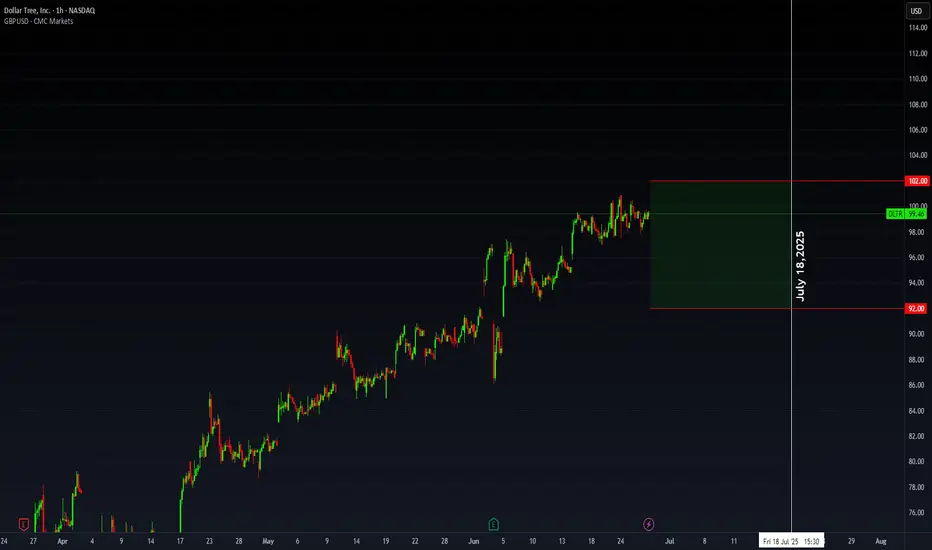
DLTR: Range + Flow SetupDLTR – Trading Within Range Amid Strategic Evolution & Flow Anomalies
Dollar Tree (DLTR) continues to show strength post–Q1 FY2025 earnings, breaking higher as it pushes through its multi-price format transition and nears the Family Dollar divestiture. The stock is outperforming key peers (DG, TJX, COST) and trading above both the 50- and 200-day MAs — a signal of growing institutional confidence.
On the fundamentals: Net sales (ex-Family Dollar) jumped 11.3% to $4.64B, comps grew 5.4%, and gross margin expanded to 35.6% despite transitional headwinds. Full-year EPS was guided up to $5.15–$5.65, reflecting management’s conviction in sustained growth. Analysts responded by revising EPS to $6.12 (+13.5% YoY), validating the turnaround thesis.
Valuation-wise, DLTR remains notably underpriced. It’s trading at 16.66x forward earnings — well below the retail average and far cheaper than peers like COST (51.1x), TJX (26.9x), and DG (19.0x). The gap is especially compelling given DLTR’s momentum and shift toward higher-margin discretionary sales via the “3.0” format.
Unusual Activity Insight:
What caught my attention was a cluster of unusual options activity suggesting a short-term strangle strategy centered around the July 18 expiration — likely positioning for the stock to stay range-bound while capturing premium from elevated IV post-earnings. The structure and OI shifts imply smart money is playing both ends of the current price band.
Trading Range and Setup:
DLTR has been respecting a range between $92 and $102, consolidating after its post-earnings move. That behavior, combined with the flow signals, sets the stage perfectly for a defined-risk premium play.
My Approach: Iron Condor (July 18 Expiration)
- Sell 100 Call / Buy 105 Call
- Sell 95 Put / Buy 90 Put
This iron condor aligns with the projected range, offering attractive premium while keeping defined exposure. With theta working in our favor and volatility elevated, it’s a setup that thrives in quiet bullish chop — exactly what we’ve seen since the Q1 breakout