GBPUSD. Weekly trading levels 14 - 18.04.2025During the week you can trade from these price levels. Finding the entry point into a transaction and its support is up to you, depending on your trading style and the development of the situation. Zones show preferred price ranges WHERE to look for an entry point into a trade.
If you expect any medium-term price movements, then most likely they will start from one of the zones.
Levels are valid for a week, the date is in the title. Next week I will adjust the levels based on new data and publish a new post.
! Please note that brokers have a difference in quotes, take this into account when trading.
The history of level development can be seen in my previous posts. They cannot be edited or deleted. Everything is fair. :)
----------------------------------------------
I don’t play guess the direction (that’s why there are no directional arrows), but zones (levels) are used for trading. We wait for the zone to approach, watch the reaction, and enter the trade.
Levels are drawn based on volumes and data from the CME. They are used as areas of interest for trading. Traded as classic support/resistance levels. We see the reaction to the rebound, we trade the rebound. We see a breakout and continue to trade on a rollback to the level. The worst option is if we revolve around the zone in a flat.
Do not reverse the market at every level; if there is a trend movement, consider it as an opportunity to continue the movement. Until the price has drawn a reversal pattern.
More information in my RU profile.
Don't forget to like Rocket and Subscribe!!! Feedback is very important to me!
Optionstrading

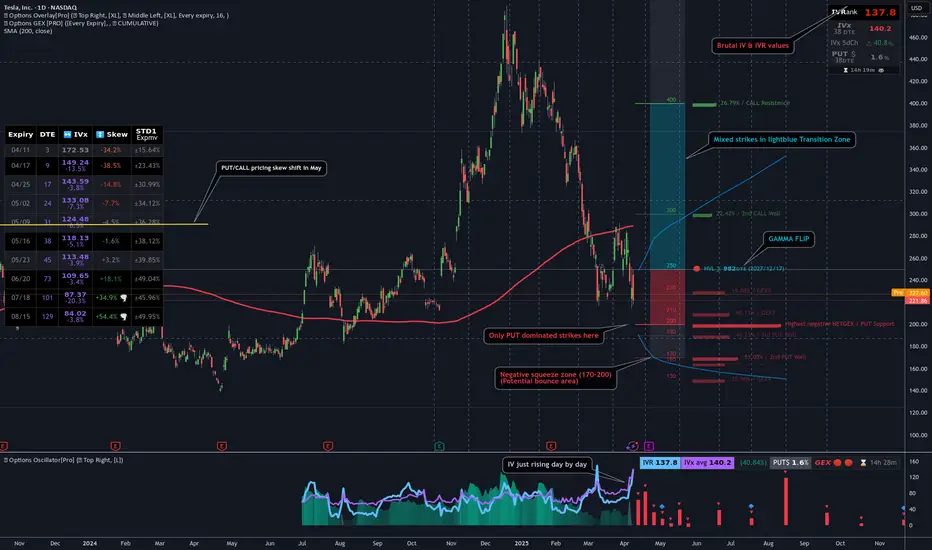
GEX Analysis & Options “Game Plan”🔶 Short- and longer-term perspective in a high IV, negative GEX environment
🔶 KEY LEVELS & RANGES
Spot: 221
Gamma Flip / Transition: around 250 (the turquoise zone on the chart)
– This zone typically marks a “power shift.” If price decisively breaks above 250 and holds, market makers’ gamma positioning could flip from neutral/negative to positive.
Put Support: 200
– A large negative gamma position has accumulated here, making 200 a strong support level. If it breaks, the downside may accelerate.
Call Resistance: 400
– A major long-term “call wall” where a significant amount of OTM calls are concentrated. It’s more relevant to LEAPS; currently far from spot, so not a realistic short-term target.
Call Resistance #2: 300
– A medium-term bullish objective, still above the 200-day MA. You’d need to be strongly bullish to aim for ~300 by May (e.g., going for a 16-delta OTM call).
Short-Term / Intermediate GEX Levels:
– There are gamma clusters around 220–230 and 250–260 . These areas often see higher volatility, possible bounces, or stalls (chop) due to hedging flows.
🔶 WHATEVER SCENARIO – SHORT TERM (0–30 DAYS)
A) Upside Continuation / Rebound
– If TSLA closes above 225–230 , the next target is 240–250 (transition / gamma flip).
– If it breaks above 250 and holds (e.g., successful retest), market makers may shift to “long gamma,” fueling a quicker move to 260–270 .
– Resistance: 250, 300, with an extreme LEAPS-level at 400.
B) Downside Move / Bearish Break
– If price dips below ~220 and sustains, the next targets are 210–200 (major put wall / negative gamma).
– If 200 fails, negative gamma may magnify the sell-off. It’s an extreme scenario but still on the table given high IV and macro/geopolitical risks.
– Support: 210, 200 — likely stronger buying interest near 200, possibly a short-term bounce.
– The options chain suggests near-term hedging via puts for this scenario.
C) Chop / Sideways
– If TSLA stays in 210–230 , market makers (short options) might benefit from high IV/time decay.
– Negative GEX, however, can trigger sudden moves in either direction; caution is advised.
🔶 LONGER-TERM FOCUS (6–12 MONTHS, LEAPS)
NET GEX = -61.97M (negative territory) suggests longer-dated positioning is also put-heavy or carries notable negative gamma.
HVL / pTrans = 250 is a key pivot; cTrans+ = 400 is distant call resistance. Between these levels, there’s a mix of put/call dominance.
If Tesla undergoes a fresh growth phase (AI, robotaxi, energy storage, etc.) and clears 250/300 , 400 could become the next significant call wall — but that’s more of a multi-month horizon.
🔶 STRATEGY IDEAS (High IV Environment)
1. Short-Term Bearish
– If you’re bearish and expecting TSLA to test 220–210, consider a bear put spread or net credit put butterfly (lower debit) to leverage high IV.
– Targeting 200, but keep in mind negative gamma may accelerate downside movement.
2. Medium-Term “Contra” Bullish (bounce to 250)
– If GEX suggests a bounce off 210–220, consider a bull call spread (e.g., 220/240) or a net debit call butterfly (220/240/250).
– Be mindful of sudden swings, as we remain in negative gamma territory.
3. Longer-Term Bullish (>3–6 months)
– A call butterfly with upper strikes around 300–350 offers capped debit and higher potential payoff if a bigger rally materializes.
– A diagonal spread (selling nearer-dated calls, buying further-out calls) exploits elevated front-end IV.
4. Neutral / Range-Bound
– If TSLA stays in 200–250 , you could use Iron Condors (e.g., 200/260) to benefit from time decay and any IV collapse.
– Exercise caution: negative gamma can generate abrupt, directional moves, making a neutral stance riskier than usual.
🔶 ADDITIONAL NOTES & “BIG PICTURE”
High IV & Negative GEX: TSLA has a track record of large swings. Negative GEX can intensify sell-offs, while forced hedging might trigger rapid rebounds.
Preferred Structures: With expensive premiums, spreads (vertical, diagonal) and butterfly configurations generally fare better than plain long options (less vulnerable to time decay).
Potential Catalysts: AI announcements, Autopilot breakthroughs, new product lines, and macro changes can swiftly alter market dynamics. Keep tracking GEX updates and news flow; TSLA tends to respond dramatically to fresh developments.
🔶 Bottom line: From 221 spot, watch 210–200 on the downside and 240–250 on the upside short term. Medium-term bullish target = 300 , while 400 remains a far LEAPS scenario. High IV + negative gamma = fast, potentially volatile moves — so risk management and spread-based approaches are crucial.
04/07 GEX + Historic VIX Highs: Extreme Volatility with OptionsWow, where to begin? We’ve just come through a week that even the most thorough analysts found surprising.
Last Friday’s brutal sell-off triggered such a massive margin call rally that even the hedge funds were forced to exit gold—which is usually considered a safe haven—on Friday.
The VIX is at a historic high — no joke. We last saw levels like this during the 2008 crisis and the COVID panic in 2020.
📌 High IV = High Theta
When implied volatility (IV) is high, theta (the time decay of options) is also high. This means that maintaining long put protection becomes extremely expensive. From a broker’s hedging perspective, if they are short expensive put options, they can gradually buy back their futures positions over time (all else being equal). As IV rises, this buyback becomes increasingly attractive for them.
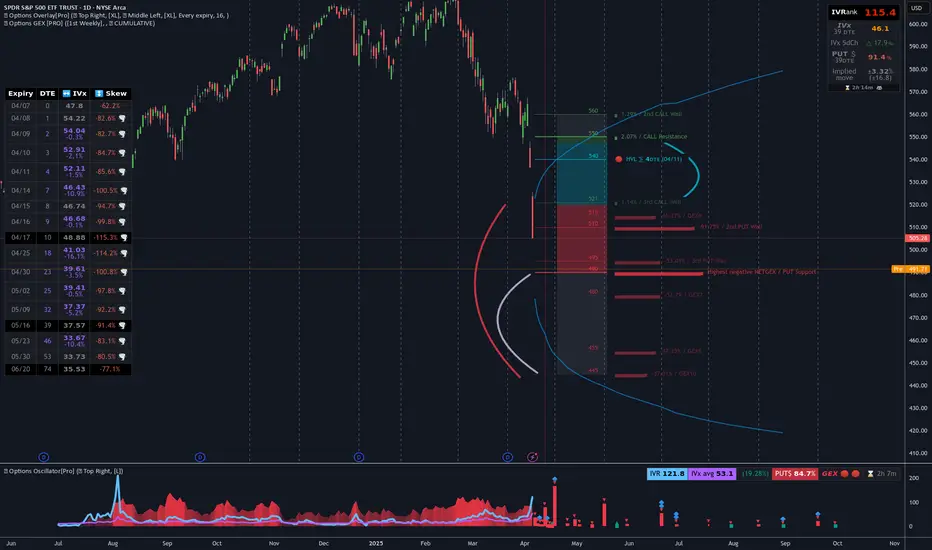
Let’s look at our weekly SPY analysis using GEX Profile (Gamma Exposure) indicator first:
It’s definitely not a cheerful chart!
* Below 520: We have strikes dominated by puts. The largest negative GEX “profit-taking zone” sits at 490. If price reaches that level and the support fails (the previous major bottom from April 2024), we could move even further down into a very wide negative squeeze zone, possibly as far as 445.
* HVL zone: 520–546: A choppy area around the gamma flip.
* Above 546: This would signal a +10-15% rally, putting us in a positive gamma zone. However, such a scenario currently seems unlikely—at least based on the gamma levels we see right now.
I won’t sugarcoat it: we’re at levels now where the market could easily move 10% in either direction. So, in my view, forget about conservative option strategies with flat delta exposure.
🤔 What Can We Do?
Important: This analysis reflects my personal opinion only. It’s primarily for those looking to speculate in this highly uncertain environment. If you’re holding put options strictly as a hedge, then this may not be directly relevant to you. In these conditions, the number one rule is to survive—hedges are meant to protect assets or guard against margin calls, not to make profit.
Currently, IV (implied volatility) and VIX are at historic highs. For them to stay this elevated, we’d need new negative headlines and further major market drops. While that could certainly happen, statistically it becomes less and less likely as time goes on.
Buying Put Options …. no way?
First off, there are plenty of challenges if you plan to buy put options right now—most of all their cost. Put options are nearly twice as expensive as calls in many cases.
Does this mean I recommend selling puts or put spreads? I’m not saying you shouldn’t, but be aware: this isn’t for the faint-hearted or for beginners (the risk is high!). It might be worth exploring butterfly or vertical debit spread strategies, as our goal remains the same as always: to maximize the risk–reward ratio.
🐂 If You’re Bullish
This might sound like a ninja move, but one possibility is to buy call butterfly spreads. Yes, the market could still drop—that’s absolutely possible. But statistically, it’s becoming less likely that we’ll see another huge leg down without some form of rebound.
- Slight Move Up: In the event of a mild rise, call spreads and call butterfly strategies can significantly outperform a simple long call. The short legs in a spread/fly offset high theta costs and mitigate the negative effects of falling IV.
- Even with a +10% Move: A long call is often still not the best choice in this environment—even if the option goes deep in the money.
Where Call Spread/Butterfly Can Fail
If stocks rally 15–20% or more and IV also increases (which would be unprecedented in just a few days).
If the market crashes and VIX spikes above 100 (IV would skyrocket, raising the cost of all options further).
Cheap Bullish Calendar Spread
In a situation like this, even a cheap calendar spread can be a good play — the risk is relatively low, especially if managed well and the breakeven range is wide. Of course, if implied volatility drops, the spread could narrow, but that would likely come with a market rally, which theta can help capitalize on.
🐻 If You’re Bearish
I strongly advise against buying single-leg puts, even on a 0DTE (zero-days-to-expiration) basis. If you’re convinced the market will keep dropping, I’d only consider debit spreads, aiming for a solid risk–reward ratio (in my case, I look for at least 1:2 risk-to-reward).
⚖️ If You Want to Stay Neutral / Omni bullish
If you prefer not to pick a direction, you could try to capitalize on historically high IV with a May-expiration Iron Condor. This is the classic TastyTrade approach, with the caveat that you must monitor GEX levels and IV daily and adjust the far side as needed.
Risk Management: If the spot price threatens one of your short strikes, you probably shouldn’t wait around in this volatile environment. It’s usually better to close the position and take a small loss than to hope for a reversal—hoping can become very expensive!
Conclusion
The market is extremely volatile, and expensive options mean traditional strategies may not work as well as they usually do. Stay cautious, manage risk meticulously, and don’t be afraid to close out losing trades quickly. As always, surviving to trade another day is the most important rule.
NVIDIA Update 3 Rangebound with new Low for longsIn this video I bring to your attention what we could possibly expect if we lose the current level and if we do then where is the next crucial zone to look for Longs.
If you have read this then pls do Boost my work and any questions then leave them below

NVDA 2 The????NASDAQ:NVDA
Outlook - -GEX and -DEX but +OI This week. NASDAQ:NVDA ’s price action will likely hinge on broader
market sentiment rather than company-specific releases, given no major NVIDIA events are slated.
Weekly -- 2nd consecutive down week with increasing volume
Daily -- Downtrend to next HVL under 106 possible
Hourly -- Consolidating at support zone
10m -- Consolidating
Bias -Monitoring U.S. trade policy updates and technical levels for short-term direction.
Volatility remains high, so caution is warranted.
Pivot - 109.65
Upside Targets:
* 111.47--112.91--113.66--115.01
Downside Targets:
* 109.62--108.45--105.05--104.34

HUMA Humacyte Options Ahead of EarningsIf you haven`t bought HUMA before the previous rally:
Now analyzing the options chain and the chart patterns of HUMA Humacyte prior to the earnings report this week,
I would consider purchasing the 2.5usd strike price Puts with
an expiration date of 2025-4-17,
for a premium of approximately $0.62.
If these options prove to be profitable prior to the earnings release, I would sell at least half of them.

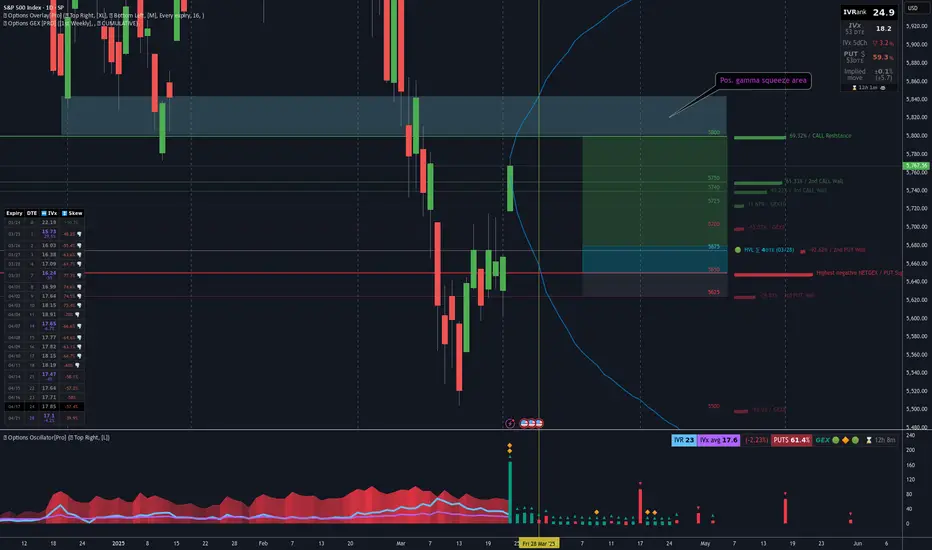
03/24 SPX Weekly GEX Outlook, Options FlowYou can see that every expiry has shifted into a stronger bullish stance heading into Friday, with GEX exposure moving upward across the board—though total net GEX is still in negative territory, while net DEX (delta exposure) is positive. This combination points toward a likely near-term rebound this week, which makes sense after testing the 5600 range last week….
Here’s a more detailed breakdown of the key zones and likely moves this week:
Bullish Target:
The current uptrend could reach 5750 on its first attempt (already reached in Monday, thx bullsh :) ). If a positive gamma squeeze emerges at that level, we might see an extension to 5800 or even 5850 as a final profit-taking zone for bulls this week.
HVL (Gamma Slip Zone):
Placed at 5680, this threshold currently supports a low-volatility environment. A drop below 5680, however, could reignite fear and fuel bearish momentum.
Put Floors & Net OI:
The largest net negative open interest (OI) cluster is at 5650, with the next key level near 5600. At 5600, net DEX reads fully positive, suggesting strong buying support if the market tests that lower boundary.
Nifty's Strong Surge: What's Next for the Market?
This week, Nifty surged to 23,350, an impressive 950-point rally from last week’s close. The index hit a high of 23,402 and a low of 22,353. As I highlighted last week, I expected Nifty to trade within a narrow range of 22,850 – 21,950. However, Nifty broke out of this range, shattering the upper limit, and the resulting short covering led to a strong bullish close.
Next Week: A Critical Turning Point
Looking ahead, next week is going to be crucial. Despite the strong move, Nifty is still in a bearish phase on both the weekly and monthly time frames. However, if Nifty manages to retrace slightly to 23,000 and sustain above the 22,900 – 23,000 range, we could see the bulls taking control, pushing the market up toward 23,800/23,850.
On the other hand, if Nifty falls below 22,800, it would signal a breakout failure, which would be bad news for the bulls. In that case, Nifty could potentially drop to 22,000.
March-End Volatility: Be Ready for Both Sides
At the end of March, traders typically start booking their losses to offset gains for the financial year, creating increased volatility. This makes it an exciting time for directional traders, as we could see sharp movements in both directions.
For me, as long as the monthly and weekly charts remain bearish, I am cautious and not ready to turn bullish just yet. However, there are some sectors showing relative strength, and these could offer trading opportunities:
Nifty Energy
Nifty Financial Services
Nifty Metal
Nifty Public Sector Enterprises (PSE)
Keep an eye on stocks from these sectors, as they are currently outperforming others.
S&P 500: Mixed Signals
On the global front, the S&P 500 closed this week at 5,667, barely 30 points above last week’s close. The index has failed to sustain above the DEMA200 level at 5,705, signaling that the bulls are struggling to maintain momentum. A consecutive daily close above this level would help restore confidence among the bulls, potentially targeting 5,850.
However, if S&P 500 drops below 5,600, we could see a faster sell-off, with the recent low of 5,500 likely to come into play. It’s going to be a tense week as we await to see whether the bulls or the bears take control.
In Summary: Prepare for Volatility
Next week promises to be an exciting week for traders, as both domestic and global markets face critical levels. Directional traders should remain flexible, prepared for sharp moves in both directions. Focus on key sectors showing strength and stay vigilant for any breakout or breakdown in the Nifty and S&P 500.

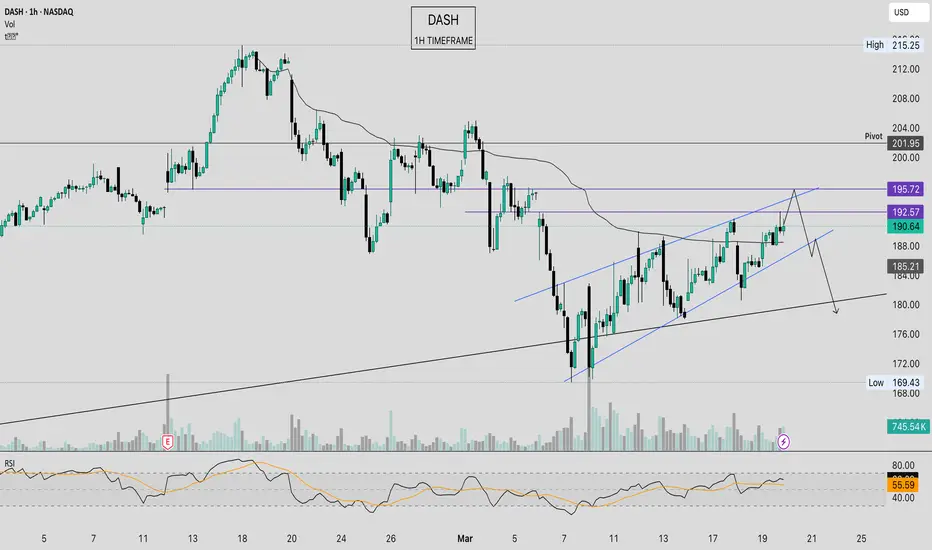
DoorDash: Is it another advantage or a liquidity trap?Reading a slightly bearish sentiment on DASH at the moment. We have the swing high anchored VWAP combined with a riding wedge. In the short term, it could potentially reach 195, potentially creating a false breakout and trapping long liquidity. Therefore, it’s advisable to exercise caution and closely monitor this situation. Let’s see how it unfolds!
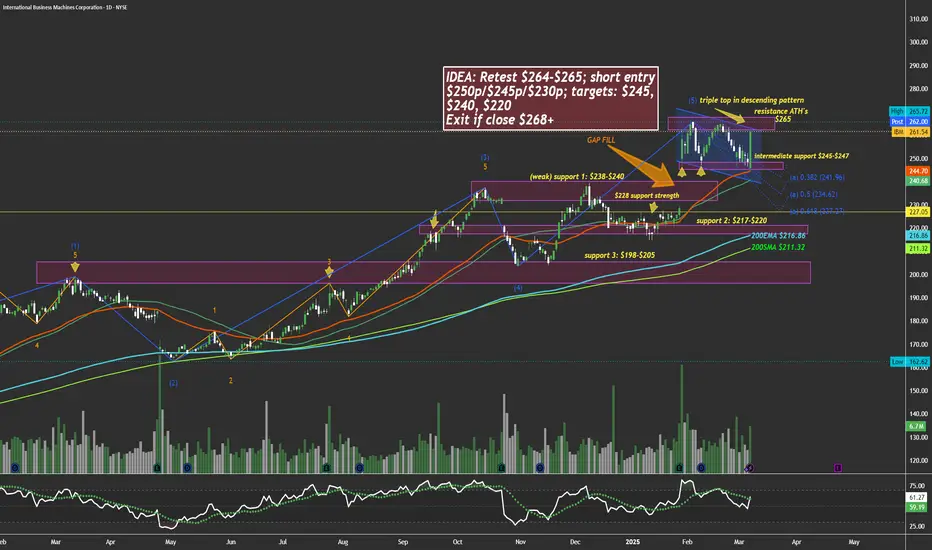
$IBM too hot, due for a chillHi, constructed a chart here showing many levels. I personally think NYSE:IBM will face some downside weeks to come. My trade plan is written in the idea box. The two lines that aren't labeled are 50ema and 50sma.
WSL
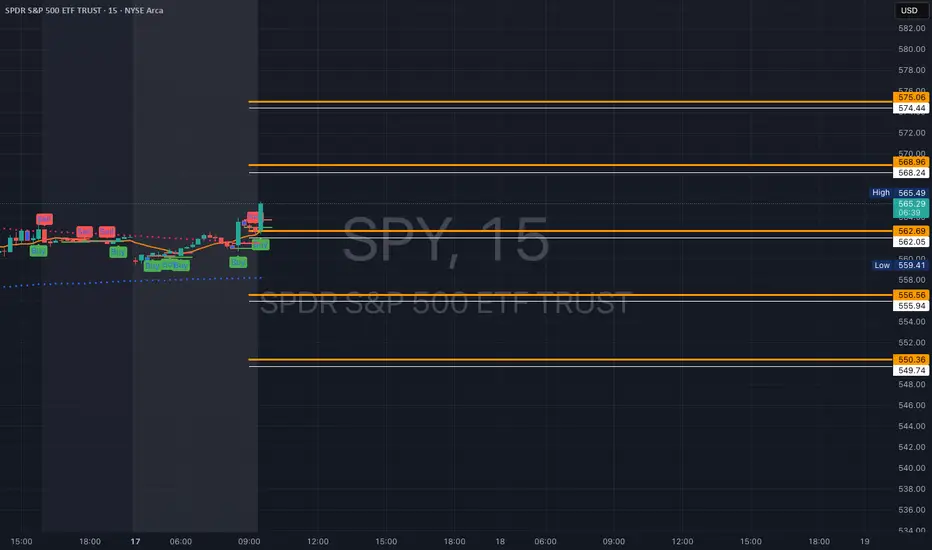
SPY - support & resistant areas for today March 17, 2025The key support and resistance levels for SPY today are above.
Follow me to get this notified when I publish in the morning.
Understanding key levels in trading can provide valuable insights into potential market movements. These levels often indicate where prices might reverse or consolidate, serving as important signals for traders considering long (buy) or short (sell) positions.
Calculated using complex mathematical models, these levels are tailored for today's trading session and may evolve as market conditions change.
If you find this information beneficial and would like to receive these insights every morning at 9:30 AM, I invite you to support me by boosting this post and following me @OnePunchMan91. Your engagement is greatly valued! However, please note that if this post doesn’t receive more than 10 boosts, I will have to reconsider providing these daily updates. Thank you for your support!
Need any other charts daily, comment on this.
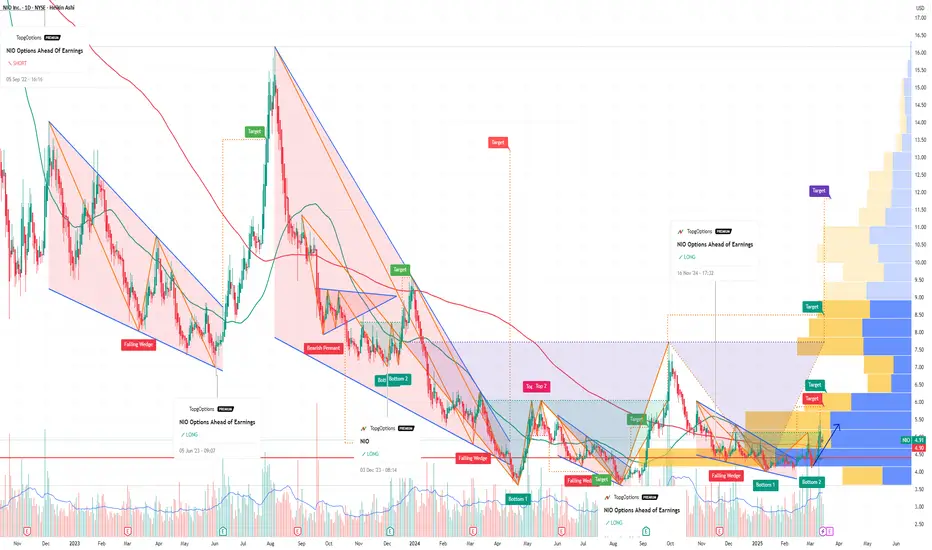
NIO Options Ahead of EarningsIf you haven`t bought NIO before the previous earnings:
Now analyzing the options chain and the chart patterns of NIO prior to the earnings report this week,
I would consider purchasing the 6usd strike price Calls with
an expiration date of 2025-6-20,
for a premium of approximately $0.47.
If these options prove to be profitable prior to the earnings release, I would sell at least half of them.
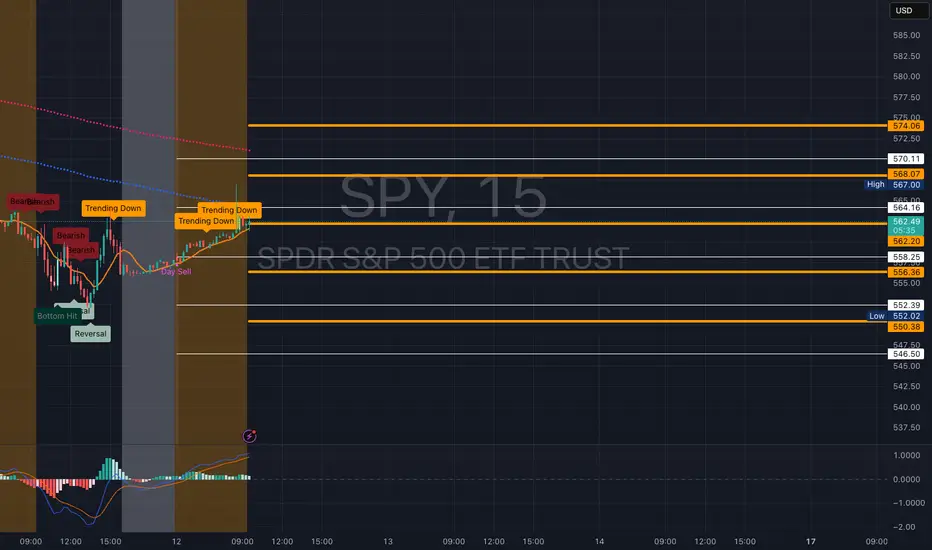
SPY - support & resistant areas for today March 12, 2025The key support and resistance levels for SPY today are above.
Follow me to get this notified when I publish in the morning.
Understanding key levels in trading can provide valuable insights into potential market movements. These levels often indicate where prices might reverse or consolidate, serving as important signals for traders considering long (buy) or short (sell) positions.
Calculated using complex mathematical models, these levels are tailored for today's trading session and may evolve as market conditions change.
If you find this information beneficial and would like to receive these insights every morning at 9:30 AM, I invite you to support me by boosting this post and following me @OnePunchMan91. Your engagement is greatly valued! However, please note that if this post doesn’t receive more than 10 boosts, I will have to reconsider providing these daily updates. Thank you for your support!
Need any other charts daily, comment on this.
SPY - support & resistant areas for today March 11, 2025The key support and resistance levels for SPY today are above.
Follow me to get this notified when I publish in the morning.
Understanding key levels in trading can provide valuable insights into potential market movements. These levels often indicate where prices might reverse or consolidate, serving as important signals for traders considering long (buy) or short (sell) positions.
Calculated using complex mathematical models, these levels are tailored for today's trading session and may evolve as market conditions change.
If you find this information beneficial and would like to receive these insights every morning at 9:30 AM, I invite you to support me by boosting this post and following me @OnePunchMan91. Your engagement is greatly valued! However, please note that if this post doesn’t receive more than 10 boosts, I will have to reconsider providing these daily updates. Thank you for your support!
Need any other charts daily, comment on this.

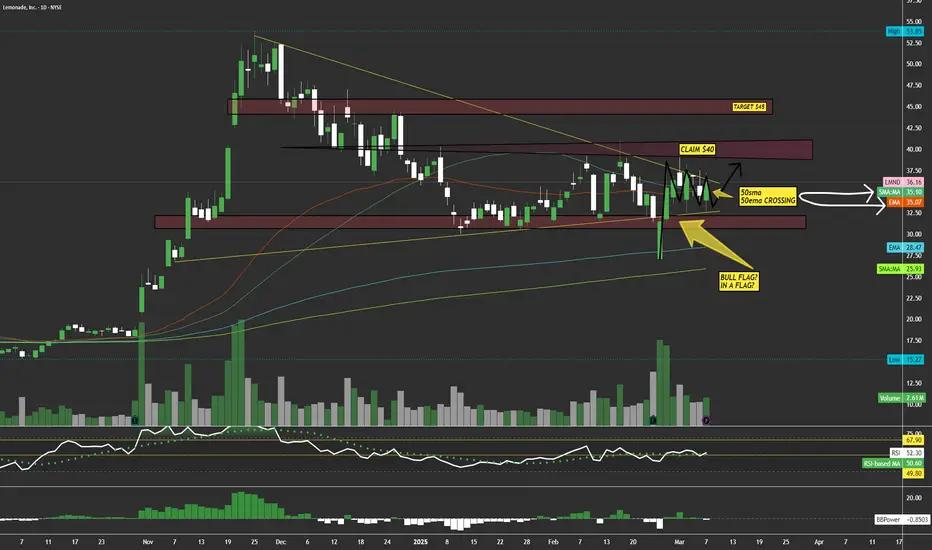
$LMND lagger in fintech, upside potential, EMA SMA crossingNYSE:LMND I'm a fan of financials, NYSE:MA , NYSE:V , NYSE:DFS , NASDAQ:PYPL , NASDAQ:AFRM , etc, even look at $SEZL. I think this name is a laggard in the sector and actually provides a good idea of business, something oversaturated but a different approach and ideas. With momentum and volume this name can trigger great upside potential in the next 3-6 months. Earnings are there and I look the setup here inside the triangle/flag. Long.
Also the 200ema and 200sma are riding nicely and the 50ema and 50sma are crossing over one another.
WSL
BHARTI AIRTEL give Shorting Opportunityif BHARTI AIRTEL create today candle is Hanging Man so we have a create shoring trade. add in your watchlist.

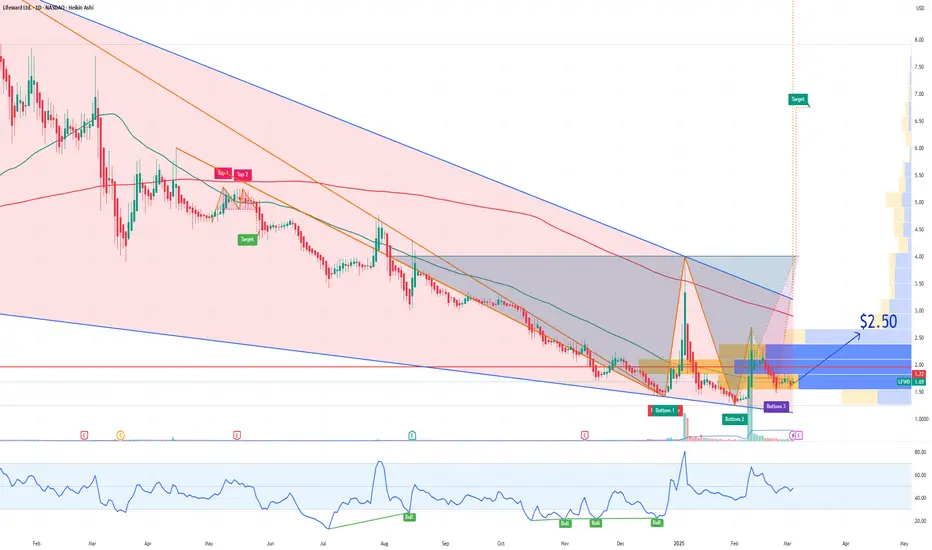
LFWD Lifeward Options Ahead of EarningsAnalyzing the options chain and the chart patterns of LFWD Lifeward prior to the earnings report this week,
I would consider purchasing the 2.50usd strike price Calls with
an expiration date of 2025-7-18,
for a premium of approximately $0.50.
If these options prove to be profitable prior to the earnings release, I would sell at least half of them.
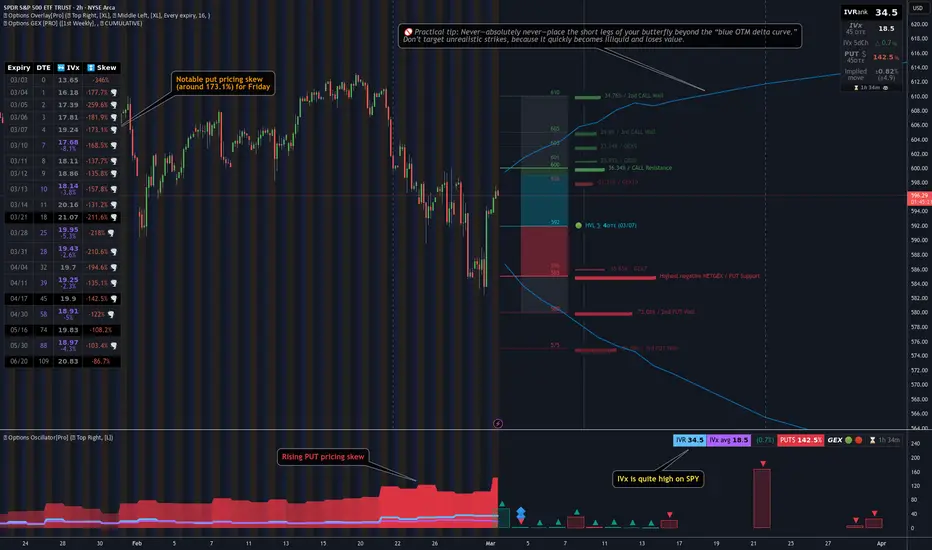
[03/03] SPY GEX Analysis (Until Friday Expiration)Overall Sentiment:
Currently, there’s a positive GEX sentiment, suggesting an optimistic start to the week following Friday’s bounce. However, the key Call resistance appears at 600, and it may not break on the first attempt. If optimism remains strong, there’s a chance SPY 0.09%↑ could still push above that zone after some initial back-and-forth.
🟢Upside Levels:
600–605 Zone: This is a major resistance area. Should SPY move decisively through 600/605, the next potential target could be 610.
610: This is currently the largest positive GEX zone for the week. Current option pricing suggests only about a 9% chance of closing at or above 610 by Friday, so it might require a particularly strong move to break through.
🔵 Transition Zone: Roughly 592–599. The gamma flip level is near 592, and staying above that keeps the market in a positive gamma range for now.
🔴 Downside Risk:
If 592 Fails (or HVL climbing up during the week, and after that HVL fails…): A drop could accelerate toward 585, which may act as the first take-profit zone for bears. Below that, 580 could be in play if selling intensifies.
Lower Support: 575 is the last strong support mentioned, but current option probabilities suggest about an 88% chance of finishing above that level, making a move below 575 less likely—though still possible given the higher put skew.
🟣Volatility & Skew:
IVR (Implied Volatility Rank) is quite high on SPY, with a notable put pricing skew (around 173.1%).
This heightened put skew indicates the market is pricing in faster, more volatile downward moves compared to upside.
Time to Prepare | $SPY Options Bull & Bear Week 1 March 2025AMEX:SPY
Last week's AMEX:SPY $595 Put 3/10 ran for 66% from $480 up to $1,420.
The last two weeks, the market has suffered a controlled pullback. So far it has been cautious selling rather than outright panic. While fear has entered the market, it has yet to reach capitulation, where there would be significantly more potential downside. The key level to watch long-term is the 200SMA on the daily chart, currently at $568.45. This level, which hasn't been tested in 16 months, could signal a Stage 4 selloff, a more aggressive and potentially prolonged downward trend.
Here are this week's AMEX:SPY Options:
(15-30 minute candle closes for confirmation and stop-loss)
📜 $580 PUT 3/17
Entry: Breakdown and failed retest of $584.50
Target 🎯 : $580, $574, $571
📜 $590 CALL 3/17
Confirmed breakout over $584.50
Target 🎯 : $590, $591.50, $594

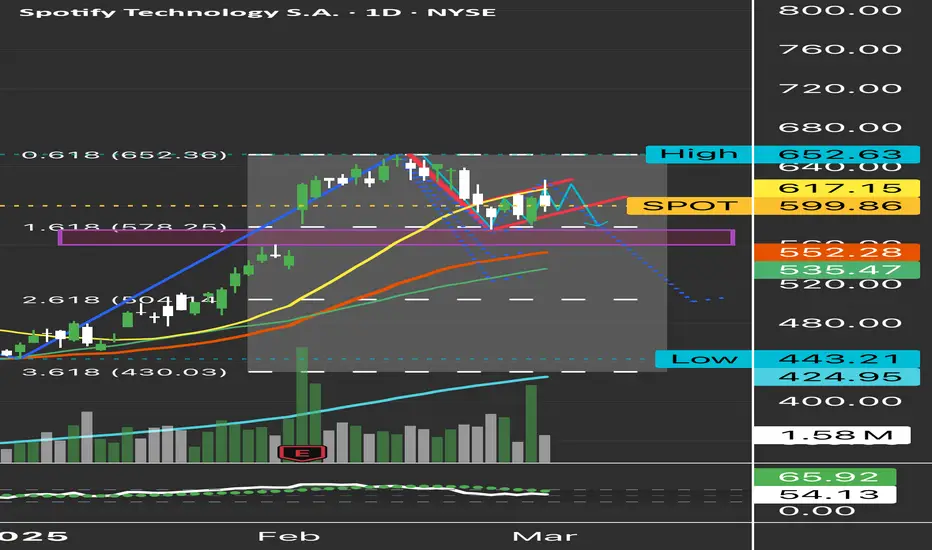
$SPOT the overvalued stock..Be real.. I’m an Apple Music/ Apple applications guy. This stock just seems a little too bloated for me. I’d like to see a retrace to that gap up, this market is volatile and this thing can move hardbody either direction. I’d take my chances with a short for about 50 days out, $560 is the target. I got a bearish rising wedge forming possibly here and some FIB retrace and Elliot Waves. Very expensive premiums as well. Have fun.
WsL
Options Blueprint Series [Intermediate]: Optimal Options StrikesI. Introduction
Options on futures offer traders a flexible way to participate in market movements while managing risk effectively. The Japanese Yen Futures (6J) market provides deep liquidity, making it a preferred instrument for options traders. In this article, we will explore how to optimize Bull Call Spreads in Yen Futures (6J) by understanding price equivalency and strike selection.
One of the most critical aspects of trading options on futures is recognizing that continuous futures charts and contract-specific charts display different prices. This discrepancy must be accounted for when setting up trade entries and exits. Additionally, strike price selection significantly impacts the reward-to-risk ratio, breakeven price, and probability of profitability.
By identifying key support and resistance levels (UFO), we will define trade setups that likely align with market structure, targeting precise entry and exit points. We will also compare different Bull Call Spread variations to understand how adjusting the strike selection impacts risk and potential reward.
II. Understanding the Japanese Yen Futures Contract
Before diving into the options strategy, it is essential to understand the specifications of the CME-traded Japanese Yen Futures (6J) contract:
Contract Size: Each futures contract represents 12,500,000 Japanese Yen
Tick Size: 0.0000005 USD per JPY (equivalent to $6.25 per tick)
Trading Hours: Nearly 24-hour trading cycle with short maintenance breaks
Margin Requirements: Currently $2,900 (varies through time).
For this article, we focus on December 2025 Yen Futures (6JZ2025). Since the market price displayed on continuous charts (6J1!) differs from contract-specific charts, we need to establish price equivalencies to align our trade analysis.
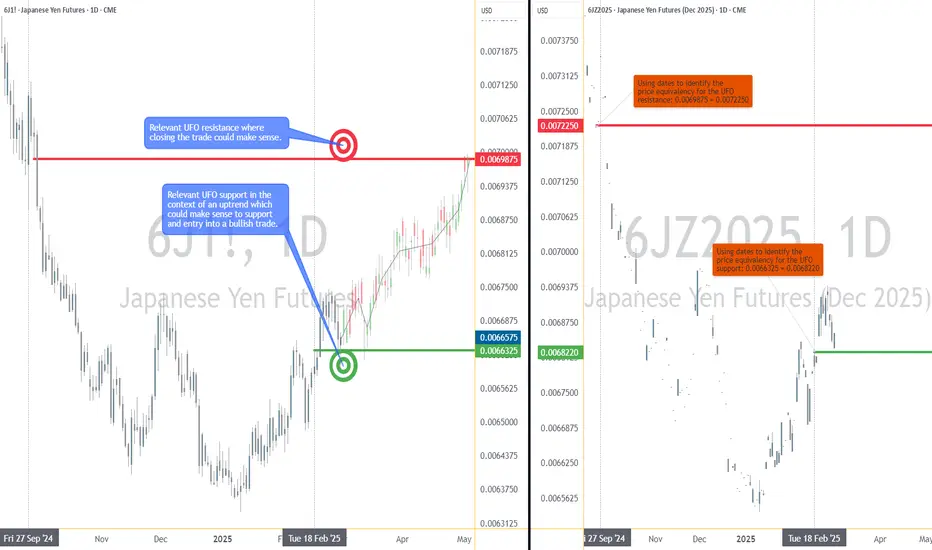
III. Price Equivalency Between Continuous and Contract-Specific Futures
Futures traders commonly use continuous charts (such as 6J1!) for analysis, but when trading options, it is crucial to reference the specific futures contract month (such as 6JZ2025). Due to roll adjustments and term structure variations, prices differ between these two charts.
In this setup, we identify key UFO-based support and resistance levels and adjust for contract-specific price equivalency:
Support Level Equivalency: 0.0066325 (6J1!) = 0.0068220 (6JZ2025)
Resistance Level Equivalency: 0.0069875 (6J1!) = 0.0072250 (6JZ2025)
These adjusted price levels ensure that the trade is structured accurately within the December 2025 contract, aligning option strikes with meaningful technical levels.
IV. The Bull Call Spread Strategy on Yen Futures
A Bull Call Spread is a vertical options spread strategy used to express a bullish outlook while reducing cost and limiting risk. This strategy involves:
Buying a lower-strike call (gaining upside exposure)
Selling a higher-strike call (reducing cost in exchange for capping maximum profit)
This setup provides a defined risk-reward structure and is particularly useful when targeting predefined resistance levels. Given that we identified 0.0068220 as support and 0.0072250 as resistance, we will structure multiple Bull Call Spreads to compare strike selection impact.
Now that the trade structure is established, let’s explore how different strike selections affect risk, reward, and breakeven prices.
V. Strike Selection and Its Impact on Risk-Reward Ratios
Selecting the appropriate strike prices is crucial when structuring a Bull Call Spread, as it directly affects the breakeven price, maximum risk, and maximum reward. To illustrate this, we compare three different Bull Call Spread variations using December 2025 Yen Futures (6JZ2025).
1. 0.00680/0.00720 Bull Call Spread
Breakeven: 0.006930
Maximum Risk: -0.00013
Maximum Reward: +0.00027
2. 0.00680/0.00750 Bull Call Spread
Breakeven: 0.0069789
Maximum Risk: -0.00018
Maximum Reward: +0.00052
3. 0.00680/0.00700 Bull Call Spread
Breakeven: 0.006879
Maximum Risk: -0.00008
Maximum Reward: +0.00012
Observing these variations, key insights emerge. The 0.00680/0.00750 spread offers the highest potential reward but comes with the highest breakeven and greater risk. Meanwhile, the 0.00680/0.00700 spread minimizes risk but provides a lower profit potential. Strike selection, therefore, becomes a balance between profitability potential and probability of success.
A wider spread (such as 0.00680/0.00750) has a higher reward-to-risk ratio, but it requires the price to move further before generating profits. Conversely, a narrower spread (like 0.00680/0.00700) has a lower breakeven price, increasing the probability of profitability but limiting potential upside.
VI. Trade Plan for a Bull Call Spread
Based on the analysis of strike selection, a balanced trade plan can be structured using the 0.00680/0.00720 Bull Call Spread, which offers a favorable reward-to-risk ratio while maintaining a reasonable breakeven price.
Market Bias: Bullish, expecting a move toward resistance
Selected Strikes: Long 0.00680 call, short 0.00720 call
Breakeven Price: 0.006930
Target Exit Price: 0.0072250
Maximum Risk: -0.00013
Maximum Reward: +0.00027
Reward-to-Risk Ratio: 2.08:1
This setup capitalizes on the previously identified UFO support to define the entry point, while the UFO resistance provides a target for exit. The breakeven price remains at a reasonable level, ensuring a greater probability of the spread moving into profitability.
VII. Risk Management Considerations
While the Bull Call Spread limits risk compared to outright long calls, proper risk management is still necessary. Traders should consider the following:
Using Stop-Loss Orders: If price breaks below the UFO support level at 0.0068220, traders may exit the position early to avoid excessive losses.
Hedging with Puts: If volatility spikes or market sentiment shifts, a put option or put spread can serve as a hedge against adverse movements.
Position Sizing: Adjusting contract size ensures that total exposure remains within acceptable risk limits based on account size.
Time Decay Considerations: Since time decay negatively impacts long call options, traders should monitor the spread's profitability as expiration approaches and adjust positions accordingly.
By implementing these risk management techniques, traders can optimize their Bull Call Spread strategy while mitigating unnecessary exposure.
When charting futures, the data provided could be delayed. Traders working with the ticker symbols discussed in this idea may prefer to use CME Group real-time data plan on TradingView: tradingview.sweetlogin.com - This consideration is particularly important for shorter-term traders, whereas it may be less critical for those focused on longer-term trading strategies.
General Disclaimer:
The trade ideas presented herein are solely for illustrative purposes forming a part of a case study intended to demonstrate key principles in risk management within the context of the specific market scenarios discussed. These ideas are not to be interpreted as investment recommendations or financial advice. They do not endorse or promote any specific trading strategies, financial products, or services. The information provided is based on data believed to be reliable; however, its accuracy or completeness cannot be guaranteed. Trading in financial markets involves risks, including the potential loss of principal. Each individual should conduct their own research and consult with professional financial advisors before making any investment decisions. The author or publisher of this content bears no responsibility for any actions taken based on the information provided or for any resultant financial or other losses.
#SPYSPY is currently doing a retracement
If we hold above 595 this week we'll start seeing a bounce and still touch that long term goal of $617 area
But if we dont hold that level of 595 this week.
We can keep dropping all the way to 580 area

$MSFT $SNOW sympathy play, $390-$400 SupportNASDAQ:MSFT NYSE:SNOW — Microsoft is like a snail in this AI/ Tech race but I suppose that shows strength because no major drops and holding zones well. Bottoms after bottoms. I’m looking for short term calls here. As of today, ending week 2/28, I may try $405c. But can see this retest the $420s weeks to come.
WallStreetLoser
