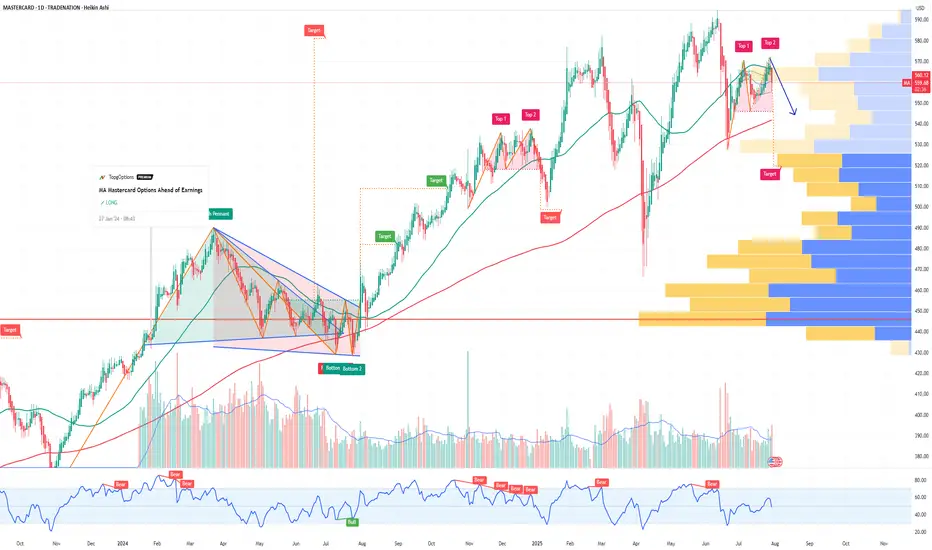
MA Mastercard Incorporated Options Ahead of EarningsIf you haven`t bought MA before the rally:
Now analyzing the options chain and the chart patterns of MA Mastercard Incorporated prior to the earnings report this week,
I would consider purchasing the 545usd strike price Puts with
an expiration date of 2025-8-8,
for a premium of approximately $4.45.
If these options prove to be profitable prior to the earnings release, I would sell at least half of them.
Disclosure: I am part of Trade Nation's Influencer program and receive a monthly fee for using their TradingView charts in my analysis.
Optiontrading
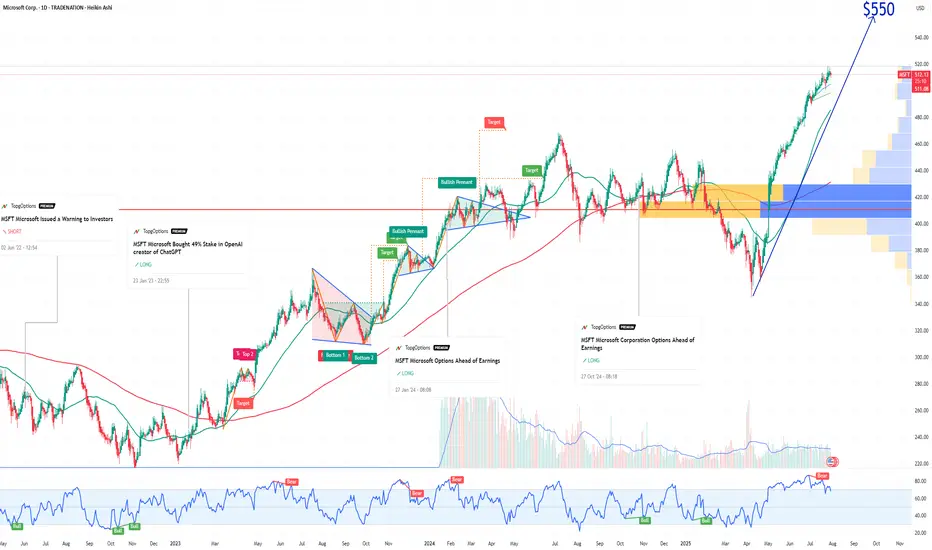
MSFT Microsoft Corporation Options Ahead of EarningsIf you haven`t bought MSFT when they announced the 49% stake in OpenAI:
Now analyzing the options chain and the chart patterns of MSFT Microsoft Corporation prior to the earnings report this week,
I would consider purchasing the 550usd strike price Calls with
an expiration date of 2025-12-19,
for a premium of approximately $14.75.
If these options prove to be profitable prior to the earnings release, I would sell at least half of them.
Disclosure: I am part of Trade Nation's Influencer program and receive a monthly fee for using their TradingView charts in my analysis.
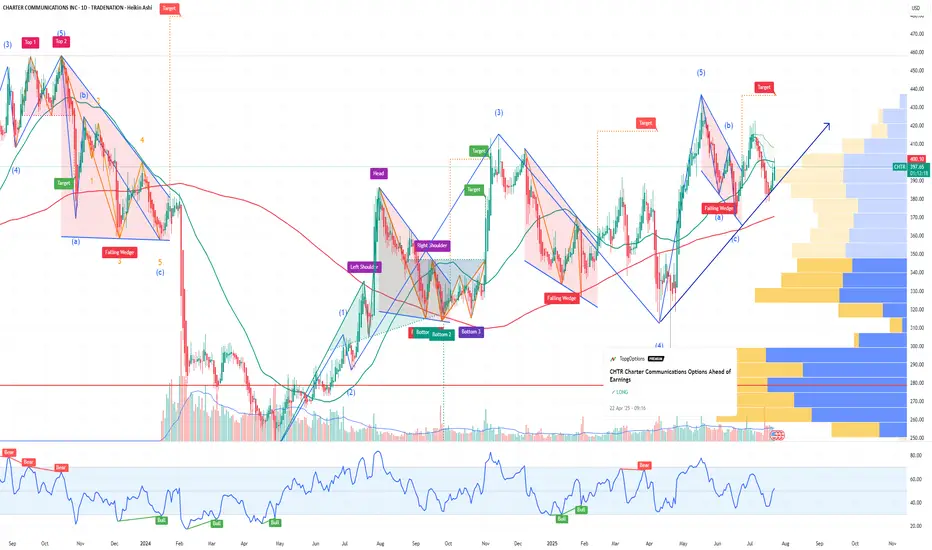
CHTR Charter Communications Options Ahead of EarningsIf you haven`t bought CHTR before the previous earnings:
Now analyzing the options chain and the chart patterns of CHTR Charter Communications prior to the earnings report this week,
I would consider purchasing the 387.5usd strike price Calls with
an expiration date of 2025-7-25,
for a premium of approximately $22.55.
If these options prove to be profitable prior to the earnings release, I would sell at least half of them.
Disclosure: I am part of Trade Nation's Influencer program and receive a monthly fee for using their TradingView charts in my analysis.
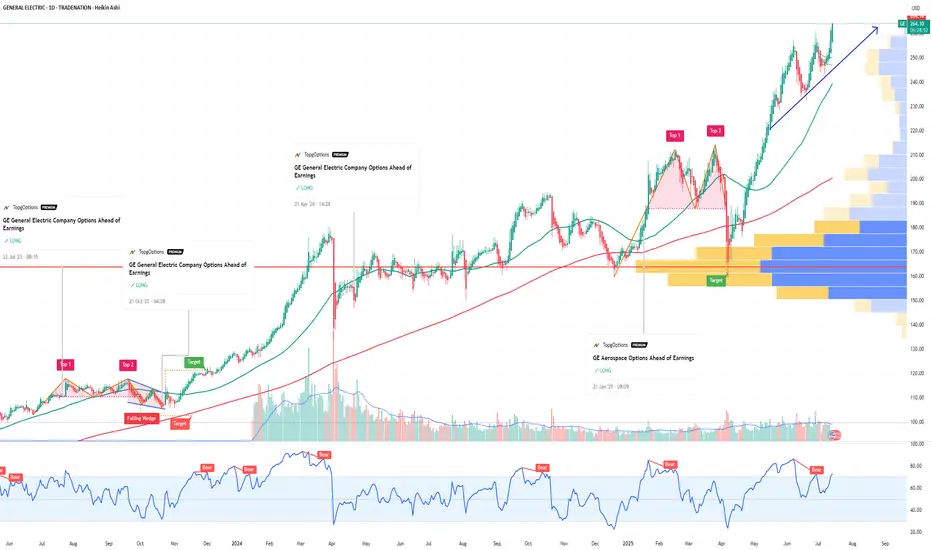
GE Aerospace Options Ahead of EarningsIf you haven`t bought GE before the rally:
Now analyzing the options chain and the chart patterns of GE Aerospace prior to the earnings report this week,
I would consider purchasing the 270usd strike price Calls with
an expiration date of 2025-8-15,
for a premium of approximately $8.60.
If these options prove to be profitable prior to the earnings release, I would sell at least half of them.
Disclosure: I am part of Trade Nation's Influencer program and receive a monthly fee for using their TradingView charts in my analysis.
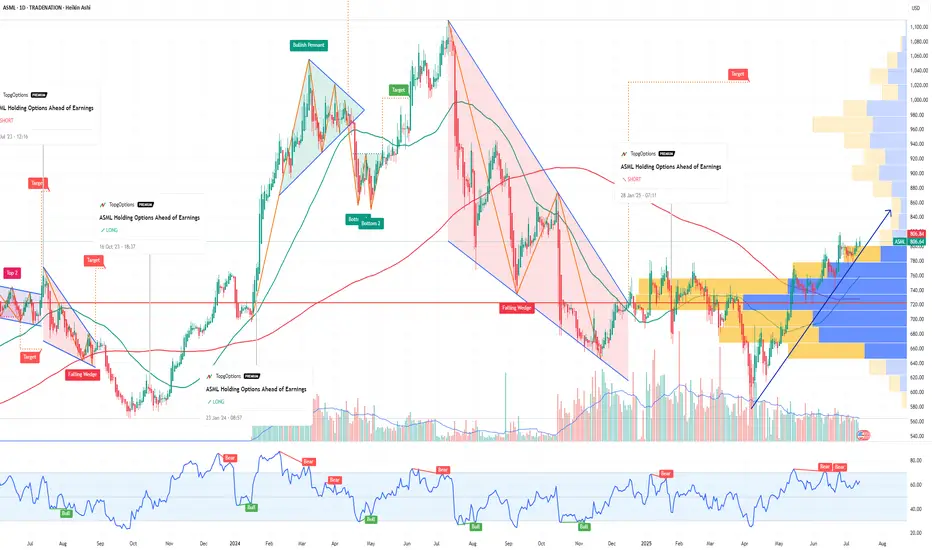
ASML Holding Options Ahead of EarningsIf you haven`t bought the dip on ASML:
Now analyzing the options chain and the chart patterns of ASML Holding prior to the earnings report this week,
I would consider purchasing the 800usd strike price Calls with
an expiration date of 2025-7-25,
for a premium of approximately $32.00.
If these options prove to be profitable prior to the earnings release, I would sell at least half of them.
Disclosure: I am part of Trade Nation's Influencer program and receive a monthly fee for using their TradingView charts in my analysis.
MP Materials Options Ahead of EarningsIf you haven`t bought MP before the previuos earnings:
Now analyzing the options chain and the chart patterns of MP Materials prior to the earnings report this week,
I would consider purchasing the 25usd strike price Calls with
an expiration date of 2025-6-20,
for a premium of approximately $2.97.
If these options prove to be profitable prior to the earnings release, I would sell at least half of them.

Sector Rotation Strategy🌐 Sector Rotation Strategy: A Smart Way to Stay Ahead in the Stock Market
What Is Sector Rotation?
Imagine you're playing cricket. Some players shine in certain conditions — like a fast bowler on a bouncy pitch or a spinner on a turning track. The same idea applies to stock market sectors.
Sector Rotation is the process of shifting your money from one sector to another based on the market cycle, economic trends, or changing investor sentiment.
In simple words:
"You’re moving your money where the action is."
First, What Are Sectors?
The stock market is divided into different sectors, like:
Banking/Financials – HDFC Bank, Kotak Bank, SBI
IT– Infosys, TCS, Wipro
FMCG – HUL, Nestle, Dabur
Auto – Maruti, Tata Motors
Pharma – Sun Pharma, Cipla
Capital Goods/Infra – L&T, Siemens
PSU – BEL, BHEL, HAL
Real Estate, Metals, Energy, Telecom, etc.
Each sector behaves differently at various stages of the economy.
Why Is Sector Rotation Important?
Because all sectors don’t perform well all the time.
For example:
In a bull market, sectors like Auto, Capital Goods, and Infra usually lead.
During slowdowns, investors run to safe havens like FMCG and Pharma.
When inflation or crude oil rises, energy stocks tend to do better.
When interest rates drop, banking and real estate might shine.
So, instead of holding poor-performing sectors, smart investors rotate into the hot ones.
How Does Sector Rotation Work?
Let’s say you are an investor or trader.
Step-by-step guide:
Track the economy and markets
Is GDP growing fast? = Economy expanding
Are interest rates high? = Tight liquidity
Is inflation cooling down? = Growth opportunity
Observe sectoral indices
Check Nifty IT, Nifty Bank, Nifty FMCG, Nifty Pharma, etc.
See which are outperforming or lagging.
Watch for news flow
Budget announcements, RBI policy, global cues, crude oil prices, etc.
E.g., Defence orders boost PSU stocks like BEL or HAL.
Move your capital accordingly
If Infra and Capital Goods are breaking out, reduce exposure in IT or FMCG and rotate into Infra-heavy stocks.
Real Example (India, 2024–2025)
Example: Rotation from IT to PSU & Infra
In late 2023, IT stocks underperformed due to global slowdown and US recession fears.
Meanwhile, PSU and Infra stocks rallied big time because:
Government increased capital expenditure.
Defence contracts awarded.
Railway budget saw record allocations.
So, many smart investors rotated out of IT and into:
PSU Stocks: RVNL, BEL, HAL, BHEL
Capital Goods/Infra: L&T, Siemens, ABB
Railway Stocks: IRFC, IRCTC, Titagarh Wagons
This sector rotation gave 30%–100% returns in a few months for many stocks.
Tools You Can Use
Sectoral Charts on TradingView / Chartink / NSE
Use indicators like RSI, MACD, EMA crossover.
Compare sectors using “Relative Strength” vs Nifty.
Economic Calendar
Track RBI policy, inflation data, IIP, GDP, etc.
News Portals
Moneycontrol, Bloomberg, ET Markets, CNBC.
FIIs/DII Activity
Where the big money is going – this matters!
Sector Rotation Heatmaps
Some platforms show weekly/monthly performance of sectors.
📈 Sector Rotation Strategy for Traders
For short-term traders (swing/intraday):
Rotate into sectors showing strength in volumes, price action, breakouts.
Use tools like Open Interest (OI) for sector-based option strategies.
Example:
On expiry weeks, if Bank Nifty is showing strength with rising OI and volume, rotate capital into banking-related trades (Axis, ICICI, SBI).
Sector Rotation for Long-Term Investors
For investors, sector rotation can be used:
To reduce drawdowns.
To book profits and re-enter at better levels.
To ride economic trends.
Example:
If you had exited IT in late 2022 after a rally, and entered PSU stocks in early 2023, your portfolio would’ve seen better growth.
Pros of Sector Rotation
Better returns compared to static investing
Helps avoid underperforming sectors
Takes advantage of macro trends
Works in both bull and bear markets
Cons or Risks
Requires monitoring and active management
Timing the rotation is difficult
Wrong rotation = underperformance
May incur tax if frequent buying/selling (for investors)
Pro Tips
Don't rotate too fast; let the trend confirm.
Use SIPs or staggered entry in new sectors.
Avoid “hot tips”; follow actual price and volume.
Blend sector rotation with strong stock selection (don’t just chase sector).
Conclusion
The Sector Rotation Strategy is one of the smartest, most practical tools used by both traders and investors. You don’t need to be a pro to use it — just stay alert to the market mood, economic cycles, and where the money is moving.
Think of it as dancing with the market:
“When the music changes, you change your steps.”
Keep rotating. Keep growing.
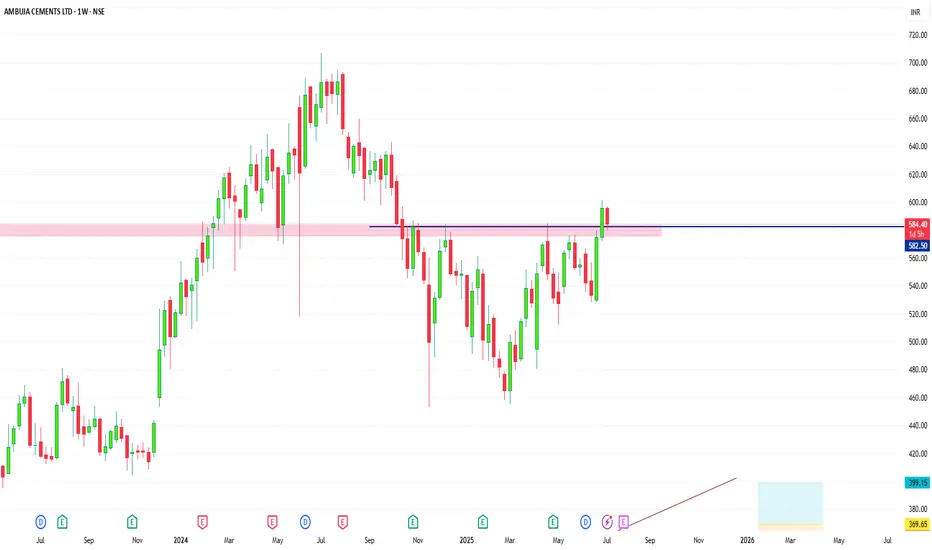
AMBUJA CEMENT FOR SWINGA Good opportunity in Ambuja Cement for swing trade, weekly resistance break and retesting, so add in your watchlist.
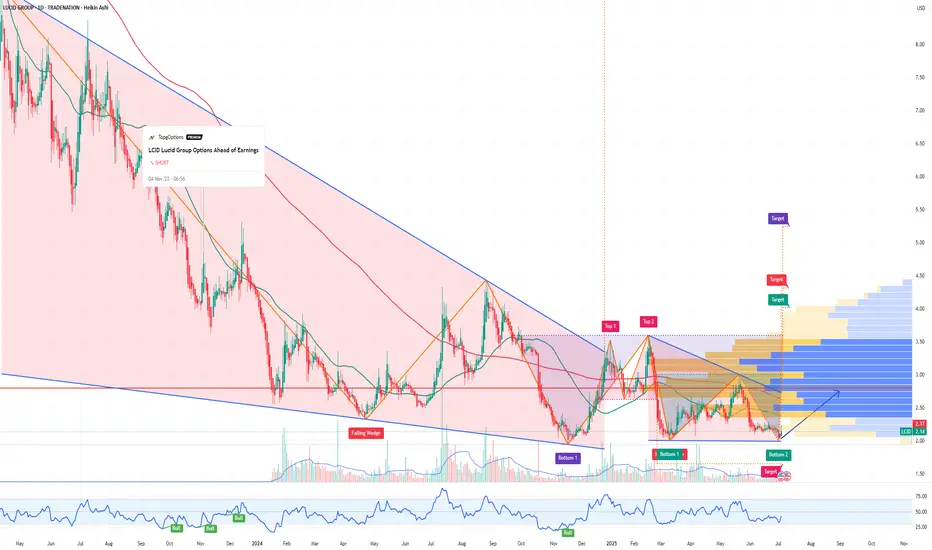
LCID: Could a Saudi Buyout Send This EV Stock Back to $10?If you haven`t sold LCID before the previous earnings:
Now you need to know that Lucid Motors (LCID) is one of the most polarizing EV stocks in the market — but it’s also one of the most interesting speculative turnarounds. Yes, the company faces production challenges, cash burn, and fierce competition from Tesla, BYD, and legacy automakers. But it has some unique wildcards that most other EV startups don’t:
1) The “Musk Factor”
Musk’s public comments about Lucid being “basically controlled by the Saudis” and that they make better-looking cars than Tesla might sound like trolling, but they highlight a real truth: Lucid isn’t just another budget EV player — it’s positioned as a luxury rival with design appeal that matters to high-end buyers.
2) Saudi PIF Is Deep In — Valuation Floor
The Saudi sovereign wealth fund has put billions into LCID already — and now owns around 60%+ of the shares. They’ve made no secret of their plans to expand the kingdom’s domestic EV production and see Lucid as a flagship partner.
Rumors have swirled for years about a possible full buyout to bring Lucid fully under the PIF umbrella — or merge it with other Middle East EV initiatives like the Ceer brand. Any credible news here could double or triple the stock overnight from these depressed levels.
3) Gravity SUV & Product Pipeline
The Lucid Air remains one of the few luxury EVs that truly competes with Tesla’s Model S in both design and range. The upcoming Gravity SUV could be the next big catalyst, especially as the luxury SUV segment has fatter margins and huge global demand.
Meanwhile, the new AMP-2 factory in Saudi Arabia will help Lucid localize production, get tax incentives, and serve the Middle East and Europe more cost-effectively.
4) Technical Setup: Double Bottom Pattern
Here’s what really makes this setup tradable: LCID is showing a clear double bottom on the daily chart around the $2–$2.20 zone. The stock tested that level twice and bounced, forming a W-shaped base that can signal a reversal.
Disclosure: I am part of Trade Nation's Influencer program and receive a monthly fee for using their TradingView charts in my analysis.
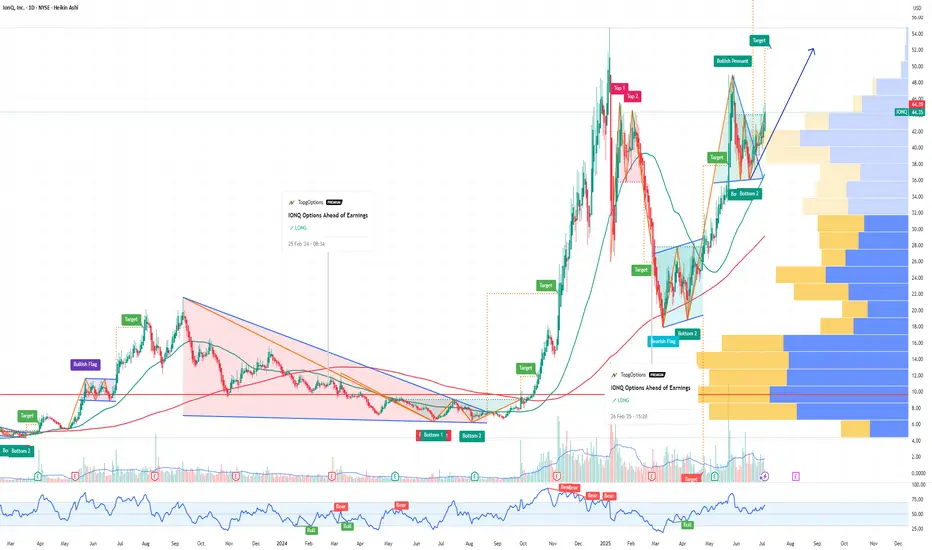
Why IonQ (IONQ) Could Be the NVDA of Quantum ComputingIf you haven`t bought IONQ before the rally:
Now you need to know that IonQ isn’t just another speculative quantum stock — The company is building a robust ecosystem around its best‑in‑class trapped‑ion architecture and targeting fault‑tolerant, networked quantum systems. With record bookings, major acquisitions, and a strong balance sheet, IonQ could emerge as the NVIDIA equivalent for quantum infrastructure.
Key Bullish Arguments
1) Superior Quantum Tech – Trapped‑Ion Advantage
IonQ’s trapped-ion processors boast 99.9% two-qubit fidelity, demonstrating higher accuracy and scalability than superconducting alternatives
These systems also operate at room temperature, meaning simpler deployment and lower costs
2) Ecosystem Strategy & Acquisitions
The $1.08B acquisition of Oxford Ionics (expected close in 2025) expands IonQ’s qubit control tech, pushing toward planned 80,000 logical‑qubit systems by decade’s end
Combined with ID Quantique and Lightsynq, IonQ is building a full-stack quantum and networking offering
3) Strong Revenue Growth & Cash Runway
Revenue soared from $22M in 2023 to $43.1M in 2024, with bookings of $95.6M
. Q1 2025 saw $7.6M revenue and EPS –$0.14, beating expectations; cash reserves near $697M provide years of runway
4) Real Commercial Deployments
IonQ sold its Forte Enterprise quantum system to EPB ($22M deal) for hybrid compute and networking, marking real-world commercial applications
5) AI & Quantum Synergy
Involvement in NVIDIA’s Quantum Day and hybrid quantum‑classical AI demos (e.g., blood pump simulation with Ansys, ~12 % faster) indicates strategic synergy and positions IonQ as a critical piece in the future AI stack
Recent Catalysts:
Texas Quantum Initiative passes – positions IonQ at forefront of U.S. state-backed innovation
Oxford Ionics acquisition pending – major expansion in qubit scale & tech
Barron’s analyst buys – industry analysts see long-term potential; IonQ among top quantum picks
Broader quantum optimism – McKinsey & Morgan Stanley forecasts highlight synergy between quantum and AI, benefiting IonQ
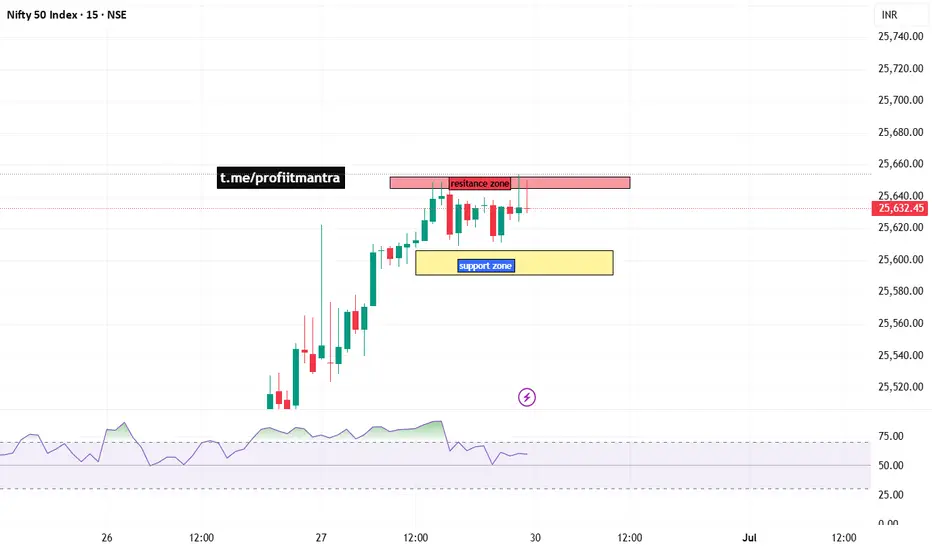
NIFTY 50 INDEX CHART ANALYSIS FOR INTRADAYNIFTY 50 INDEX CHART ANALYSIS FOR INTRADAY.
here we are seeing of nifty 50 index chart, and one is resistance and one box is support that is yellow color and if price will come to support and then we will try to find of buy opportunity. if support zone breaks then we will plan for sell of nifty and if break of resistance, then we will see big rally.
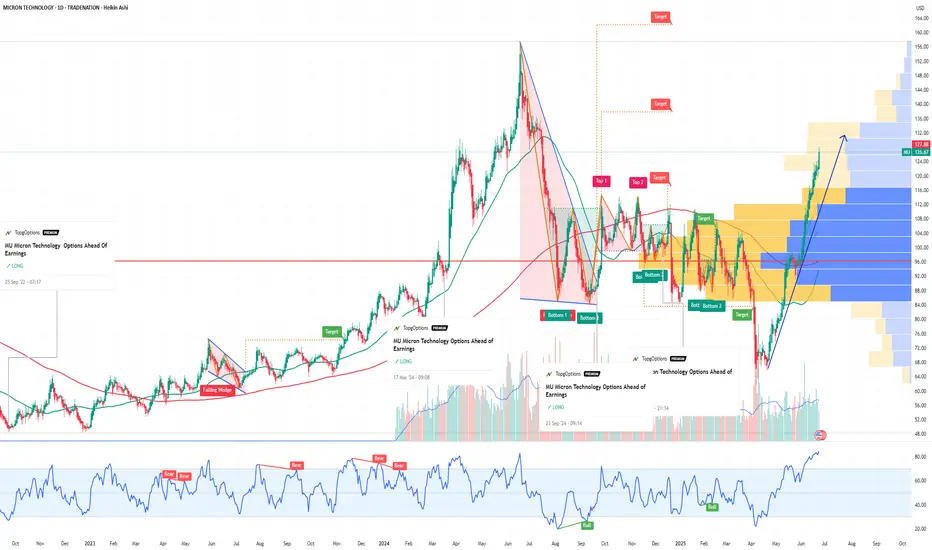
MU Micron Technology Options Ahead of EarningsIf you haven`t bought MU before the rally:
Now analyzing the options chain and the chart patterns of MU Micron Technology prior to the earnings report this week,
I would consider purchasing the 128usd strike price Calls with
an expiration date of 2025-6-27,
for a premium of approximately $5.52.
If these options prove to be profitable prior to the earnings release, I would sell at least half of them.
Disclosure: I am part of Trade Nation's Influencer program and receive a monthly fee for using their TradingView charts in my analysis.
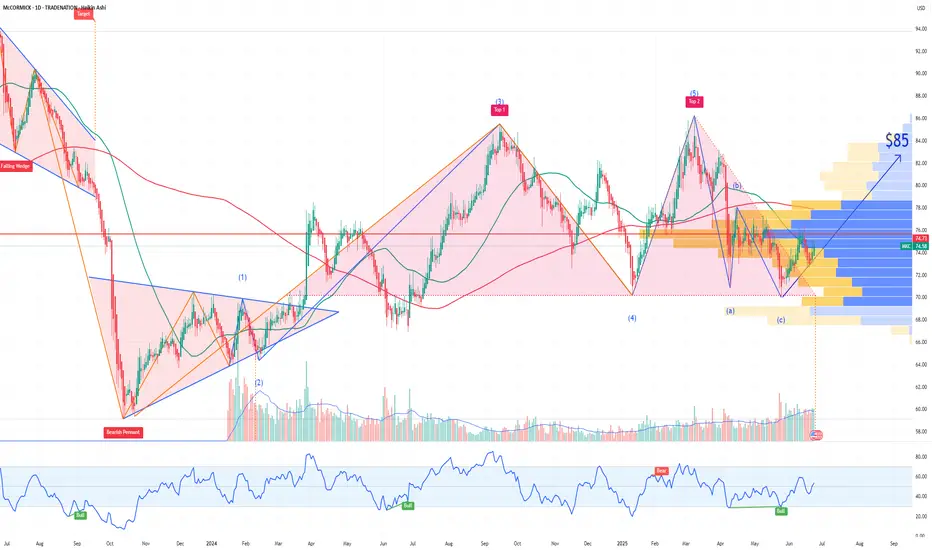
MKC McCormick & Company Options Ahead of EarningsAnalyzing the options chain and the chart patterns of MKC McCormick & Company prior to the earnings report this week,
I would consider purchasing the 85usd strike price Calls with
an expiration date of 2026-1-16,
for a premium of approximately $1.40.
If these options prove to be profitable prior to the earnings release, I would sell at least half of them.
Disclosure: I am part of Trade Nation's Influencer program and receive a monthly fee for using their TradingView charts in my analysis.
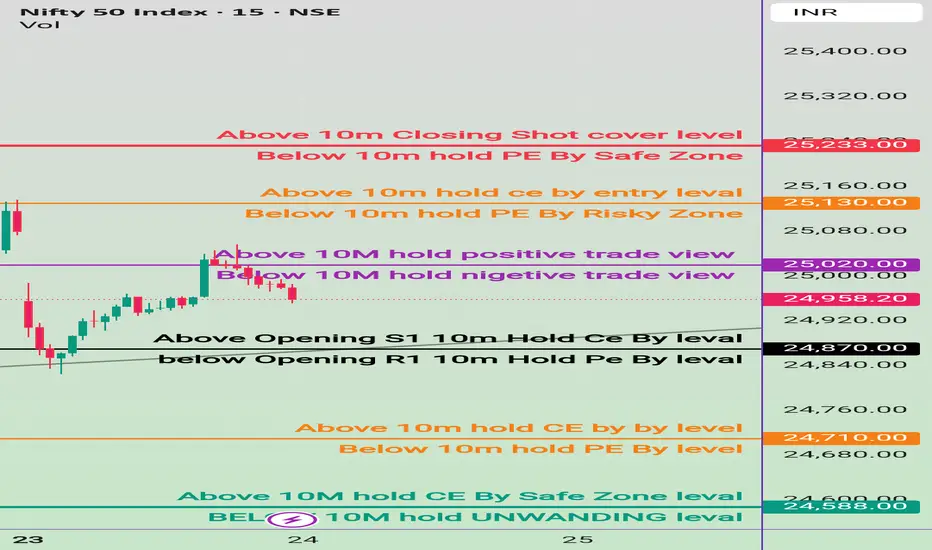
24 June nifty breakout & breakdown levels 🔺 Bullish (Call Option / CE) Strategy:
✅ Buy CE (Call Option) when:
Above 24,710 → Entry for bullish trade
"Above 10m hold CE by buy level"
Above 24,870 → Stronger confirmation
"Above Opening S1 10M Hold CE By level"
Above 25,020 → Positive trade view
"Above 10M hold positive trade view"
Above 25,130 → Safer CE entry zone
"Above 10M hold CE by entry level"
Above 25,233 → Closing shot level
"Above 10M Closing Shot cover level"
🔻 Bearish (Put Option / PE) Strategy:
✅ Buy PE (Put Option) when:
Below 24,710 → Entry for bearish trade
"Below 10m hold PE By level"
Below 24,870 → Bearish confirmation
"Below Opening R1 10M Hold PE By level"
Below 25,020 → Negative trade view
"Below 10M hold nigeative trade view"
Below 25,130 → Risky PE zone
"Below 10M hold PE By Risky Zone"
Below 25,233 → Safer PE Zone
"Below 10M hold PE By Safe Zone"
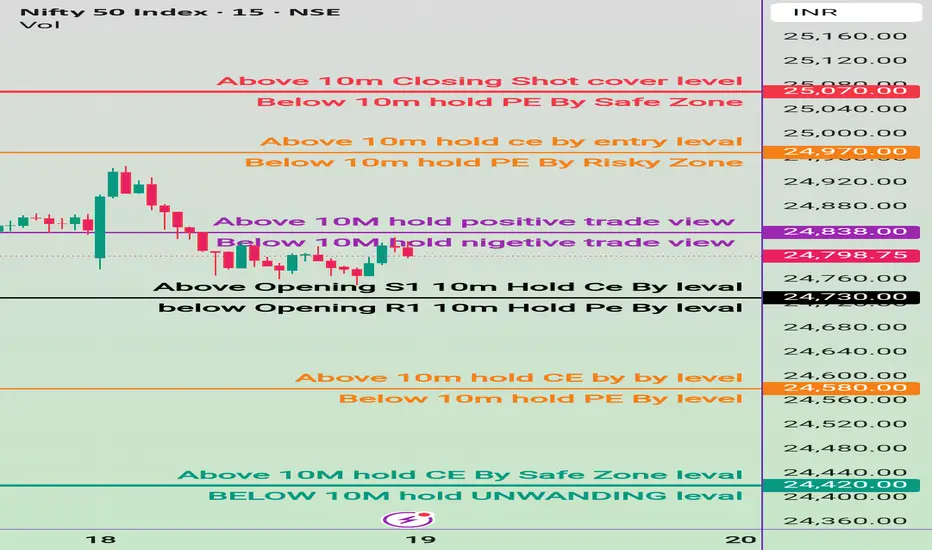
19 june Nifty50 brekout and Breakdown leval
✅ Safe Buy Zone (Support Levels):
24,437.70 → Above 10M: Hold CE by Safe Zone Level
24,420.00 → Below 10M: Hold Unwinding Level
→ Breach below could trigger unwinding / profit booking.
🔴 Resistance & Bearish PE Zones:
25,070.00 – Above 10m closing: Short Cover Level
→ Strong resistance; if crossed and sustained, short covering possible.
24,970.00 – Above 10m: Hold CE by Entry Level
→ Bullish entry confirmation level.
24,838.00 – Above 10M: Hold Positive Trade View
→ Indicates shift to bullish bias if held above.
⚫ Opening Based Levels:
24,730.00
→ Above Opening S1: Hold CE by Level
Below Opening R1 (level not clearly marked with value but appears near 24,730)
→ Hold PE by Level
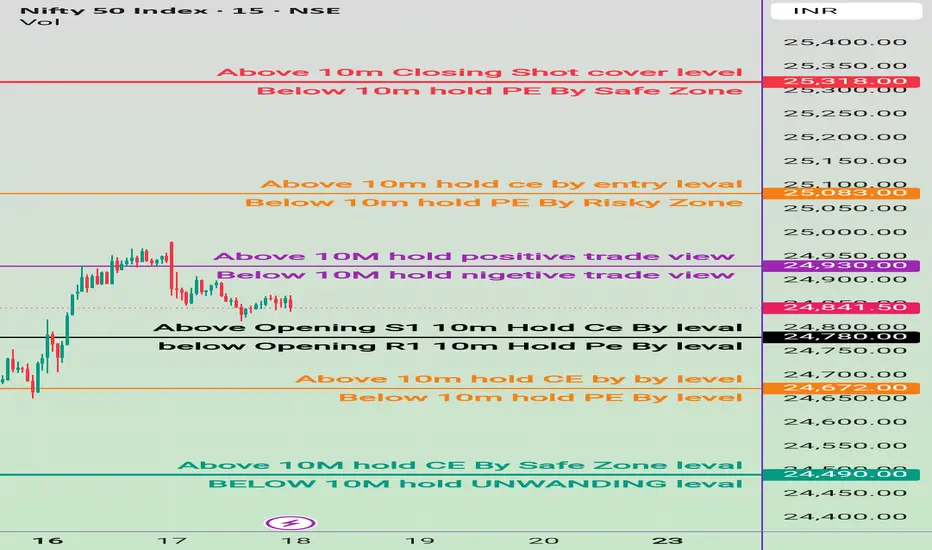
18 june Nifty50 brekout and Breakdown leval
CALL (CE) – Bullish triggers
↑ 24,437 – 24,547 : Safe‑zone long entry
↑ 24,672: Hold CE while above this mark
↑ 24,780 : Opening‑S1 breakout, keep holding CE
↑ 24,930.00 : Turns bias positive; fresh CE can be added
↑ 25,083.00 : Entry level for aggressive longs
↑ 25,318.00 : Short‑cover zone; strong upside momentum possible
PUT (PE) – Bearish triggers
↓ 25,318.00 : If price closes back under, shift to PE (safe)
↓ 25,083 : PE in the “risky” reversal zone
↓ 24,930 : Bias flips negative; keep/add PE
↓ 24,780 : Opening‑R1 break; hold PE
↓ 24,672 : Continue PE below this level
↓ 24,535 : Unwinding zone – watch for fast drops
↓ 24,437 : Final downside support; trail PEs here
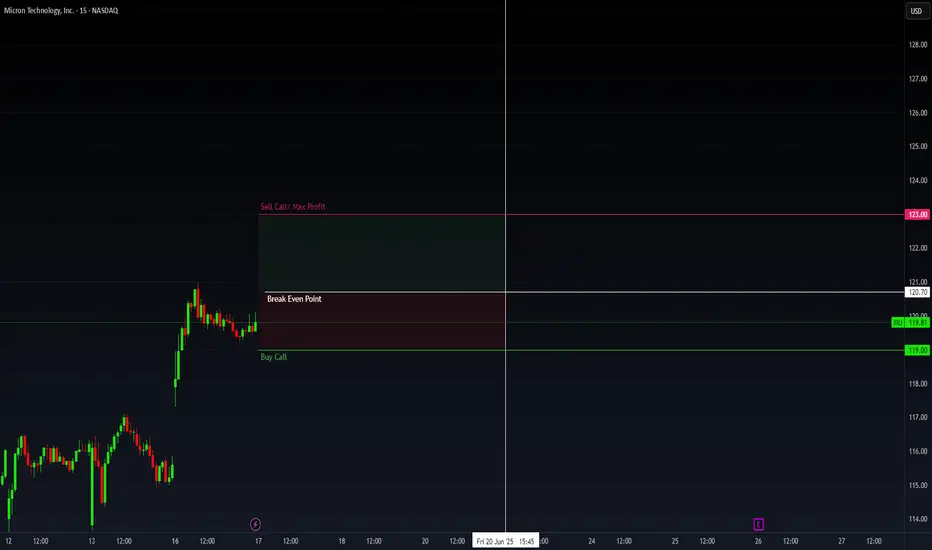
MU Options Insight: Bulls Eyeing $123Fundamental Overview
Micron Technology's $200 billion expansion plan aligns with the broader push for domestic semiconductor manufacturing. The company is investing $150 billion in fabrication plants across Idaho, New York, and Virginia, while $50 billion is allocated for high-bandwidth memory packaging and R&D. This move strengthens Micron’s position in AI-driven demand and supply chain resilience.
The CHIPS and Science Act funding of $6.4 billion and eligibility for the Advanced Manufacturing Investment Credit further bolster Micron’s financial outlook. CEO Sanjay Mehrotra emphasized that this expansion will create tens of thousands of jobs and reinforce U.S. tech leadership.
Technical Analysis
Micron’s stock is currently near a 12-month high, up 37% year to date. The momentum remains strong, with institutional activity suggesting bullish sentiment.
- Options Flow Insight: A vertical bull spread was spotted in Times & Sales, with 118 strike contracts executed on the ask and 123 strike contracts executed on the bid simultaneously. This suggests a bullish stance, as traders anticipate further upside.
- Expiration Consideration: The June 20 expiration (4 days away) indicates a short-term bullish outlook, likely targeting a breakout above $123.
- Institutional Positioning: The 500 additional contracts at 118 reinforce the bullish bias. If MU moves beyond $123, traders holding the spread still profit, confirming strong conviction in upside potential.
AAOI Applied Optoelectronics potential rally by EOYApplied Optoelectronics AAOI is well-positioned for a strong rally toward $24 per share by the end of 2025, supported by multiple operational and strategic catalysts. A key recent development—the warrant agreement with Amazon—adds a powerful endorsement and financial backing that enhances the bullish case.
1. Amazon’s Strategic Warrant Agreement: A Major Vote of Confidence
On March 13, 2025, AAOI issued a warrant to Amazon.com NV Investment Holdings LLC, granting Amazon the right to purchase up to approximately 7.95 million shares at an exercise price of $23.70 per share.
About 1.3 million shares vested immediately, with the remainder vesting based on Amazon’s discretionary purchases, potentially up to $4 billion in total purchases over time.
This agreement signals Amazon’s strong confidence in AAOI’s technology and its critical role as a supplier of high-speed optical transceivers for Amazon Web Services and AI data center infrastructure.
The warrant price near $24 effectively sets a floor and a valuation benchmark, supporting the thesis that AAOI’s stock could reach or exceed this level by year-end.
2. Major Data Center Wins and Hyperscale Customer Re-Engagement
AAOI recently resumed shipments to a major hyperscale customer, with volume shipments of high-speed data center transceivers expected to ramp significantly in the second half of 2025.
This re-engagement with a key customer aligns with the surging demand for AI-driven data center infrastructure, providing a strong revenue growth catalyst.
3. Robust Revenue Growth and Margin Expansion
Q1 2025 revenue doubled year-over-year to nearly $100 million, with gross margins expanding to over 30%, reflecting operational efficiencies and favorable product mix.
The company expects to sustain strong quarterly revenue ($100–$110 million) and ramp production capacity to over 100,000 units of 800G transceivers per month by year-end, with 40% manufactured in the U.S.
4. Manufacturing Expansion and Supply Chain Resilience
AAOI is scaling manufacturing in the U.S. and Taiwan, enhancing supply chain robustness and positioning itself to benefit from potential government incentives for domestic production.
Its automated, largely in-house manufacturing capabilities provide a competitive edge in meeting hyperscale and AI data center demand.
In conclusion:
Amazon’s warrant agreement at a $23.70 strike price not only provides a direct valuation anchor near $24 but also serves as a powerful strategic endorsement of AAOI’s technology and growth prospects. Combined with robust revenue growth, expanding manufacturing capacity, and key customer re-engagement, AAOI has a compelling case to reach or exceed $24 per share by the end of 2025.

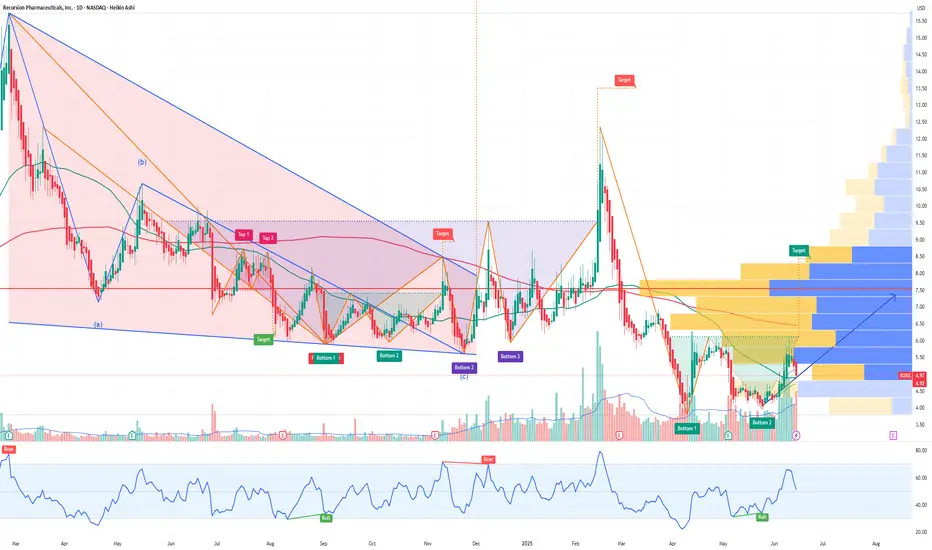
Why Recursion Pharmaceuticals RXRX Could Be the NVDA of BiotechRecursion Pharmaceuticals RXRX is rapidly emerging as a transformative force in drug discovery, leveraging cutting-edge artificial intelligence and automation to industrialize and accelerate the development of new medicines. Here’s why RXRX could be the next NVIDIA (NVDA) of biotechnology and why its stock could soar by year-end:
1. AI-Powered Drug Discovery Platform with Unmatched Scale
Recursion integrates AI, machine learning, automation, and advanced data science to decode biology and chemistry, dramatically reducing the time and cost of drug discovery.
The company’s proprietary BioHive-2 supercomputer, built with NVIDIA’s DGX H100 systems, is the most powerful AI computing system wholly owned by any biopharma company, enabling Recursion to process biological data at unprecedented speeds.
By reducing the number of compounds needed for clinical candidates from thousands to just 136–200 and shrinking development timelines to under a year, RXRX is fundamentally changing the economics of pharmaceutical R&D.
2. Strategic Partnerships and Industry Validation
RXRX has forged high-profile partnerships with pharmaceutical giants such as Bayer, Roche/Genentech, Takeda, and Sanofi, validating its platform and unlocking milestone payments that could exceed $20 billion over time.
The company’s collaboration with AI biotech Exscientia in a $700 million deal further cements its leadership in the AI-driven drug discovery space, creating a pipeline of 10 clinical and preclinical programs with hundreds of millions in potential milestones.
NVIDIA itself holds over 7.7 million shares of RXRX, making it one of NVIDIA’s largest biotech investments and a strong endorsement of Recursion’s technology and long-term vision.
3. Explosive Revenue Growth and Strong Cash Position
Analysts forecast Recursion’s revenue to grow at a 65% CAGR from $58.8 million in 2024 to $263 million by 2027, far outpacing the broader biotech sector.
The company ended 2024 with over $600 million in cash, providing a solid runway for continued investment in R&D, platform expansion, and clinical trials.
Wall Street analysts expect more than 50% upside in RXRX stock over the next 12–24 months, with multiple clinical milestones and partnership announcements as near-term catalysts.
4. Disruptive Vision: The “Virtual Cell” and Beyond
RXRX is building toward a “virtual cell,” where AI models can simulate biological processes with such accuracy that wet lab experiments shift from data generation to validating computational predictions.
This approach could dramatically improve drug development success rates, addressing the industry’s notorious 95% failure rate and positioning Recursion as the go-to platform for next-generation drug discovery.
5. Market Sentiment and Institutional Support
RXRX has caught the attention of growth investors and major funds, including Cathie Wood’s ARK Invest, further boosting its profile and liquidity.
Recent stock surges and high trading volumes reflect growing investor confidence in Recursion’s disruptive potential and the broader AI-in-biotech trend.
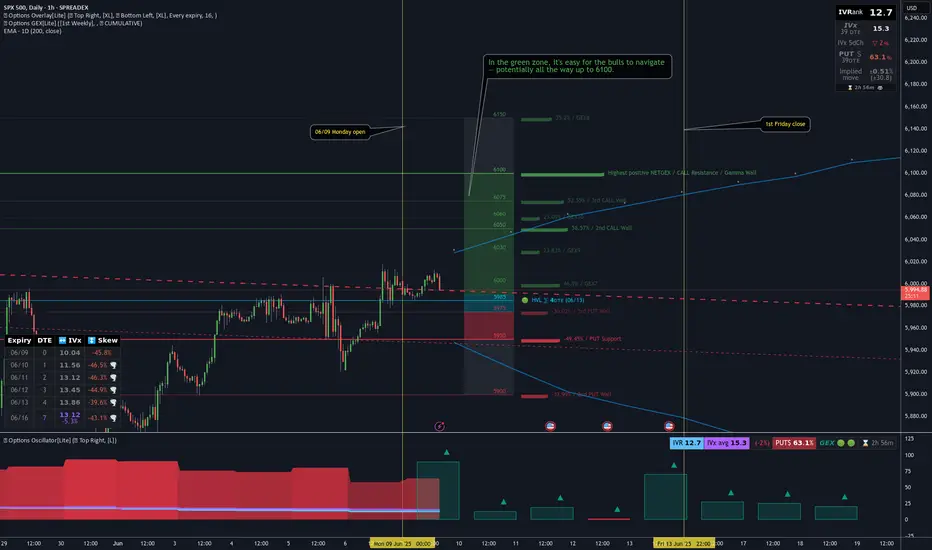
[06/09] [GEX] Weekly SPX OutlookLast week’s outlook played out quite well — as anticipated, SPX hit the 6000 level, closing exactly there on Friday. This was the realistic target we highlighted in last week's idea.
🔭 SPX: The Bigger Outlook
It's difficult to say whether the rising SPX trend will continue. We're still in the "90-day agreement period" set by the administration, and so far, the market has shown resilience, avoiding deeper pullbacks like the one we saw in April.
With VIX hovering around 17–18, we’ve reached a zone where further SPX upside would require volatility. For the index to continue rising meaningfully, it needs to reverse the current bearish macro environment, and that can only happen with strong buying momentum — not a slow grind.
The parallel downward channel drawn a few weeks ago is still technically valid. Even a short 100-point squeeze would fit within this structure before a larger move down unfolds.
GEX levels give us useful clues heading into Friday. We're currently in a net positive GEX zone across all expirations, giving bulls a structural advantage, just like last week.
As of Monday’s premarket, SPX spot is at 6009.The Gamma Flip zone is between 5975–5990, with a High Volume Level (HVL) at 5985.
🔍 Let’s zoom in with our GEX levels — this gives us a deeper view than our GEX Profile indicator for TradingView alone.
🐂 🟢 If SPX moves higher, the following are logical profit-taking zones:
6050 (Delta ≈ 33)
6075 (Delta ≈ 25)
6100 (Delta ≈ 17)
🎯 Targeting above 6100 currently feels irrational — for instance, the next major gamma squeeze zone is at 6150, but that corresponds to a delta 6 level (≈94% chance the price closes below it), so I won’t aim that high yet.
🐻🔴 In a bearish scenario:
5975 and 5950 are the first nearby support zones (Deltas 30 and 38).
If momentum picks up, 5900 becomes reachable quickly, even if it's technically a 17-delta distance — because that’s deep in the negative GEX zone.
📅 Don’t forget: On Wednesday premarket, we’ll get Core Inflation Rate data — a key macro risk that could shake things up, regardless of TSLA drama fading.
📌 SPX Weekly Trading Plan Conclusion
Whatever your bias, keep cheap downside hedges in place. We've been rising for a long time, and even if SPX breaks out of the descending channel temporarily, resistance and the gamma landscape may pull price back swiftly.
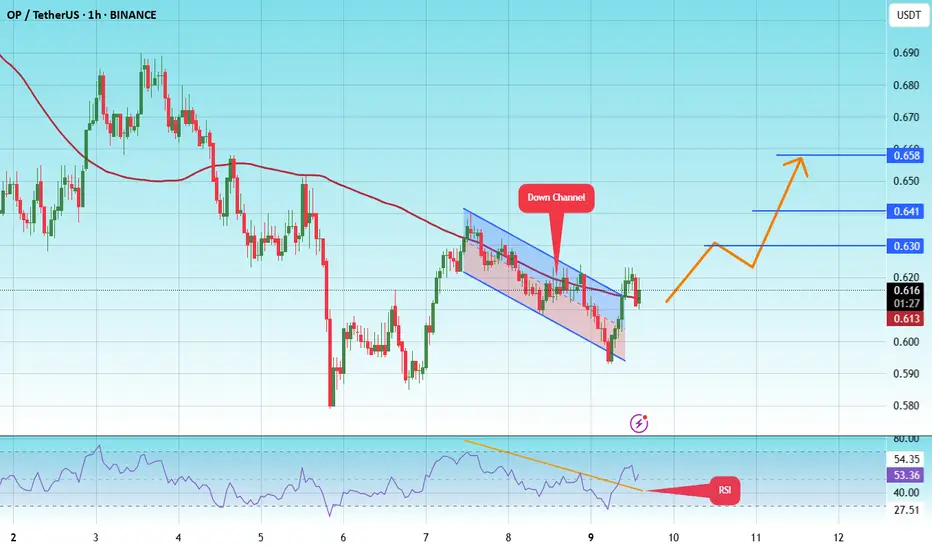
#OP/USDT#OP
The price is moving within a descending channel on the 1-hour frame and is expected to break and continue upward.
We have a trend to stabilize above the 100 moving average once again.
We have a downtrend on the RSI indicator that supports the upward move with a breakout.
We have a support area at the lower limit of the channel at 0.600, acting as strong support from which the price can rebound.
Entry price: 0.616
First target: 0.630
Second target: 0.641
Third target: 0.658
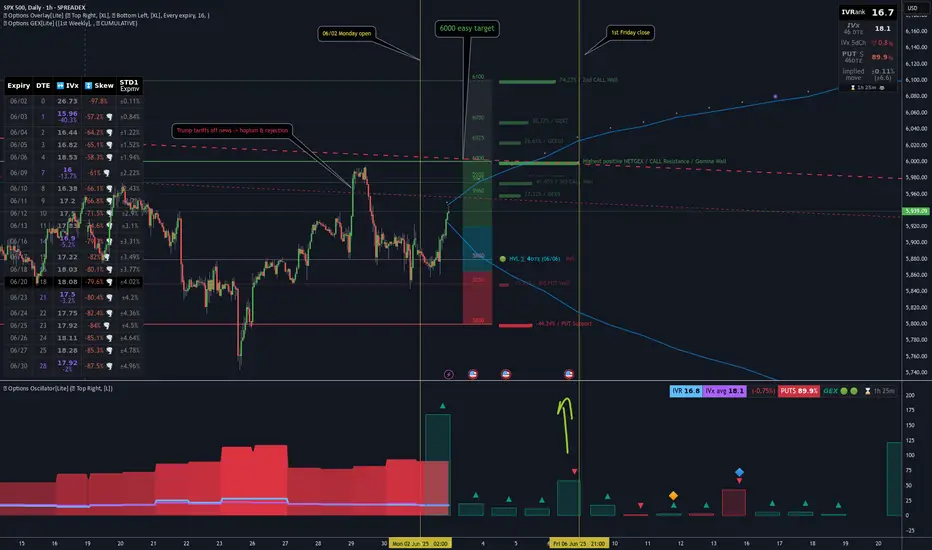
06/02 Weekly GEX Analysis - 6000 Looks EasyThe biggest event last week was undoubtedly the court ruling involving Trump. The market responded with optimism, and on Thursday premarket, SPX surged toward the 6000 level — only to get instantly rejected. That strong rejection suggests this is a firm resistance zone.
From the GEX expiry matrix, it's clear that the market is hedging upward for this week, but downward for next week. To me, this indicates that while the near-term GEX sentiment remains slightly bullish, the market may be preparing for a pullback or retest in the medium term.
This week, SPX has already entered a GEX zone surrounded by positive strikes — up to around the 6000 level. That makes 6000 an “easy target” for bulls, and we’ll likely see profit-taking here, just like we did last Thursday premarket.
⚠️ However, if we look more closely at the weekly net open interest:
...we can see a strong bullish net OI build-up starting to emerge around the 6100 level — a price zone that currently feels distant and even unreachable. But if the 6000 resistance breaks, we could see a fast gamma-driven squeeze up to 6050 and possibly 6100 before the next wave of profit-taking kicks in.
As is often the case during bullish moves, the market seems blind to the bigger picture — no one’s looking down, only up. The mood is greedy, and momentum favors the bulls... for now.
Never underestimate FOMO — but also never underestimate Trump. He’s unlikely to accept the court’s decision on tariffs quietly. Any new negative headline could shake the market, no matter where price is sitting…
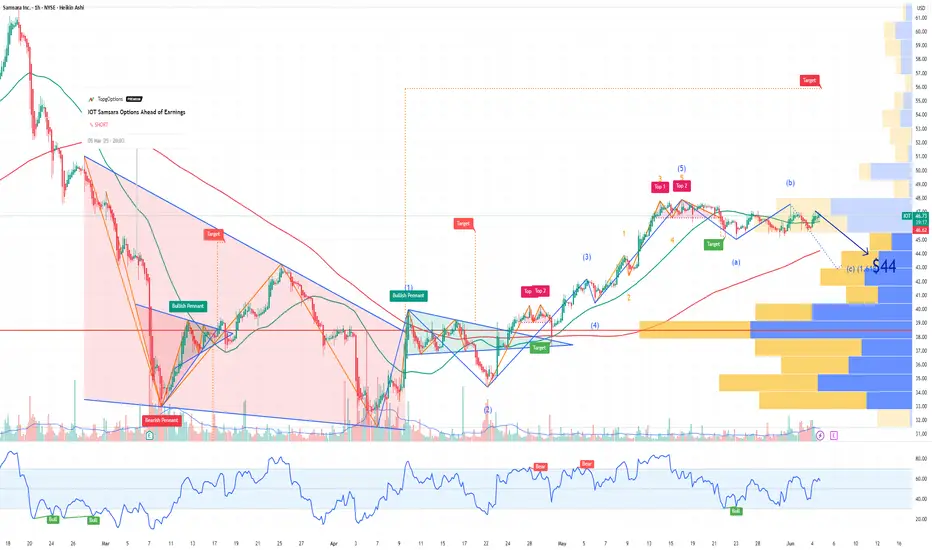
IOT Samsara Options Ahead of EarningsIf you haven`t sold IOT before the previous earnings:
Now analyzing the options chain and the chart patterns of IOT Samsara prior to the earnings report this week,
I would consider purchasing the 44usd strike price Puts with
an expiration date of 2025-6-6,
for a premium of approximately $1.90.
If these options prove to be profitable prior to the earnings release, I would sell at least half of them.