OP Analysishello guys
We carefully analyzed this coin for you and determined the purchase areas and price targets.
If you are risk-taking, you can buy a step right here, otherwise, the two specified ranges in the case of a pullback are the ranges where we expect the price to move from there to the specified targets.
I am happy to support and follow us.
be successful and profitable
OPUSDT
OPUSDT
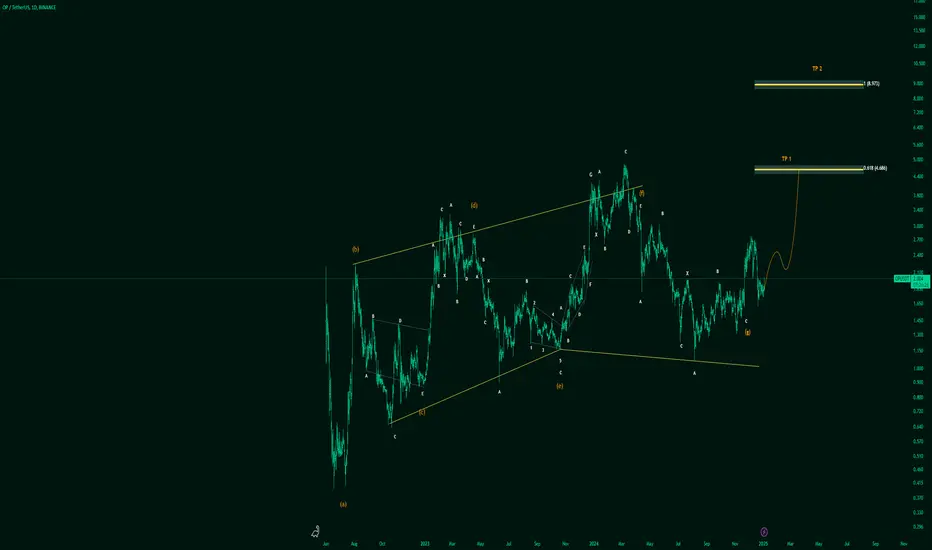
Diamond Pattern and Price Movement:
This pattern, classified as a Diametric, signifies the completion of a corrective cycle and heralds the beginning of a new upward wave and bullish phase. The (g) wave has been identified as the final phase of this pattern.
Key Levels:
Optimal Entry Zone: Between $1.80 and $2.00.
Short-Term Price Targets:
Target 1: Around $3.30.
Target 2: Around $4.50.
Long-Term Price Target:
If the bullish structure is maintained, it is anticipated that the price may reach the $8.50 level within the next 250 days.
Opulous ($OPUSDT): Bullish Setup for a Strong Move
I spend time researching and finding the best entries and setups, so make sure to boost and follow for more.
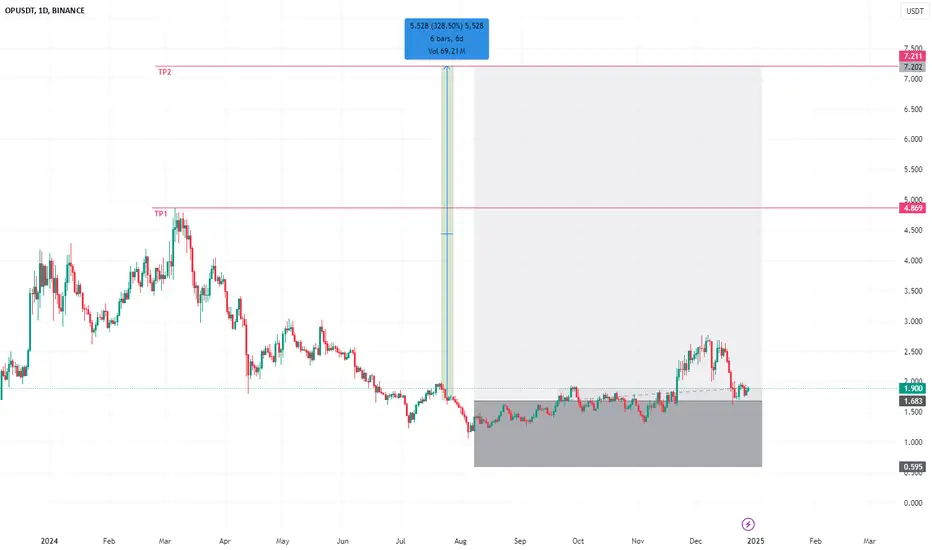
Opulous ( BINANCE:OPUSDT BINANCE:OPUSDT ): Bullish Setup for a Strong Move
Trade Setup:
- Entry Price: $1.686 (Activated)
- Stop-Loss: $0.595
- Take-Profit Target:
- TP: $5.145
Fundamental Analysis:
Opulous ( BINANCE:OPUSDT BINANCE:OPUSDT ) is a revolutionary platform combining decentralized finance (DeFi) with the music industry. It enables artists to mint music as NFTs, allowing fans to invest directly in their favourite creators. This innovative approach to music rights and revenue sharing is gaining traction, with BINANCE:OPUSDT positioned as a key player in the growing MusicFi sector.
Recent partnerships and collaborations with global artists have further enhanced its visibility, making BINANCE:OPUSDT BINANCE:OPUSDT a token to watch in 2024.
Tokenomics Overview:
- Total Supply: 500 million BINANCE:OPUSDT tokens.
- Key Utility: Facilitates transactions for music NFTs and DeFi staking.
- Community Growth: Rapidly expanding user base with increasing NFT volume.
Technical Analysis (Daily Timeframe):
- Current Price: $1.898
- Moving Averages:
- 50-EMA: $1.700
- 200-EMA: $1.500
- Relative Strength Index (RSI): Currently at 65, reflecting bullish momentum nearing overbought levels.
- Support and Resistance Levels:
- Support: $1.600
- Resistance: $2.000
The price action indicates that BINANCE:OPUSDT BINANCE:OPUSDT is on a bullish trajectory, having already activated the entry level at $1.686. With strong support at $1.600, the token is poised for a breakout toward the take-profit target of $5.145.
Market Sentiment:
Community engagement around Opulous remains high, with significant interest in its MusicFi use cases. Social media chatter and increasing trading volume reflect growing confidence in its long-term potential.
Risk Management:
A stop-loss at $0.595 limits downside risk while allowing room for volatility. The take-profit target offers a massive **205% return** from the entry point, making this a high-reward setup for mid- to long-term traders.
Key Takeaways:
- BINANCE:OPUSDT ’s innovative approach to music rights through NFTs positions it as a leader in the emerging MusicFi sector.
- The trade setup offers an excellent risk-to-reward ratio, aligning with the token’s bullish momentum.
- Long-term holders could benefit significantly from this breakout opportunity.
When the Market’s Call, We Stand Tall. Bull or Bear, We’ll Brave It All!
*Disclaimer: This analysis is for informational purposes only and does not constitute financial advice. Traders should conduct their own due diligence before making investment decisions.*
OPUSDT 5DOP ~ 5D
#OP If you still have Conviction on the coin,. Buy gradually within this support block,. with a minimum target of 20++
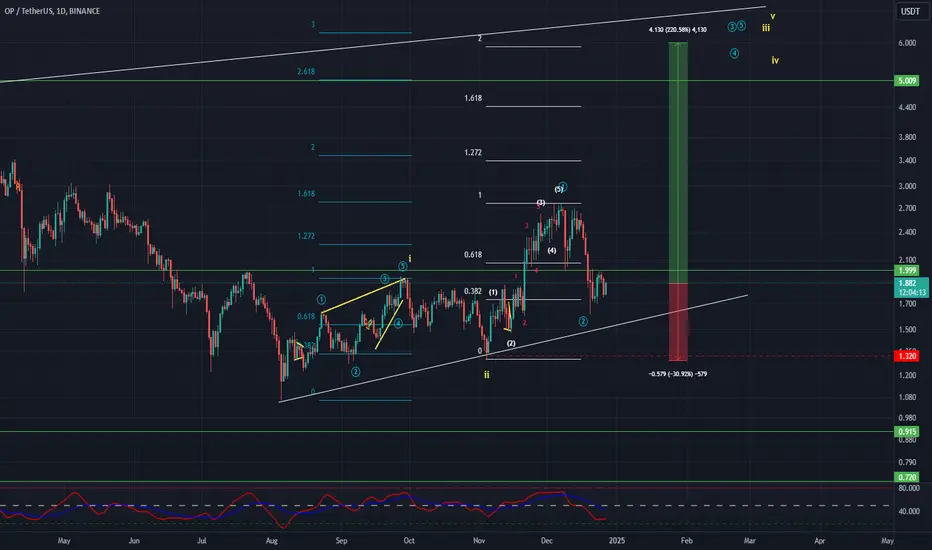
OPUSDT Elliott Waves AnalysisHello friends.
Please support my work by clicking the LIKE button👍(If you liked).
Everything on the chart.
Entry zone: market and lower
Targets: 3 - 4.5 - 6
after first target reached move ur stop to breakeven
Stop: under 1.3 (depending of ur risk).
ALWAYS follow ur RM
risk is justified
It's not financial advice.
DYOR!
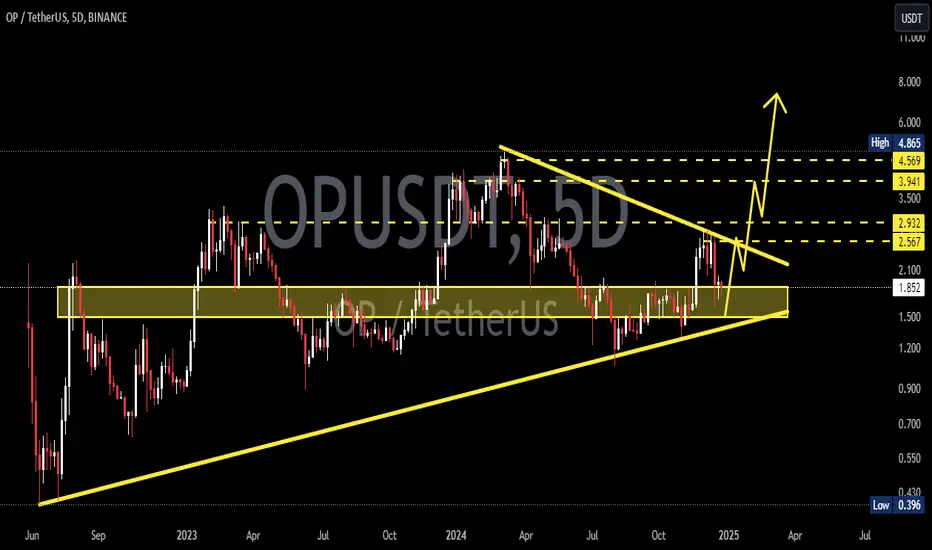
Optimism (OP):The Hidden Gem Poised for a 5x Rally—Don't Miss A tempting investment possibility, the OP/USDT chart shows a good potential for significant increase in the next bull run. This is a thorough analysis:
### **Main Points of Interest** 1. **Levels of Support and Resistance:**
The present price of $1.804 indicates a good entry point because it is close to the strong support zone at $1.965.
- The following key resistance levels—$2.10, $2.54, $2.97, and $3.43—indicate possible short-term price goals.
- A far bigger rise could begin if the price breaks above $3.43.
The price is closely interacting with the 200-day EMA ($1.969) and 50-day EMA ($2.102), as shown in **Moving Averages (EMA):**. A well-known bullish indication is the "Golden Cross" situation, which occurs when the shorter EMA crosses over the longer EMA.
A breakout might be fueled by a robust rebound from these levels.
Index of Relative Strength (RSI):
Right now, the RSI is hovering close to the neutral zone at 47.24. This indicates that there is potential for substantial upside momentum as purchasing pressure increases because the asset is neither overbought nor oversold.
Analysis of Volume:
Growing investor interest is indicated by a recent increase in trading volume. Such volume spikes typically occur before price breakouts.
Historical Trends:
The OP/USDT saw tremendous increase from comparable levels during the previous bull cycle, swiftly hitting new highs. If this pattern continues, it might reach more than $10.
Bullish Projections: OP/USDT might rise to $10 or higher in the event of a larger market bull run, which would be more than a five-fold return from current levels. The asset presents a great chance for long-term growth due to its technical positioning and solid fundamentals.
Investment Plan:
Short-Term Goal: $2.10–$3.43 (low resistance breakout levels)
Target for the medium term: $5–$7.00 (strong resistance areas in prior rallies)
Long-Term Goal: $10 or more (possible goal for the next bull market high)
Appeal to Investors:
OP/USDT is a high-upside investment because to its current undervaluation and track record of outperforming in bullish markets. It is a desirable asset for both short-term traders and long-term holders because of the possibility of exponential returns and the controllable downside risk brought about by solid support.
Dollar Cost Averaging, or DCA, in a Strategic Investment Plan:
Build a position gradually to reduce the risks associated with short-term volatility. During dips, increase your allocation to the $1.70–$1.80 area.
Hold Long Term, or HODL:
A long-term holding strategy might generate significant profits due to OP's solid fundamentals and alignment with upcoming market trends.
Opportunities for Active Trading:
For the long-term bull case, use swing trading around the resistance levels while maintaining a core position.
Next Steps
Monitor key metrics such as:
On-chain activity (TVL, daily transactions)
Exchange inflow/outflow data
Social sentiment indicators
Place alerts for breakout above $2.10 and $3.43.
Review quarterly development updates from the Optimism Foundation for news on network upgrades or partnerships.

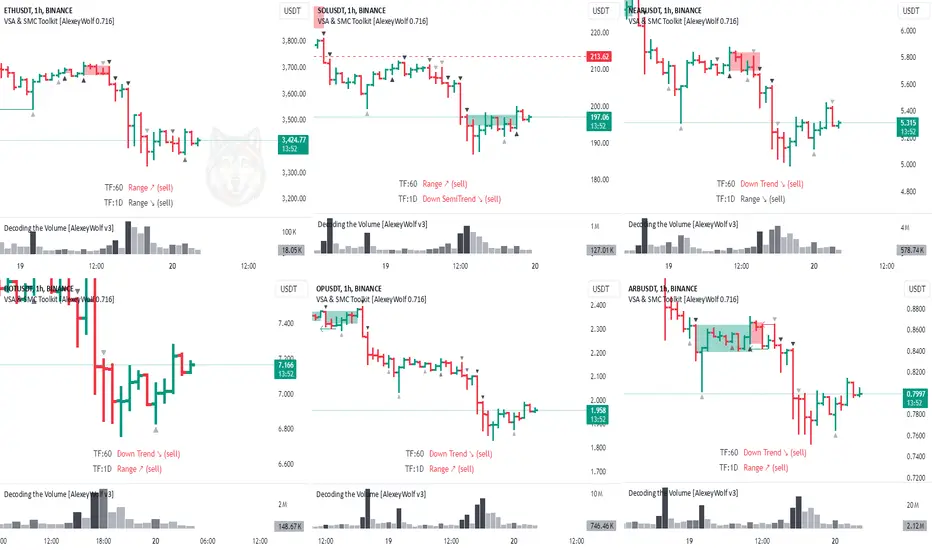
The correction in crypto assetsHey traders and investors!
The correction in crypto assets continues.
You can look for selling opportunities (for example, in futures) on these assets, as both the daily and hourly timeframes favor the sellers.
Stop-losses are a must!
If buyers on these assets (OPUSDT, ARBUSDT, DOTUSDT) buy up the daily bar from December 19, the priority will shift to purchases.
I wish you profitable trades.
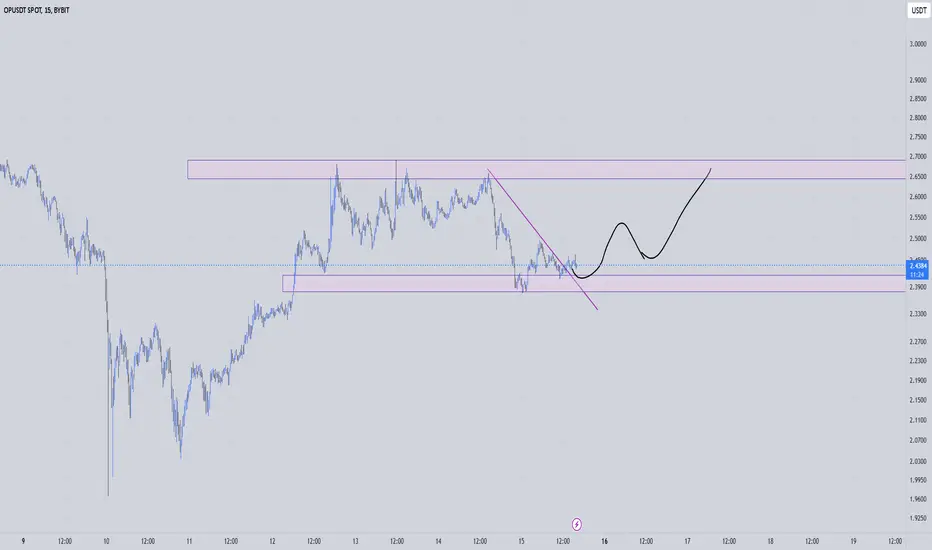
#OP/USDT Ready to launch upwards#OP
The price is moving in a descending channel on the 1-hour frame and sticking to it well
We have a bounce from the lower limit of the descending channel, this support is at 2.10
We have a downtrend on the RSI indicator that is about to break, which supports the rise
We have a trend to stabilize above the moving average 100
Entry price 2.17
First target 2.28
Second target 2.40
Third target 2.60

op idea"🌟 Welcome to Golden Candle! 🌟
We're a team of 📈 passionate traders 📉 who love sharing our 🔍 technical analysis insights 🔎 with the TradingView community. 🌎
Our goal is to provide 💡 valuable perspectives 💡 on market trends and patterns, but 🚫 please note that our analyses are not intended as buy or sell recommendations. 🚫
Instead, they reflect our own 💭 personal attitudes and thoughts. 💭
Follow along and 📚 learn 📚 from our analyses! 📊💡"
Optimism OP price analysis#OP price has stopped before a strong mirror level of $2.85-3
📊 For confident growth to continue, the OKX:OPUSDT needs to consolidate above this mirror level.
1️⃣ Local target - $3.30
2️⃣ Medium-term - $4.20-4.30
_____________________
Did you like our analysis? Leave a comment, like, and follow to get more

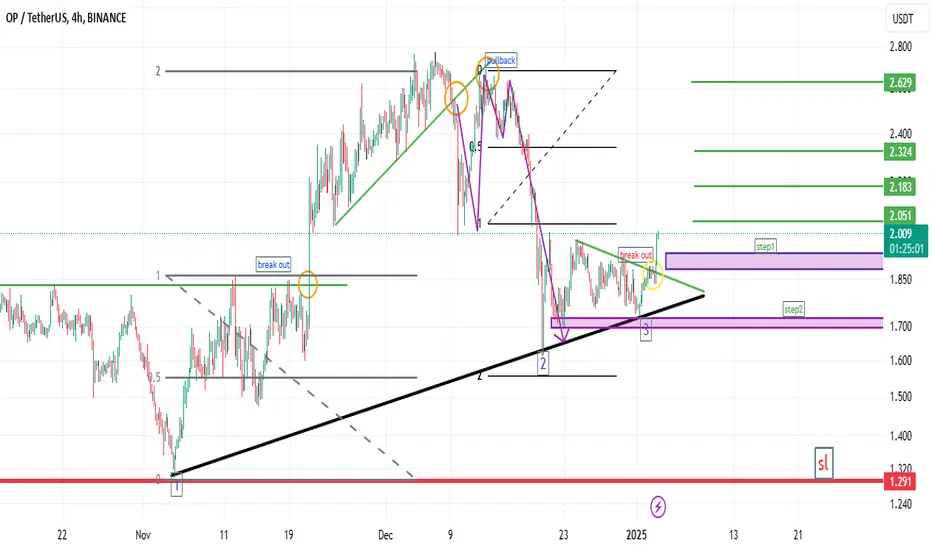
TradeCityPro | OPUSDT Analysis Prepare Your Bullish Triggers!👋 Welcome to TradeCityPro Channel!
Let’s dive into the market and analyze OPUSDT, focusing on a detailed breakdown of its structure. Remember, those who stay calm and manage their emotions during market corrections are the ones who profit big in the bull run.
🌍 Market Overview
As always, we start with Bitcoin. Currently, it’s undergoing a minor pullback with hourly red candles and good volume. However, this is a positive development as it signals a potential pullback in Bitcoin dominance, possibly forming a lower high on the daily timeframe—a bullish indicator for altcoins.
Currently, Bitcoin is fluctuating around the 94,660 support. If this level is broken and Bitcoin moves toward 91,000 with a rising dominance, altcoins could see another 20-30% drop.
🕒 Weekly Time Frame
OP is a relatively new coin, part of the Layer 2 category, and hasn’t experienced a bull run yet.
The weekly candle shows a strong rejection at 2.688, making it a better resistance level than the previous 3.016. This rejection also enhances the significance of the 2.688 entry point.
Additionally, there’s a hidden trendline that has acted as support in the past, and after breaking it, the price pulled back. It has rejected this level again, suggesting potential future significance.
For safer entries, wait for support confirmation on lower timeframes or a breakout above 2.688. If you already bought at the 1.93 breakout, hold your position and remain patient.
📊 Daily Time Frame
On the daily chart, after breaking out of the accumulation box between 1.324 and 1.833, the price moved the size of the box to reach its first target (R:R 1). From there, it faced a heavy rejection.
pullback to the 1.833 support seems logical as this level aligns with the 50% Fibonacci retracement and Dow Theory principles. Confirmation on lower timeframes could signal a bullish reversal.
For now, wait for the downward momentum to fade before planning new entries. If the market moves sharply upward, this could introduce strong bullish momentum, allowing for higher-risk entries.
🕒 4-Hour Time Frame
On the 4-hour chart, the coin broke a rising trendline, leading to a drop. I personally didn’t open any short positions, nor would I recommend them in this context.
If 2.049 support is broken and Bitcoin dominance rises, the price could drop further to 1.833. Decision-making at that level will be key.
📈 Long Position Trigger
if the price ranges between 2.049 and 2.283 and starts gaining bullish momentum, a breakout above 2.283 with increasing volume would offer an early entry opportunity.
📉 Short Position Trigger
while breaking 2.049 might seem like a trigger, I still don’t recommend it. If you choose to short, watch the RSI, which is deeply oversold.
💡 BTC Pair Insight
In the current conditions, the Bitcoin pair (OPBTC) might not hold much significance. Coins that have either not dropped much or completed healthy corrections with declining bearish momentum are more favorable.
For OPBTC, the key trigger would be a breakout above 0.00002975, which could signal the start of its upward move in a bullish market.
📝 Final Thoughts
Stay calm, trade wisely, and let's capture the market's best opportunities!
This analysis reflects our opinions and is not financial advice.
Share your thoughts in the comments, and don’t forget to share this analysis with your friends! ❤️

OPUSDT - potential project ... Great targetsWeekly chart displays :
- Consolidation a massive Ascending channel since 870days
-breakout the double bottom pattern
- breakout , retest of the 0.5 fibo level
OP has strong project 8$ is my midterm target
Best regards Ceciliones 🎯

OPU the Lone Fighter - Mooning when? Soon!“Curious about the full picture? A small hint lies in my about section.”
OPUUUU looks like a lone ranger, the RED line is where we add more of OPU, stops at 0.214 and expecting a FAT heavy green candle till 3.024 till 3.2. Observe, would add more at the stops for me!

Weekly Crypto Facts: What to expect next?Hello traders and investors!
Last week saw several interesting developments in crypto assets that may influence the situation in the coming days.
BTC : The breakout impulse from the range on the weekly timeframe continues. This marks the fourth weekly consecutive bullish candle, with declining volume (!) compared to the previous three. This could indicate a lack of interest from both buyers and sellers at these price levels. We might see a consolidation period. A similar situation occurred recently on the daily timeframe, where consolidation lasted for six days before a new buying impulse formed (see the post from November 15). Note that the key candle for the breakout is now from November 11.
DOT : The price formed a buyer's impulse on the weekly timeframe, surpassing 6.611 (the starting level of the last seller's impulse on the weekly chart). The volume and spread of the weekly candle are impressive. It’s possible that the price may rise further without a correction. If there is a pullback to 7.775–8 and the buyer resumes, it could present a buying opportunity.
OP : The price broke out above the range’s upper boundary on the weekly timeframe (1.989). The weekly candle’s volume and spread are impressive. On the daily chart, the price has been consolidating above 1.989 for three days. We are watching for the price’s reaction to 1.989—whether the buyer will defend the breakout from the range. The key candle of the last buying impulse on the daily chart from November 21 crosses 1.989. If the seller pushes the price back into the range and defends this return (at 1.989), it could be an opportunity to look for short positions.
SOL : The price updated its all-time high at 259.9. The weekly candle’s volume is declining, which may indicate a lack of interest from both buyers and sellers at these levels. A consolidation period could be ahead. We will assess the seller's reaction by the end of this week.
TON : Factors have emerged favoring the realization of the buyer’s vector within the range on the weekly timeframe, with a target of 7.260.
Good luck with your trading and investments!

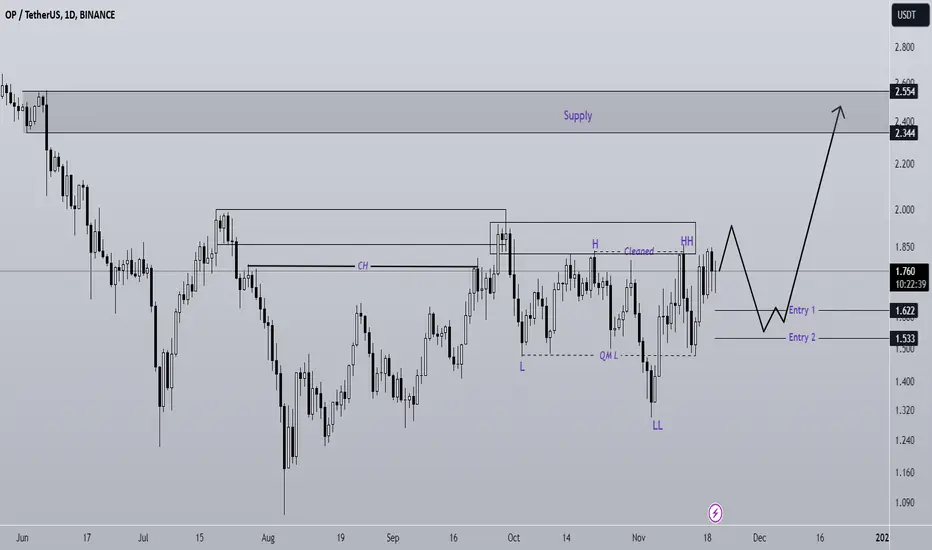
OP is bullish (1D)On the chart, we have both a bullish iCH and a bullish QM.
If the price returns to the bottom, we are looking for buy/long in the specified range of ENTRY.
Closing a daily candle below the invalidation level will violate this analysis
Do not enter the position without capital management and stop setting
Comment if you have any questions
thank you
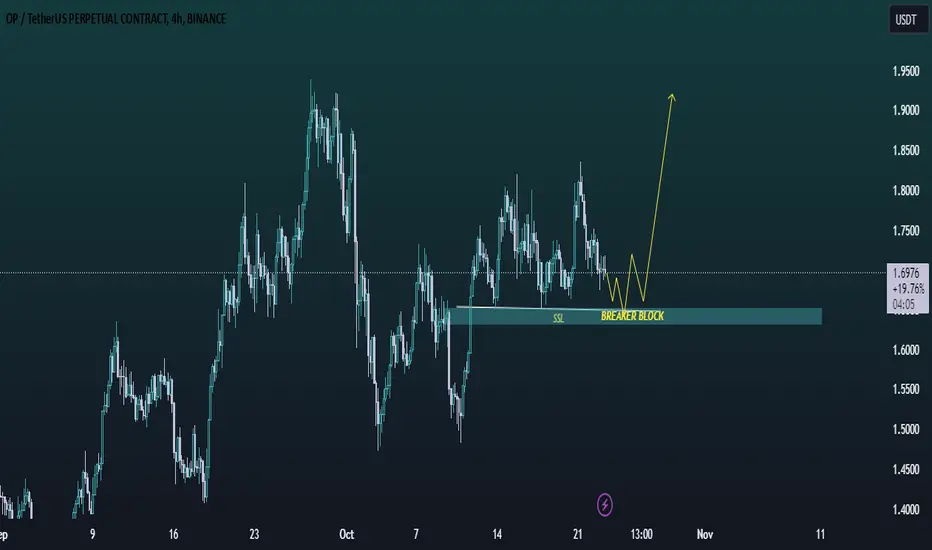
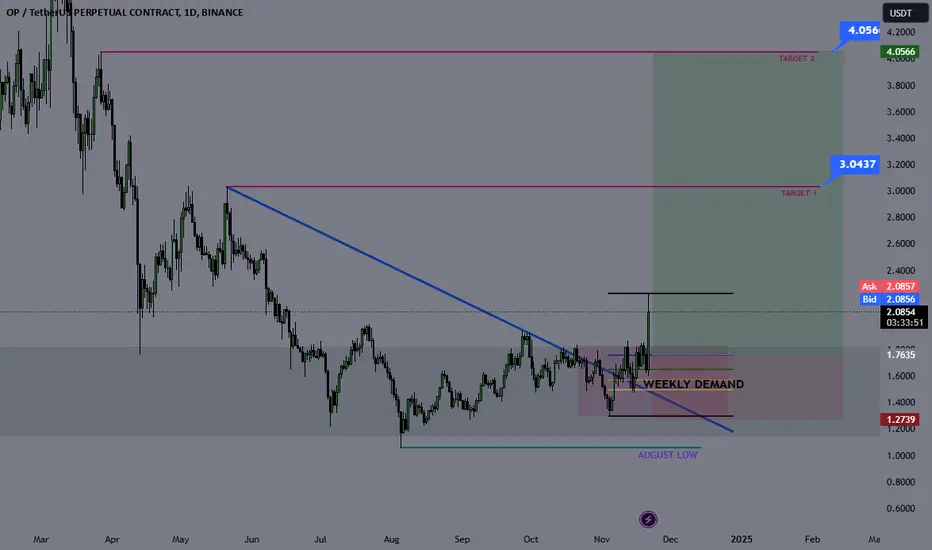
Optimisim Swing Long Idea - OP COIN LONGPrice has run the monthly liquidity, creating upward momentum and breaking the weekly bearish trend. Recently, we broke the bearish trendline that had been driving the bearish movement since Spring 2024. The price closed above the trendline, retested it, and then rejected strongly.
Currently, the price is moving impulsively upward as ETH gains bullish momentum.
I’ll be looking to open long positions within the weekly demand zone marked on the chart. I don’t expect another retest of the trendline, as we’ve already retested it and seen a solid rejection.
I’ll seek LTF confirmations before engaging with the price.
Stop-loss: Daily close below $1.27
Target 1: $3.04
Target 2: $4.05
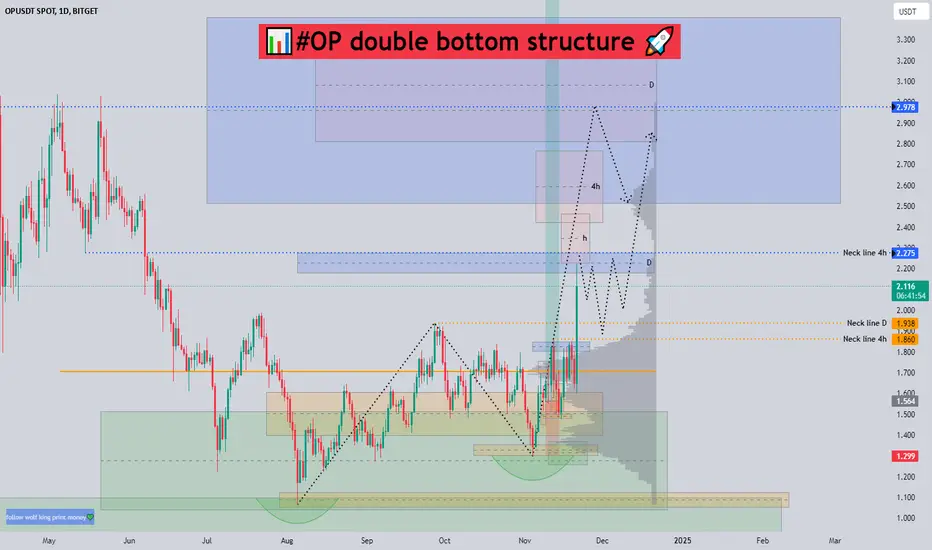
#OP double bottom structure 📊#OP double bottom structure 🚀
🧠From a structural perspective, we have a bullish double bottom structure constructed within the daily level buy zone, and therefore we are about to start a new uptrend.
➡️At present, we have reached the staged resistance zone, and it is reasonable to fall back after being blocked, so we have also made simultaneous reductions here. The neckline support zone below will be an area worthy of our attention, if such a callback occurs. .
Let’s see 👀
🤜If you like my analysis, please like 💖and share it💬
💕 Follow me so you don't miss out on any signals and analyze 💯
BITGET:OPUSDT
OP EXPANSION IS COMING BULLISHHi,
#opusdt is one the verge of a breakout. 130 days of consolidation is done here and now it's the right time to get out of this cagey range. #opusdt is going to break it's all time high in coming weeks and months.
buy $1.70-$1.60
invalidation $1.35
get out $4 - $5.5 - $6.5
let's wait and see.

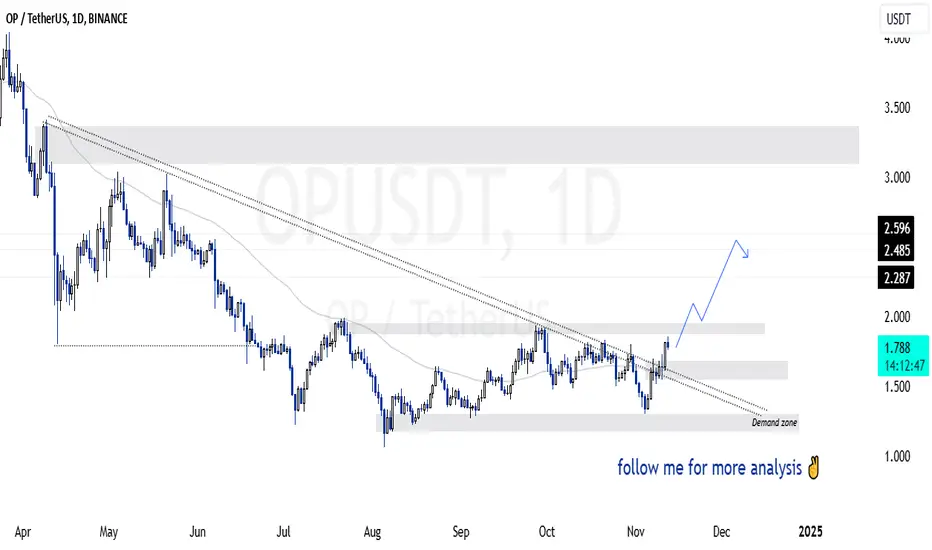
SasanSeifi| Bullish Trend Building as $1.90 Holds!Hey there, ✌ In the daily time frame, as you can see, the price of BINANCE:OPUSDT has been oscillating with a slight increase after holding the $1 level for a relatively long period. After an initial rise and hitting a supply zone, the price has returned to the demand zone around $1 and, after reaching this level, we have witnessed another slight increase.
Currently, as shown in the chart, the long-term downward trendline has been broken in the daily time frame, and the price is moving toward the $2 level. This break in the downtrend could indicate a potential trend reversal and the beginning of a new upward movement. Considering the overall market conditions and existing demand, the likelihood of continued price growth in the short and medium term has increased.
One scenario we can consider is that if the price stabilizes above the supply zone, which is currently near the $1.90 level, we can expect OP to move toward higher levels. In this case, mid-term and long-term price targets could range from $2.20, $2.50, to even $3. The key support zone on the daily time frame for OP is at the $1.50 level.
💢 Please remember that this is just my personal viewpoint and should not be taken as investment advice. I’d love to hear your thoughts and share opinions!
Happy trading!✌😎
Sure, if you have any more questions or need further clarification, feel free to ask. I'm here to help!✌
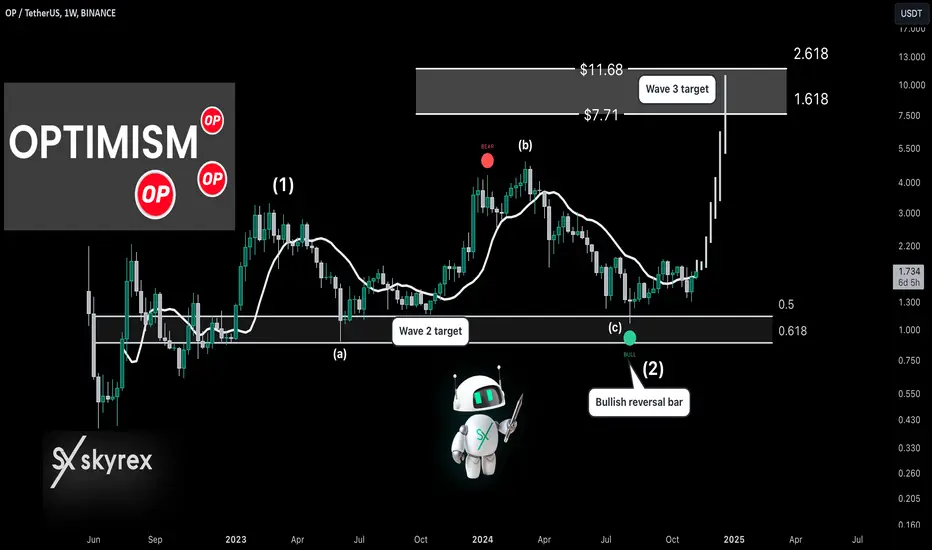
Optimism OP Became Optimistic AgainHello, Skyrexians!
We continue analyze altcoins with big potential for the bull market. Couple of days ago we have already observed another one layer 2, today it's time for BINANCE:OPUSDT . Price of this crypto formed very interesting formation which can confuse most of traders. We analyzed it using the combination of Elliott waves analysis with our algorithmic indicators. Hope it will give you enough knowledge to make your own decision.
On the price chart you can see the weekly time frame. We can consider all movements as the large accumulation zone because Optimism appeared in the most severe stage of past bear market. Its first growth is more likely to be the wave 1. After that we can see almost the same formation as for Arbitrum. This is the irregular correction in the wave 2, which consists of ABC waves.
Wave C is likely to be finished. It touched the 0.61 Fibonacci retracement zone and Bullish/Bearish Reversal Bar Indicator printed the green dot. This is very high probability long setup. You can see earlier on the chart that this indicator flashed the red dot and after that we have see the huge bearish wave. We need to pay attention to its signals.
The next potential move is the global wave 3. It can happen very fast and the target for it is defined by the Fibonacci extension. This is the zone between $7.71 and $11.68. Lower band of the zone is almost 10x from the current price.
Best regards,
Skyrexio Team
___________________________________________________________
Please, boost this article and subscribe our page if you like analysis!
op goes to $32gm,
read that title again, and let it sink in.
---
optimism has been expanding extremely quickly over the last year,,,
from large players like coinbase creating base on the chain,
to a conglomerate like sony in the works of creating soneium...
this is a rapidly growing chain, and there are incredible builders creating something truly magnificent as we progress into the future.
---
optimism to me personally looks really good.
there are a few ways i can label it, but this particular way is currently my favorite way, and it's is the "conservative" way.
---
my conservative upside target on this project sits at $32 near the height of the upcoming alt-season.
i do predict that it will most certainly go higher after, but that'll be an extreme which will be more than worthy of selling into.
---
tldr; op to $32 as alt season begins.

beautiful chart on opusdtso you see a great trend if you look at my finger pointing icons that identify the double bottom before the pump. you see the perfect consolidation after the falling wedge. which built a solid foundation for a support for op to be a strong investment.
