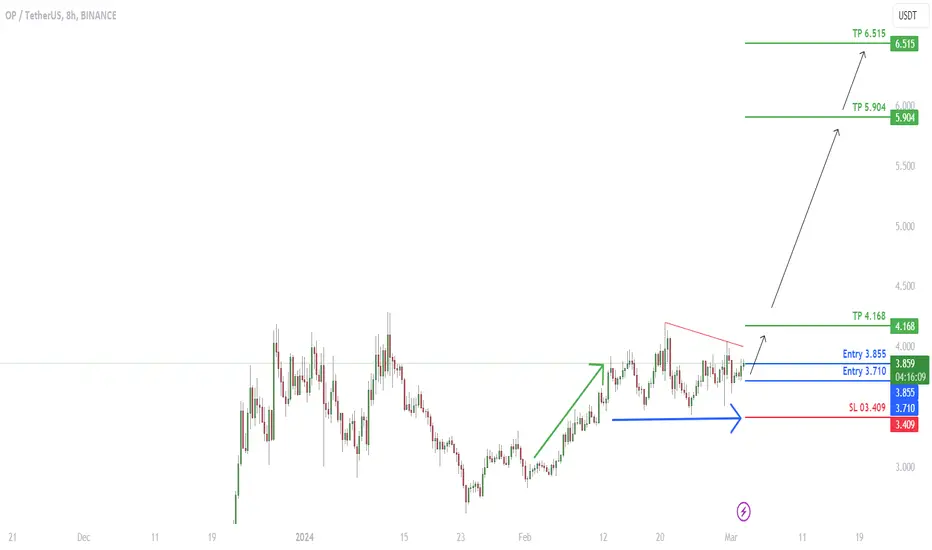
OP after breaking above the range bound will continue to go upOP after breaking above the range bound will continue to go up
🔵Entry Zone 3.710 - 3.855
🔴SL 03.409
🟢TP1 4.168
🟢TP2 5.904
🟢TP3 6.515
Risk Warning
Trading Forex, CFDs, Crypto, Futures, and Stocks involve a risk of loss. Please consider carefully if such trading is appropriate for you. Past performance is not indicative of future results.
If you liked our ideas, please support us with your likes 👍 and comments.
OPUSDT
OPUSDTHi guys
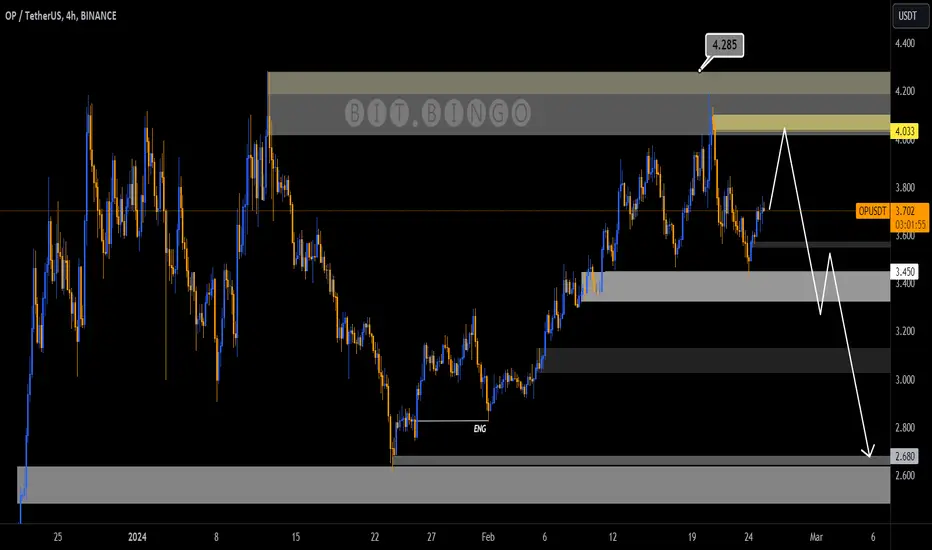
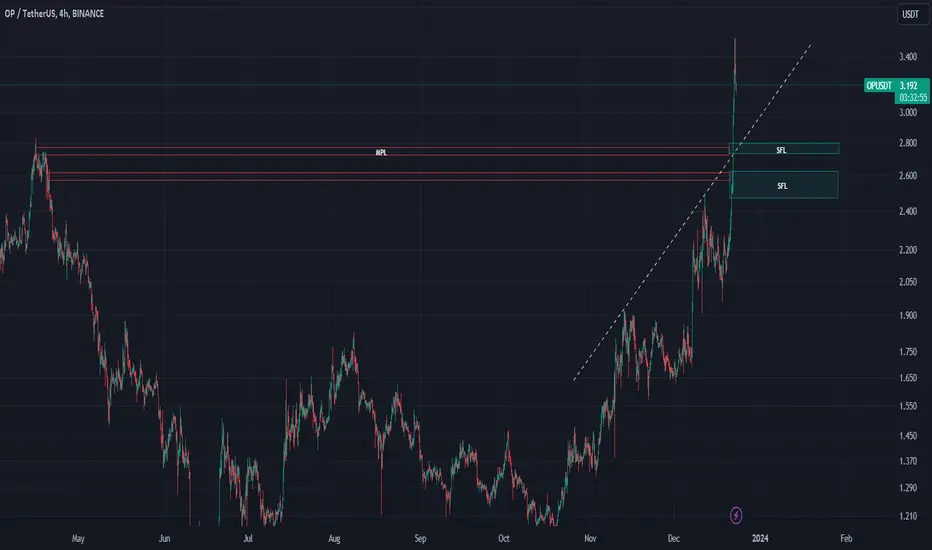
Our support areas have been well maintained so far. But note that our resistance areas are also reserved.
It seems that we can enter into an attractive selling deal relative to the $4.033 range, provided that the $4.285 resistance zone is maintained.
What do you think?
Optimism $3.80 ➥ First target $10-$12Optimism $3.80 ➥ First target $10-$12
Entry price: $3.80
Stop Loss: $3.7065
First target $10-$12

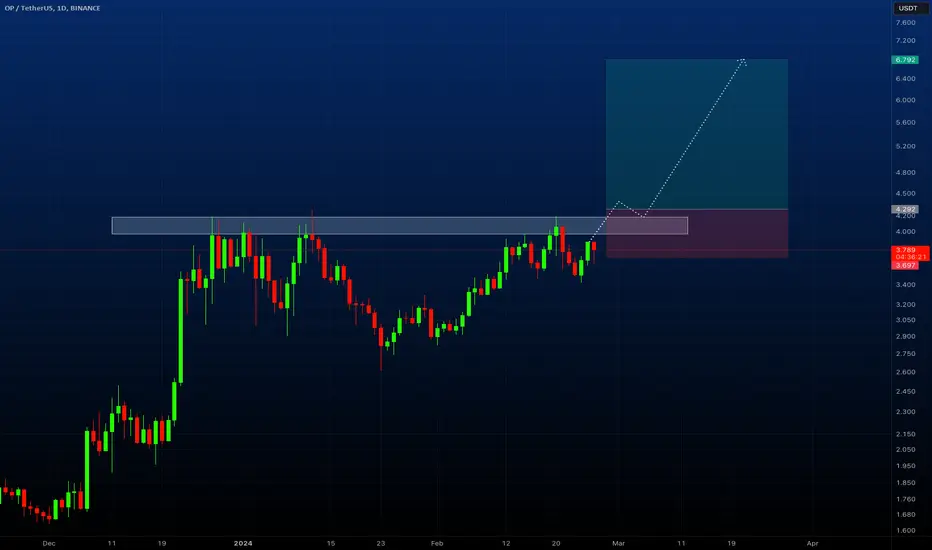
OP - Breakout waiting to happenBINANCE:OPUSDT (1DH CHART) Technical Analysis Update
OP is currently trading at $3.777 and showing overall bullish sentiment and waiting to breakout from the resistance zone.
Breakout from the resistance zone will definitely fuel to bull run of the OP. OP is also one of the fundamentally strong coin so we cannot go wrong with the LONG entry for this coin while we wait for bull run continue.
Entry level: $ 4.292 (candle close above this)
Stop loss level: $ 3.697
Target 1: $ 4.597
Target 2: $ 5.061
Target 3: $ 5.571
Target 4: $ 6.610
Target 5: 6.792
Max Leverage: 2x
Don't forget to keep stop loss.
Follow Our TradingView Account for More Technical Analysis Updates, | Like, Share and Comment Your thoughts.
Cheers
GreenCrypto
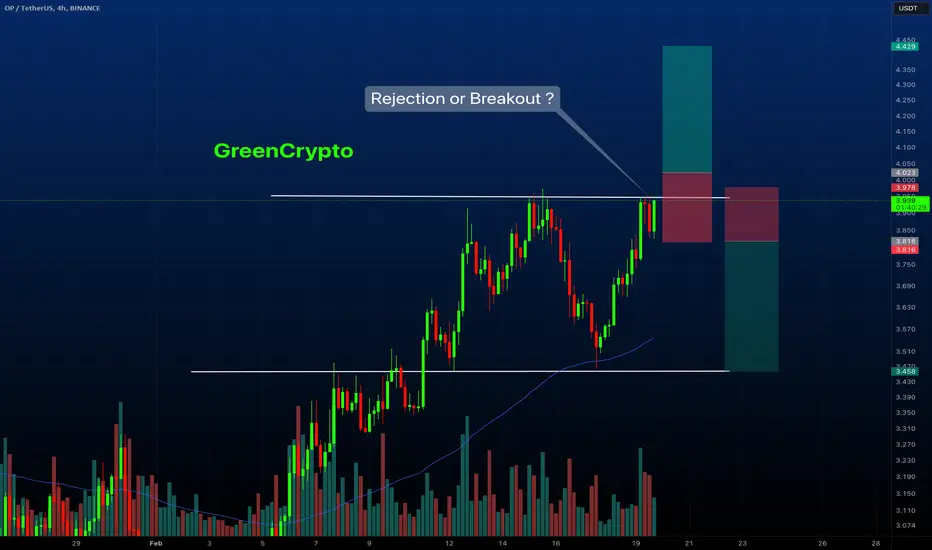
Rejection or Breakout for OP/USDT ? BINANCE:OPUSDT (4H CHART) Technical Analysis Update
OP is currently trading at $ and currently price is at the resistance line
We can expect price to either breakout from the resistance or get rejected from the resistance. We will enter trade based on whether price will get rejected or not.
LONG Trade Details (only after confirmed Breakout)
Entry level: $ 4.023
Stop loss level: $ 3.818
Target 1: $ 4.122
Target 2: $ 4.217
Target 3: $ 4.429
SHORT Trade Details (only after confirmed Rejection
Entry level: $ 3.818
Stop loss level: $ 3.978
Target 1: $3.723
Target 2: $3.623
Target 3: $3.458
Max Leverage: 5x
Stay tuned for updates on breakout or rejection.
Don't forget to keep stop loss.
Follow Our TradingView Account for More Technical Analysis Updates, | Like, Share and Comment Your thoughts.
Cheers
GreenCrypto
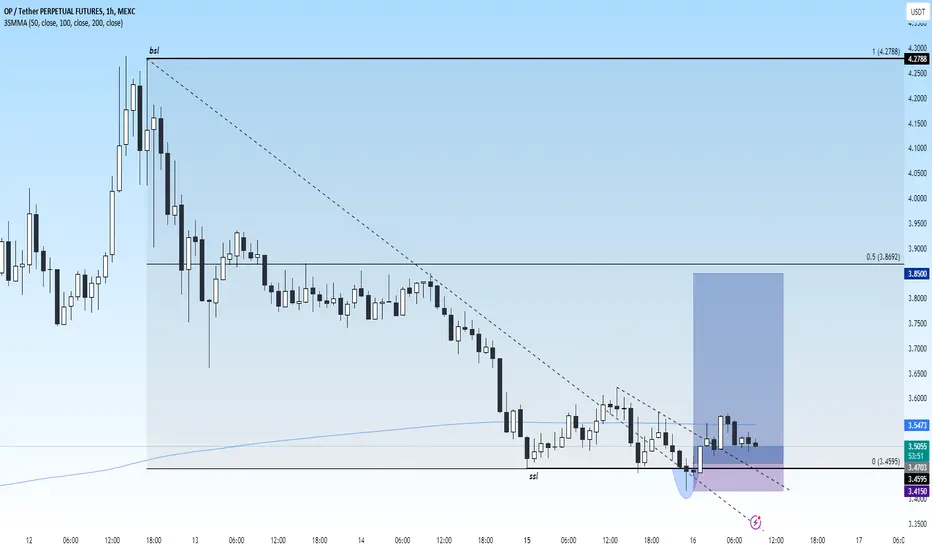
Alikze → #OP | Pullback to broken resistance In time h1, after the failure of the resistance, which has now turned into support, and in dealing with the dynamic trigger, which has had a positive reaction several times and caused the price to grow. Now it is approaching the dynamic trigger as well as the support area. Therefore, if the current area encounters a reversal candle, it will have the ability to grow to the next supply and resistance area.
In addition, if the range of the green box is broken, at least correction up to 3.50 can be imagined.
If the behavior and structure of the currency changes, the post will be updated.
🟩Sup: 3.70
⛳️Tp 3.90
⛳️ Tp2 :3.95
⛳️ Tp3 : 4.10
-----------------
Please support this idea with a LIKE and COMMENT if you find it useful and Click "Follow" on our profile if you'd like these trade ideas delivered straight to your email in the future.
Thanks for your continued support.
Sincerely.❤️

OP/USDT Keep an eye on the Bullish OB! Price will bounce and UP.💎 OP has recently demonstrated notable market dynamics. After a perfect bounce from the demand area, the price faced rejection in the vicinity of an all-time high.
💎 Currently, the price is positioned to move downward towards the Bullish Order Block (OB) area for retesting, potentially creating new momentum for an upward movement.
💎 If OP successfully bounces from the Bullish OB area, the price can resume its upward trajectory and break the current pattern, Probability facilitating an easy movement toward our target area.
💎 However, if OP fails to bounce upon retesting the Bullish OB area and breaks below it, it could signify a bearish development. This scenario would lead to continued downward movement, with the next significant support level being the demand area.
💎 The demand area holds crucial significance, as it has historically acted as a pivotal zone for price reversals. If OP fails to bounce from this area, it would confirm a shift back to bearish sentiment, potentially resulting in further downward movement.

OP-Ready for Higher🌟 Bitcoin's Breakout Surge: Professor's Big Charts Revealed 🌟
📈 Live Analysis Incoming!
Prepare for an in-depth journey through Bitcoin's latest surge as we go live on TradingView. Get ready for a session packed with insights and the unveiling of the Professor's big chart. Join us: Live Stream: tradingview.sweetlogin.com
🚀 The Breakout Chart Breakdown
Witness the bullish momentum as Bitcoin smashes past the $47,650 barrier. With my analysis, we're looking at a bull run targeting $59.9K,
69K
, and the ambitious $79K. 🎯 Stay bullish and watch as the charts unfold the story live!
💹 Historic Patterns: A Roadmap to $79K
Reflect on the last breakout at $31,100 and its staggering rise to $46,000. Our charts have been the compass leading us to these profitable winds. Don't miss out as we dissect the potential climb to $79K, live!
🔍 Last Year's Chart: The Trendline Triumph
Cast your minds back to January 2023, when Bitcoin was a humble $18,000. Fast forward, and we're witnessing a breakout reminiscent of December 2020's rally from $7,500 to $24,000. Could we be on the cusp of reaching new all-time highs? Let's explore together.
⏱️ Halving Cycles: This Time It's Different
Every cycle writes its own story, and this one's no exception. We're approaching the halving with a market more aware and ready to advance. Tune in as we analyze why we might see an all-time high sooner than the previous cycles.
🌐 Join the Live Stream for the Full Picture
There's much more to cover, from halving cycles to breakout patterns. Ensure you're part of the live session for a comprehensive analysis that could redefine your trading strategy.
Catch the full live session and secure your front-row seat to Bitcoin's exciting journey: Join the Live Stream: tradingview.sweetlogin.com
One Love,
The FXPROFESSOR 💙

OP- 🌈 Buying this Dip with Optimism (and incentives!)🚀Amidst today's Crypto dip, I'm diversifying my portfolio with a strategic move into Optimism (OP). Here's the lowdown:
📈 Volume Surge: Optimism's recent token incentives led to a jaw-dropping 23-fold surge in trading volume. That's not just noise; it's a liquidity bonanza.
🌿 Sustainable Growth: Optimism isn't just another flash in the pan. They're in it for the long haul, funding public goods and focusing on ecosystem longevity.
🛠️ Technical Robustness: As a robust Ethereum L2 solution, Optimism offers scalability and cost-efficiency, perfectly aligning with Ethereum's long-term vision.
🎯 Why Now?: Given these strong fundamentals, Optimism is a compelling investment, especially when the market's down. It's not just about quick gains; it's about backing a protocol with a solid future.
🔮 Future Outlook: If you recall how well MATIC performed for us a few months back, Optimism has similar potential.
🚀 Ethereum Synergy: Don't overlook the impact of Ethereum's upcoming Merge EIP-4844. It could be the rocket fuel that sends OP to $4.44. EIP-4844 Analysis:
📈Chart:
Massive Channel, on support= LONG with SL just below it 💙😎 LFG!
My Targets are 2.4 and 3.5$.
One Love,
The FXPROFESSOR 💙
#Optimism #InvestmentStrategy #CryptoMarket 💎

OPUSDTHi guys
The resistance area on the time form of the day is not yet fully consumed, look carefully!
As long as the price range of $6,763 is maintained, a downward trend similar to the scenario is very likely.
What do you think?
#OPIn time h1, after exiting the density and stabilizing in the specified range, you can enter a buy position with a stop below the area for a short-term upward path. Therefore, according to the recent reform, it will have the ability to grow up to its previous supply area.

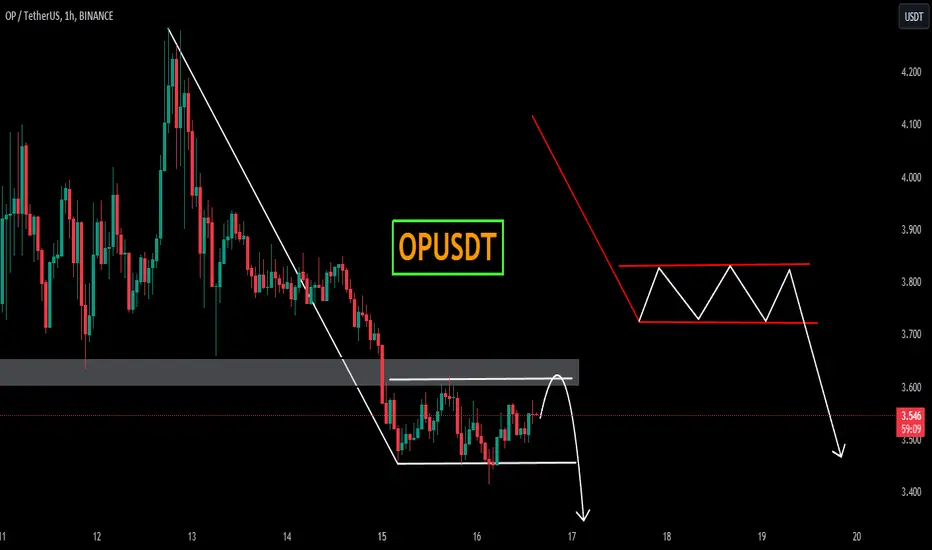
OP Bearish Flag You don't have to believe me, just trust yourself. My setup is enough. On the chart we can see that it has descended from its peak and formed a short-term uptrend, forming a bear pattern. flag combined with above There is supply pushing the price down but you can wait for a breakout from the 10 LINE before entering a position and a reversal from the candlestick or a divergence signal will be confirmed. To be more precise, don't thank me for lying.
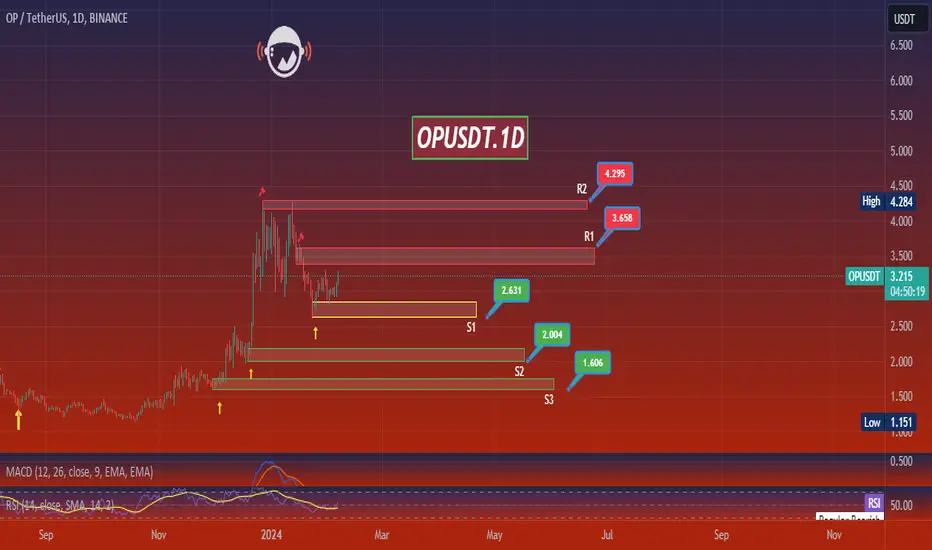
OPUSDT.1DBased on the provided market data, the OP cryptocurrency is currently priced at 3.23 USDT. The Relative Strength Index (RSI) for 4 hours, 1 day and 7 days are 67.67, 53.33, and 63.93 respectively. The RSI values indicate that the currency is neither oversold nor overbought, but the 4-hour RSI is on the higher side which indicates a bullish trend.
The Moving Average Convergence Divergence (MACD) for 4 hours, 1 day, and 7 days are 0.057, -0.048 and 0.450 respectively. The positive MACD for 4 hours and 7 days suggests bullish momentum, while the negative MACD for 1 day indicates a bearish trend.
The Bollinger Bands (Bb) for 4 hours, 1 day, and 7 days are 3.288, 3.272, and 4.012 respectively. The price is currently below the upper band for all the three periods suggesting a potential pullback or a period of lower volatility.
The support levels for 4 hours, 1 day, and 7 days are 3.072, 2.841, and 2.33 respectively, while the resistance levels are 3.396, 3.611, and 4.288 respectively. The price is currently closer to the resistance levels, indicating a possible upward trend if it breaks the resistance.
In conclusion, the technical analysis indicates a mixed trend with bullish tendencies in the short term (4 hours) and long term (7 days), but a bearish trend in the intermediate term (1 day). As an investor, it's crucial to keep an eye on these changing trends and adjust your strategy accordingly. Lastly, remember that investing in cryptocurrencies always come with risks, so it's important to only invest what you can afford to lose.
$OP, Diamond these days in cryptoNASDAQ:OP Every time before the next round of airdrop distribution, we see the growth of its native token.
Here there are the best zone for long on OP/USDT
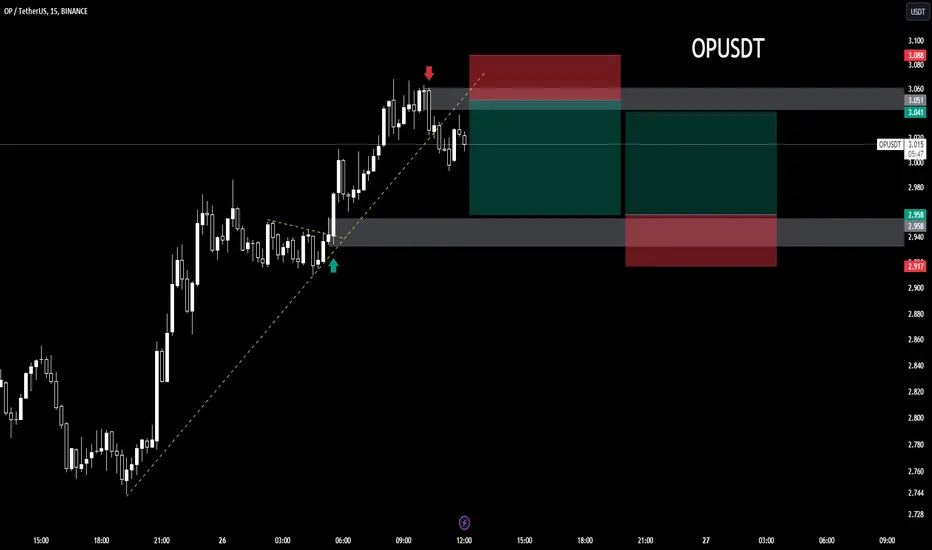
M15 (OP)📊Analysis by AhmadArz:
buy and sell.
🔗"Uncover new opportunities in the world of cryptocurrencies with AhmadArz.
💡Join us on TradingView and expand your investment knowledge with our five years of experience in financial markets."
🚀Please boost and💬 comment to share your thoughts with us!
BTC / SUI / OP - to the moon if you like the idea, please "Like" it. This is the best "Thanks!" for the author 😊 P.S. Always do your own analysis before a trade. Put a stop loss. Fix profits in installments. Withdraw profits in fiat and please yourself and your friends.

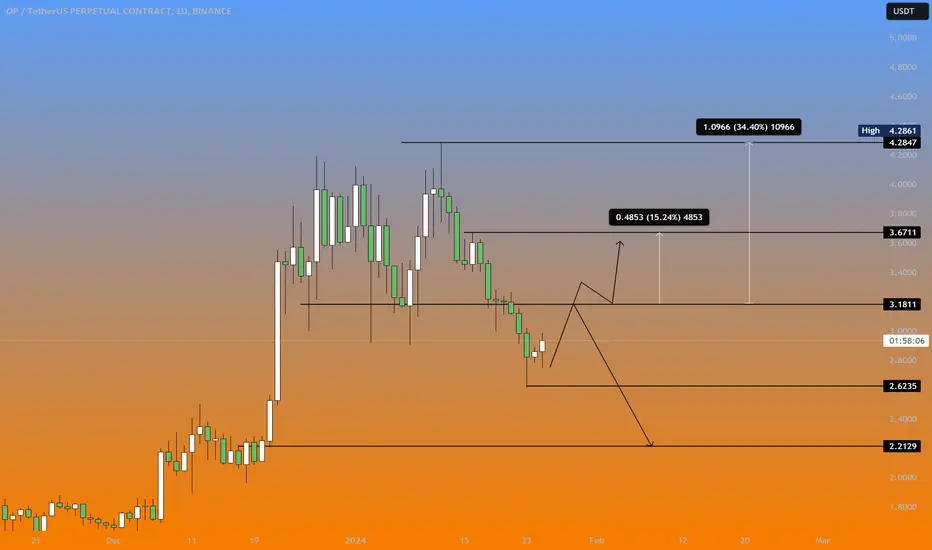
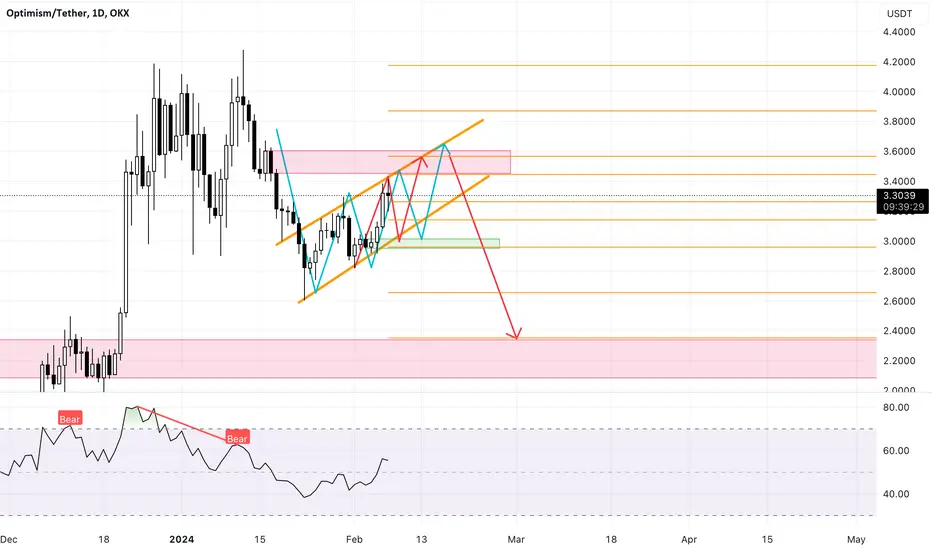
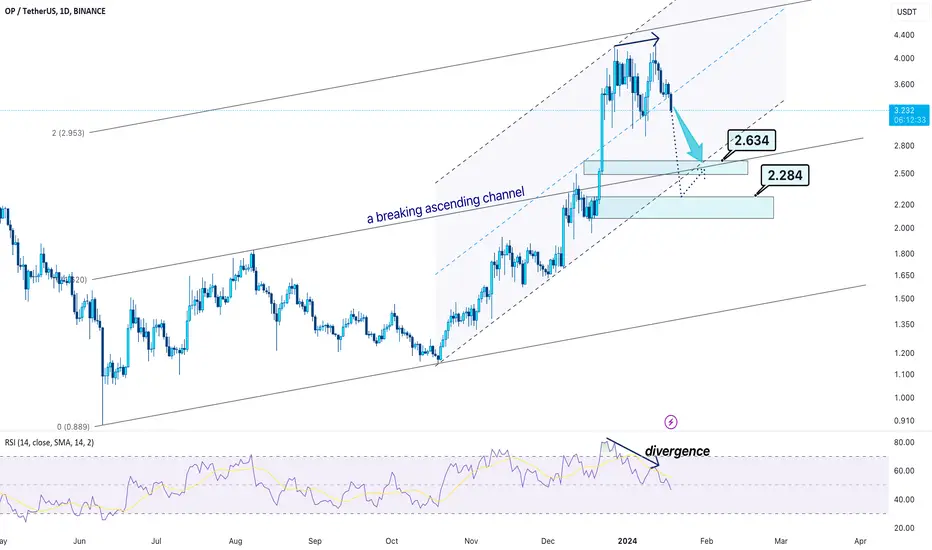
OP ⇒ a possible downward patternhello guys...
A few reasons show us OPUSDT will experience downward movement at least until 2.634:
1-the first reason:
touched the top line of the second channel.
2-the second reason:
divergence in the RSI indicator.
3-the third reason:
broke down the midline of the sharp channel.
4-the final reason:
a possibility of forming the double top pattern.
______________________
always do your research.
If you have any questions, you can write them in the comments below, and I will answer them.
And please don't forget to support this idea with your likes and comment
OP could drop until 0.5 $ i think OP could drop until 0.5 $ and mybe more
be carefull with this coin

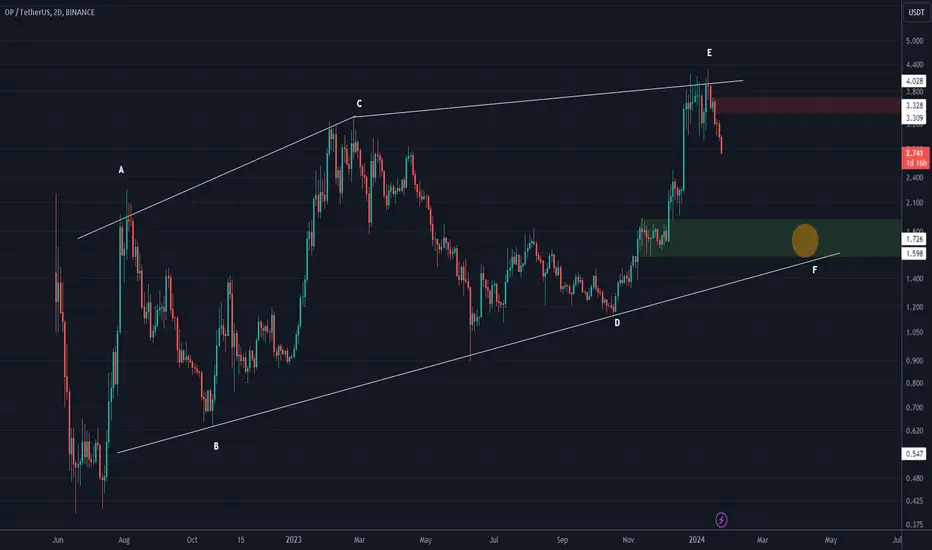
OP LOOKS BEARISH (2D TF)First, pay attention to the time frame. The time frame is large.
It seems that we have a diametric on the chart that the E wave of this diametric is ending.
We expect to drop to the green range to complete the F wave.
Closing a weekly candle above the red level will violate the analysis
For risk management, please don't forget stop loss and capital management
Comment if you have any questions
Thank You
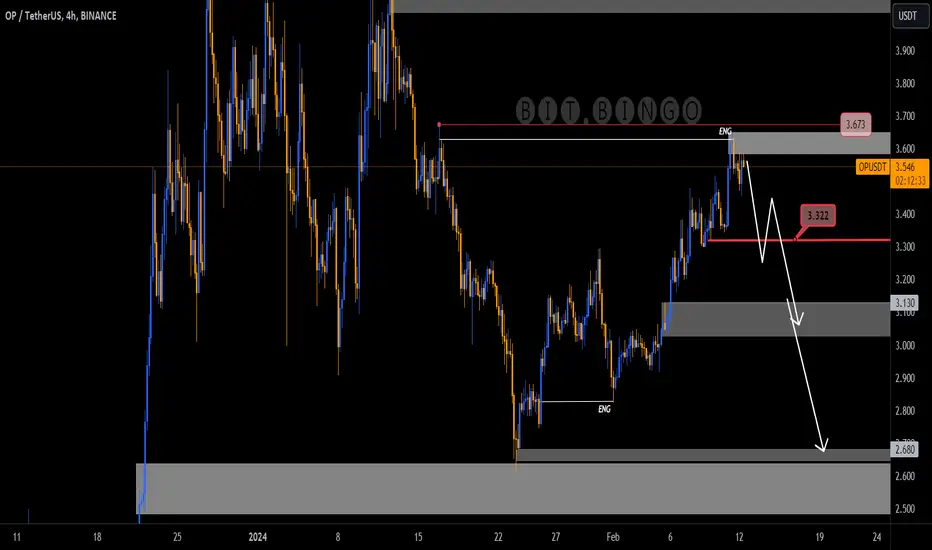
OPUSDTOPUSDT is in strong bearish trend and also form bearish flag pattern. Recently the instrument has break through important support zone.
Now the price is trading within the bearish flag and seems like it getting ready to break it.
Will the sellers took benefits from these bearish confluences?
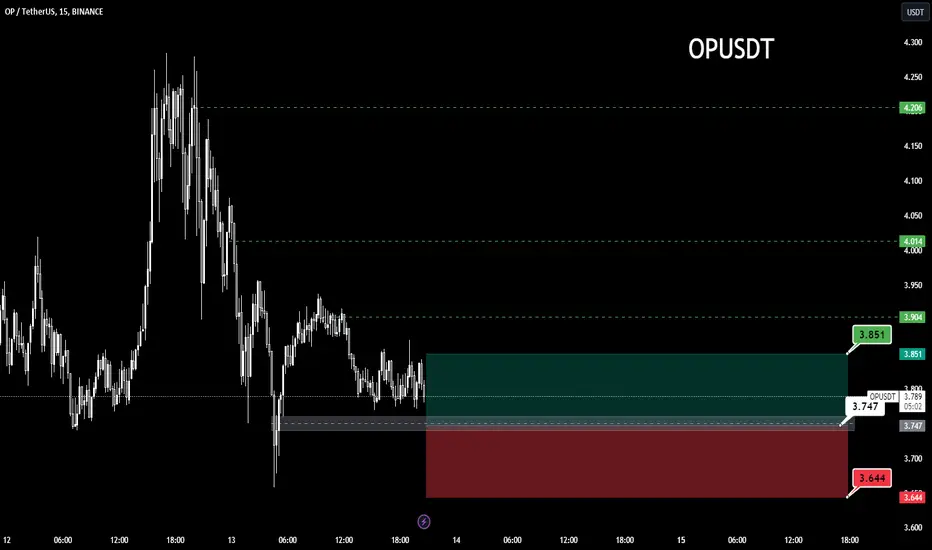
buy by R/1 (OP)📊Analysis by AhmadArz:
Trade in low level of renge.
🔍Entry: 3.747
🛑Stop Loss: 3.644
🎯Take Profit: 3.851
🔗"Uncover new opportunities in the world of cryptocurrencies with AhmadArz.
💡Join us on TradingView and expand your investment knowledge with our five years of experience in financial markets."
🚀Please boost and💬 comment to share your thoughts with us!