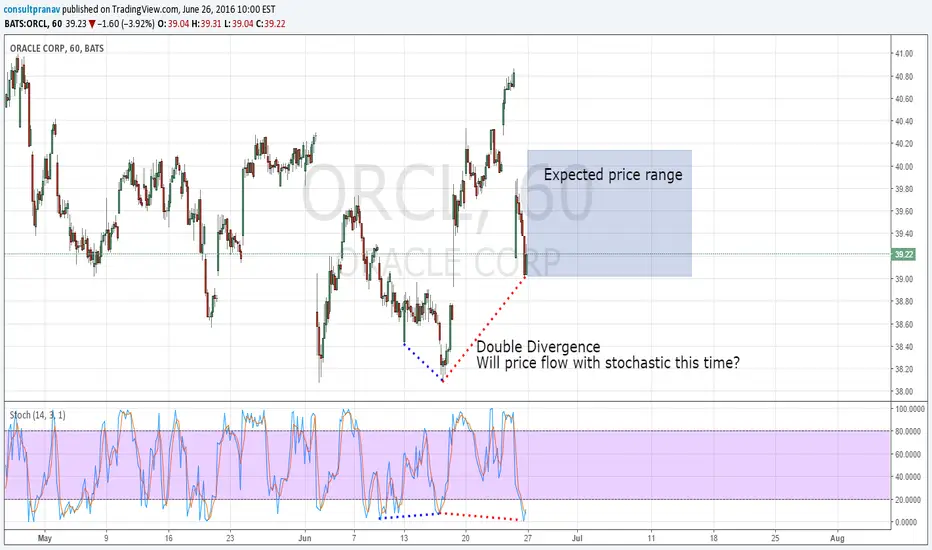
Bullish OracleStochastic created two divergences simultaneously.
There is a ~75% chance of price following the stochastic this time.
If it does, expect the price to trade in the box given.
So be bullish on Oracle.
Oracle
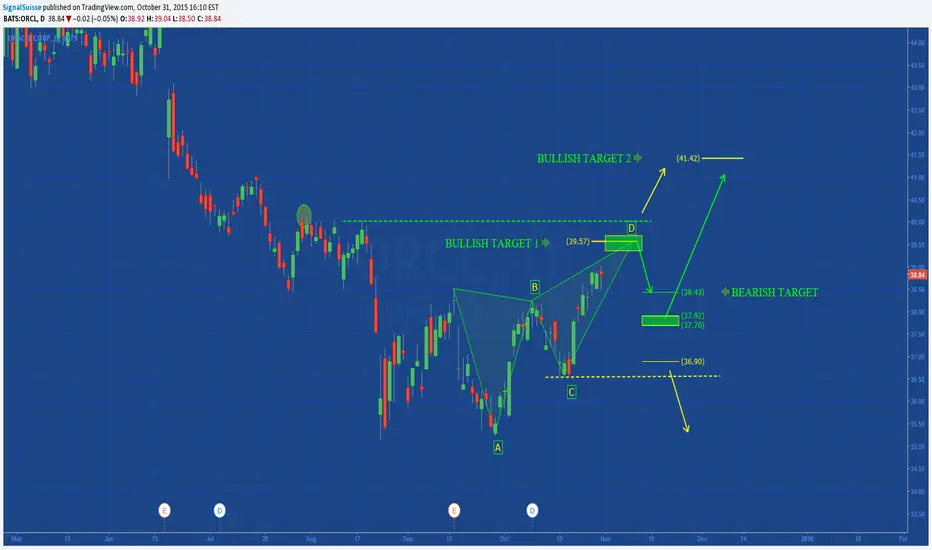
ORACLE: Daily MonitorWe appreciate your interest in our analysis, if you agree (or not) with our work, and would like to continue reading our opinions, be part of it with your "I Like"... Thanks you!
SignalSuisse
www.nonsolotrading.com
Oracle Corp Daily (14.08.2014) Technical Analysis TrainingThe Oracle Corp (NYSE:ORCL) Daily Diagram Technical Analysis Training shows the following:
The ORCL share after some consolidations finally got itself under the KUMO. The weekly diagram is turning slowly to bullish and it is above the KUMO. The monthly diagram is weakly bullish too.
MACD is marginally bullish and RSI walks the 50. The volume is moderate.
There is no special candlestick pattern. The share is under the KUMO and it is below Kijun Sen (blue line) and Tenkan Sen (green line) too.
I suggest to stay aside because the bullishness is weak under the KUMO and the volume is less than the usual.
Long in a case of breaching the Kijun Sen today at close.

Oracle Corp Daily (29.07.2014) Technical Analysis TrainingThe Oracle Corp (NYSE:ORCL) Daily Diagram Technical Analysis Training shows the following:
The ORCL share after some consolidations finally got itself under the KUMO. The weekly diagram is bullish and above the KUMO. The monthly diagram is bullish too. MACD is bullish and RSI walks above 50. The volume is moderate.
There is no special candlestick pattern. The share is under the KUMO but it is above Kijun Sen (blue line) and Tenkan Sen (green line) too.
I suggest to stay aside because under the KUMO the bullishness is weak and the volume is less than the usual. Otherwise hold as long as support line holds.

Oracle Corp Daily (19.07.2014) Technical Analysis TrainingThe Oracle Corp (NYSE:ORCL) Daily Diagram Technical Analysis Training shows the following:
The ORCL share after some consolidations finally got itself under the KUMO. The weekly diagram is bearish. The monthly is under a local top until now. MACD is bearish and RSI is near 38. The volume is as more than usual on declines.
There is no special candlestick pattern. The share is under the KUMO and with these declines is under Kijun Sen (blue line) and Tenkan Sen (green line) too.
I think that there is a SHS pattern. I cannot place a fib measurement. Head of pattern to neckline shows a projection to EMA 200 if it break the neckline.

Oracle Corp Daily (09.07.2014) Technical Analysis TrainingThe Oracle Corp (NYSE:ORCL) Daily Diagram Technical Analysis Training shows the following:
The ORCL share has made a long term development with the support of the trend line (light blue). This support line was over the KUMO, which means that the ORCL was bullish in long term. The weekly diagram shows bearish. The monthly is on a local top until now. In the daily diagram the share consolidates in the KUMO from Top to Bottom.
MACD is bearish and RSI is near 38. The volume is as usual.
We have no special candlestick pattern. The share is in the KUMO and with this declines is under Kijun Sen (blue line) and Tenkan Sen (green line) too.
There is no special pattern. I cannot place a fib measurement.
The strategy here is to stay aside until the share choose its way against the KUMO. Long above the KUMO short under it.
