Oracle: Bounced off 🎾The Oracle share price has bounced off its resistance at $117.58. However, we expect it to overcome this level with the green wave (3), providing further bullish momentum.The orange-colored five-wave move should then provide for further significant increases, at the end of which the top of the beige wave I should be formed.
Oracle

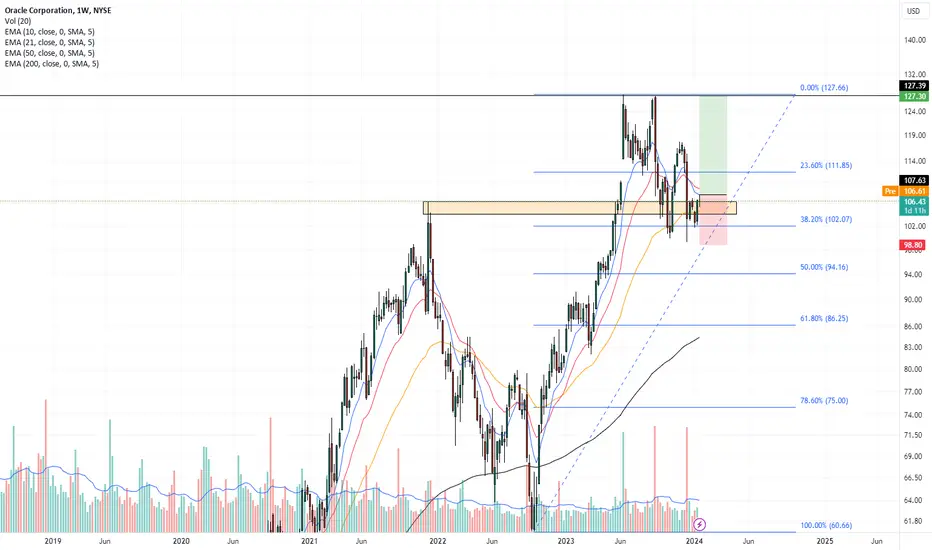
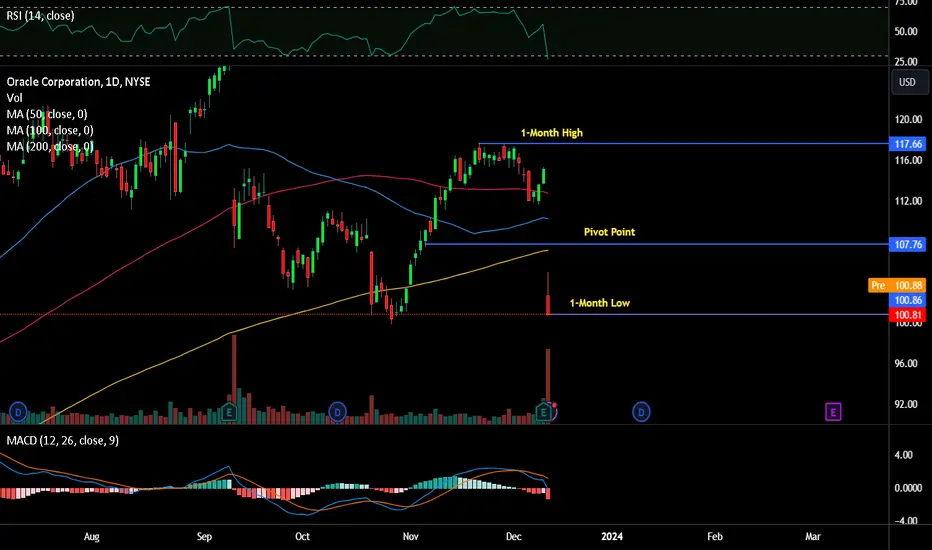
ORCL Possible buy setupOracle , a Texas based software and cloud giant is making a good possible buy opportunity. What to watch?
1. Weekly chart is showing some healthy pullback to it's previous highs sitting at around $103.73-106.56 price level.
2. When you take the Fibonacci tool and place it on the bottom of the chart which crossed the 200EMA , colored black, and take it to the top, the price had a perfect bounce out of the 38.2% Fib level. This contraction is considered good, especially because there is the 50EMA sitting just there.
3. Since I missed that potential entry point, I am looking on how and when to enter now. The thing I am considering right now is lack of buying pressure and rise in volume for the stock.
4. If we glance at the Daily levels, the stock is trying to close above the 200EMA, and it has been trying to do so for the last month to be precise. I am waiting for a strong upward move and I want to see the price going further away from the 200EMA line, sitting at around $106.5 price level.
5. Once this move happens, I am in. My stop loss will be place below the gap down candles on the Daily level, which are sitting at around $99.5 price level .
6. Depending on the price action of the stock, my take profit levels will either be the previous high of $127.4 or even higher price. If I take the first take profit level, it will bring me solid RR of 1:2.23.
Of course, I will be closely monitoring the reactions of the stock and keep you all updated.
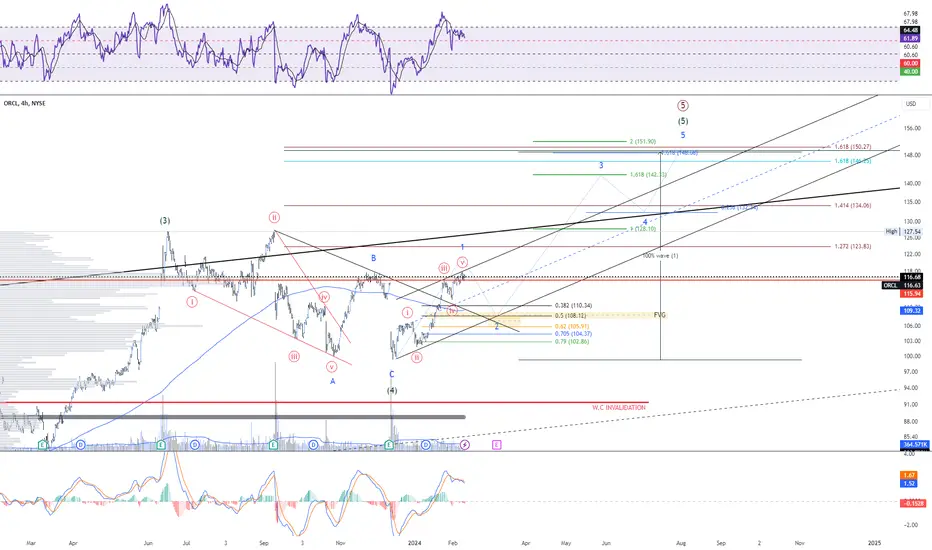
ORCL Ready for a Pull back before rally to 150 final target?After the drop and downgrade from JP Morgan from 112 to 100. Oracle completed its (4) wave. Possible completing a subwave 1 (blue color), price looks losing steam, so maybe it is time for a healthy pullback to wave 2 (yellow box) and continue for the best wave 3 rally and get the target at the golden ratio.
Of course, news could invalidate this count, but in the bullish scenario, this is the road map I believe could get Oracle to 150 around.
Good luck!
PYTH NETWORKI really like this chart and the project.
Looks like a giant flag in progress.
The project is an oracle with a lot of utility and official partnerships among the biggest in the crypto field.
(Yes i'm positioned)
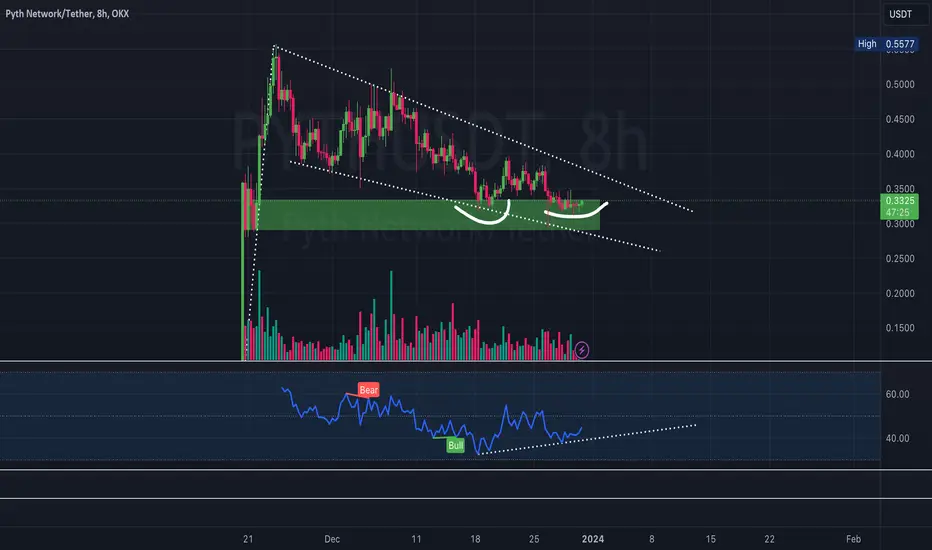
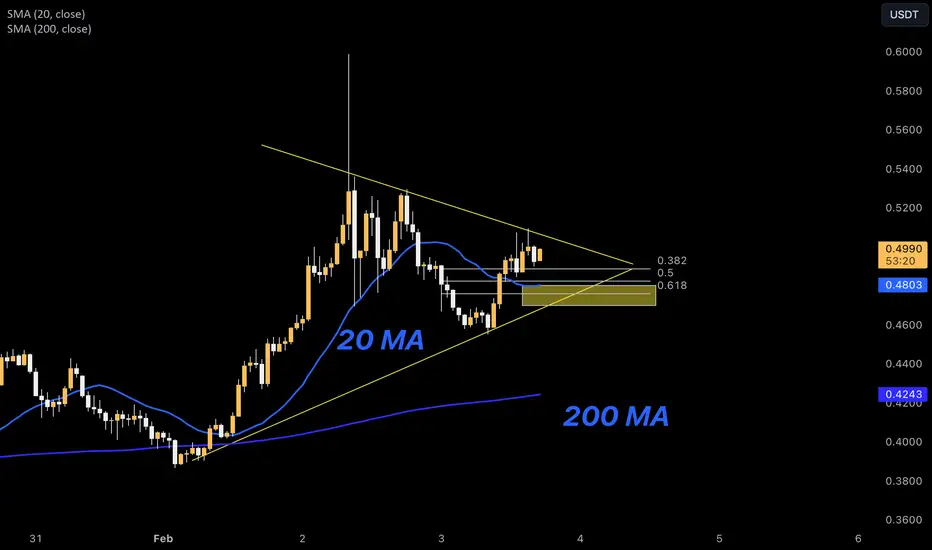
Preparing for PYTH longMore bullish than ever on PYTH, so non financial advice...
Here I'm waiting with patience for FIB-level 0.618
I think the yellow zone could be a great area to build a position. We could get some help from 20 MA and the trendline to hold the trend.
The big gains come when we break the flag and after that move to price discovery. I don't want to miss that.
I will be picky with the entry here and try to find one with tight stop loss.
Oracle's Ambitious Expansion in the Middle East
In a strategic move to capitalize on the Middle East's digital transformation, Oracle ( NYSE:ORCL ) is set to expand its operations in Dubai and build additional cloud infrastructure across the region. The company's Dubai office is undergoing a significant renovation, promising customers an immersive experience in envisioning the future of their companies through cutting-edge AI and cloud technology.
Strategic Investment for a Cloud-Powered Tomorrow
Amid a rising trend channel, Oracle's ( NYSE:ORCL ) stock outlook appears promising, reflecting investor confidence in the company's growth. With plans to invest in a state-of-the-art customer experience center in Dubai, Oracle ( NYSE:ORCL ) aims to offer a futuristic workspace and enable clients to visualize the potential of AI and cloud technology for their businesses.
Cloud Providers Tapping into the Middle East's Potential
Oracle's expansion aligns with the broader trend of global cloud providers establishing a significant presence in the Middle East, particularly in Saudi Arabia and the UAE. Companies like Microsoft, Amazon, IBM, and Alibaba Cloud have already opened cloud and data centers in the region, recognizing the growth potential fueled by a tech-savvy population and government-led digital initiatives.
Oracle ( NYSE:ORCL ), currently managing 67 cloud regions across 26 countries, underscores the Middle East's importance in its global strategy. Clay Magouyrk, Executive Vice President for Oracle Cloud Infrastructure, acknowledges the transformation of the Emirates into a global economic and technology powerhouse, driven by the widespread adoption of cloud services.
Empowering Women in Tech with sAIdaty Initiative
In a move to contribute to the UAE's digital economy goals, Oracle ( NYSE:ORCL ) has partnered with the Dubai Business Women Council to launch the sAIdaty initiative. This year-long program aims to enhance AI skills among women professionals and entrepreneurs. By equipping 500 council members with essential skills, the initiative not only advances women's professional journeys but also aligns with Oracle's commitment to fostering diversity and inclusivity in the tech sector.
Generative AI Integration - A Game-Changer for Enterprise Adoption
Oracle's focus on solving real-world business use cases is evident in its announcement of the general availability of the Oracle Cloud Infrastructure (OCI) Generative AI service. This fully managed service integrates large language models to address diverse business use cases, now supporting over 100 languages. The service's multilingual capabilities, improved GPU cluster management, and flexible fine-tuning options position Oracle as a leader in driving enterprise AI adoption at scale.
Conclusion: Oracle's Cloud-Powered Vision for the Middle East
As Oracle ( NYSE:ORCL ) expands its operations in Dubai and strengthens its cloud infrastructure across the Middle East, the company is not just responding to regional demand but actively shaping the digital future of the area. The combination of technical prowess, strategic partnerships, and a commitment to diversity positions Oracle as a key player in the region's evolving technological landscape. With the integration of generative AI, Oracle ( NYSE:ORCL ) is not only staying ahead of the curve but is also providing businesses with the tools they need to thrive in the era of digital transformation.

PYTH AIMS 25% HigherPYTH has been on a decent climb after a massive sell-off. It managed to reclaim the VAL after the retest of the trendline breakout. all bullish signs and with bitcoin providing a nice bullish pump into the weekend, it'll provide a bullish narrative to fuel the altcoins this weekend.
The levels are marked on the chart where I expect PYTH to have a retracement, until then, a long aiming for the VAH seems like the higher probability trade.
Calculate Your Risk/Reward so you don't lose more than 1% of your account per trade.
Every day the charts provide new information. You have to adjust or get REKT.
Love it or hate it, hit that thumbs up and share your thoughts below!
This is not financial advice. This is for educational purposes only.

Pyth - long - could be early!Pyth looks strong now after the initial airdrop sell off.
I think Pyth are preparing for a big move.
If we got really lucky (and BTC dump) I think we can find a nice entry at around 0.31. In that case we have potential 68% set up with 4.0 risk/reward ratio.
If you think Pyth is the "new Link" - It could also be a good time to DCA into Pyth...we are so early :)

Resting time $13 down to $11 | Long BiasOn day chart
Chainlink is in the #CorrectionWave and target of this wave at #13 and lower $11 maybe
BINANCE:LINKUSDT is supported by #AscendingTrendLine I think this time can be a #FourthWave of #ImpulseWave begins $4.76
So my view is Link will be bounce back from $13 or $11 and this is chance to join the race with LINK
Time will tell
TRB big crash 🩸 incoming Oracle defi coin COINBASE:TRBUSD 🪙 #DYOR
Done good performance 🙌
I am expecting dump from present price 📌
If any liquidation pump 📌 to liquidate short positions
It will reach red box $56-73
Day close above box $74 invalid 📌
I am expecting dump towards $8-10

Fundamental Factors Influencing Oracle's Stock at Pivot PointsOracle Corp, the software giant, has reported a slowdown in its cloud computing business, causing its shares to drop more than 7% . The company has projected fiscal third-quarter revenue to be below estimates due to strong competition in the cloud computing market and an uncertain economy, negatively impacting cloud service demand.
According to Bloomberg, this slowdown has fueled investor concerns that the software maker’s expansion efforts have yet to gain ground in the competitive market. Oracle's cloud revenue rose 25% to $4.8 billion in the period ended November 30, after registering a 30% gain in the previous quarter, which represents the second consecutive quarter of slowing growth.
In the fiscal second quarter, Oracle's sales increased by 5% to $12.9 billion, slightly below the average estimate of $13.1 billion. However, the company's profit, excluding certain items, stood at $1.34 per share, beating the average estimate of $1.33.
The company has attributed its slowdown to an uncertain economy and intense competition in the cloud computing market, which has caused a decline in cloud service demand. The news of Oracle's slowdown in cloud computing has caused many to question the company's ability to compete in an increasingly crowded market.
Massive Move is coming | Long BiasOn month chart
I found the same consolidation phase between LINK and AAVE
So I think AAVE will breakout soon like LINK
Wait for breakout and take the big chance on Defi

Oracle: Docked! 🔗🚢The ORCL share price continued to climb, reaching the turquoise Target Zone (coordinates: $115.76 - $122.90). The magenta-colored wave (2) should now be completed within this range, the high of which should be followed by a countermovement to the downside. Currently, the upward momentum has flattened somewhat, but can still hold at the high levels. Accordingly, we expect a further rise within the described Target Zone - although from a technical perspective, the minimum requirement of wave (2) in magenta has already been met. After the reversal, we expect the downtrend to continue.

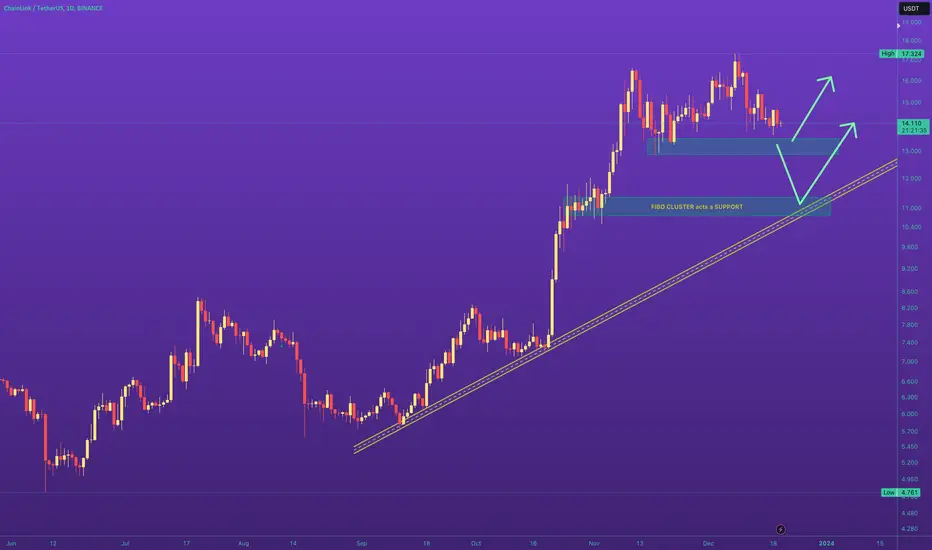
LINK ($CHAINLINK) Price Rally to ContinueWhales have been the major contributors to the Chainlink price rally. The LINK could retrace partially before a rally to $20.
Oracle service provider Chainlink (LINK) has been one of the star performers in the altcoin space while clocking nearly 90% gains just over the last month. The LINK price is currently trading around $15 levels with its market cap around $7.9 billion.
Chainlink Whale Accumulation
The 200 largest chainlink whales have added huge quantities of LIBK coins over the last two days. Reportedly, they have been accumulating even before the 100% LINK price rally began.
Revisiting October 17th, when $Chainlink traded below $7.40, the 200 largest wallets swiftly accumulated an additional 40.18M $LINK. Two days after, the asset witnessed a remarkable surge of +125% in a span of 25 days, currently stabilizing around ~$14.60. The holdings in these wallets have sustained at elevated levels ever since.
After a strong price rally earlier in November, Chainlink is witnessing some sort of volatility over the last week. In the last 24 hours, the LINK price is down by 5.09% and is currently trading around $14.30 levels.
Chainlink appears to be on the verge of breaking out from a bullish flag pattern! A potential scenario involves a retest of the breakout zone around $14, paving the way for Chainlink ( BIST:LINK ) to advance toward the $20 mark.
SWIFT Collaborate With Chainlink To Transfer Tokenized Value
Swift’s successful collaboration with Chainlink and over 12 prominent financial institutions showcased the efficient and secure transfer of tokenized value across both public and private blockchains, facilitated by CCIP.
In this collaboration, Chainlink served as an enterprise abstraction layer, securely connecting the Swift network to the Ethereum Sepolia network. Chainlink’s Cross-Chain Interoperability Protocol (CCIP) played a crucial role in ensuring complete interoperability between the source and destination blockchains.

Oracle potential correction is ON 🚨#usstock :: NYSE:ORCL
#dyor :: ORACLE
Present I am bearish 📍 on it 👍
I belive top is completed 📌
Now 35-45% potential drop we will see
Based on drop and pump 📌 we can decide macro top completed 📌 or not 🚫
Present my target is :: $80-90
( be in follow article under this post update will be provided )

ORACLE: Channel Down bottom buyOracle is on a bearish 1D technical outlook (RSI = 31.499, MACD = -1.720, ADX = 20.020) almost oversold as (with the exception of Aug 29th-Sep 11th) it is trading inside a Channel Down and the price is almost on its bottom. The 1W MA50 may make contact with the price there. This is a buy opportunity regardless (RSI oversold) and our target is the top of the Channel (TP = 106.00).
## If you like our free content follow our profile to get more daily ideas. ##
## Comments and likes are greatly appreciated. ##

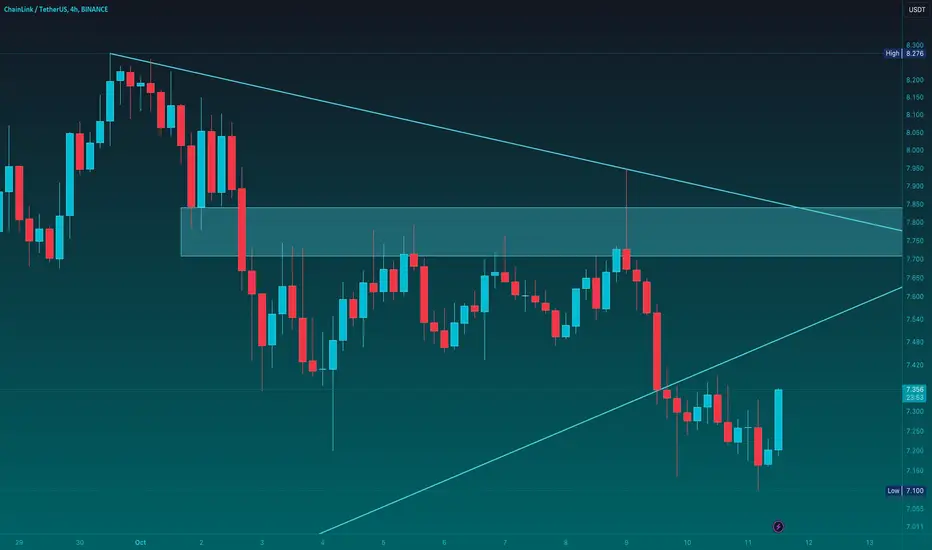
Big resistance zone around $7.8Chart 4H TF
LINK has broken down trend line and recovering to $7.8 now
My bias is Long after price close and confirmed above $7.45
Wait for next move
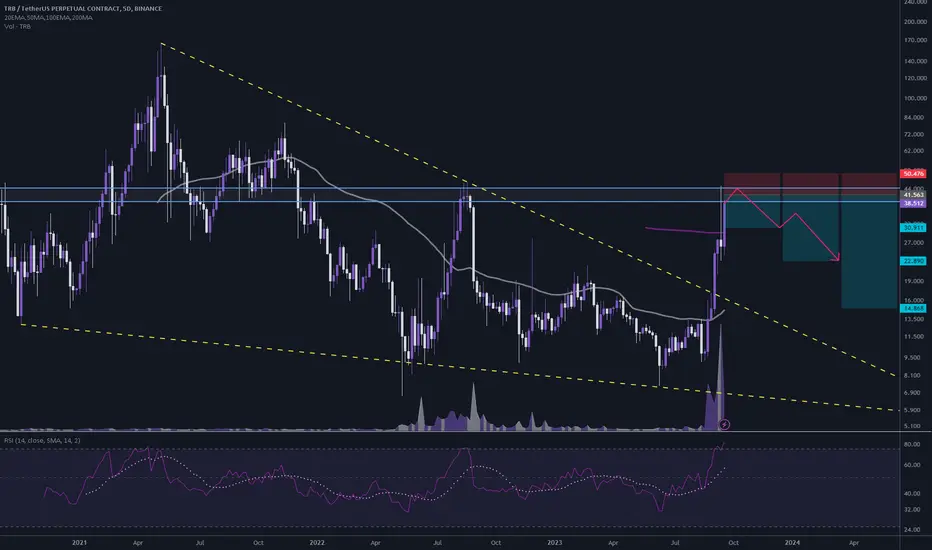
#TRB/USDT 5D (Binance Futures) Big descending wedge breakoutTellor Tributes printed a shooting star which probably marked the local top on that supply zone.
RSI is quite overbought, a retracement down to 200MA at least would make sense.
⚡️⚡️ #TRB/USDT ⚡️⚡️
Exchanges: ByBit USDT, Binance Futures
Signal Type: Regular (Short)
Leverage: Isolated (2.0X)
Amount: 4.7%
Current Price:
38.512
Entry Zone:
38.997 - 44.129
Take-Profit Targets:
1) 30.911
1) 22.890
1) 14.868
Stop Targets:
1) 50.476
Published By: @Zblaba
LSE:TRB BINANCE:TRBUSDT.P #Tellor #Tributes #Oracle #Web3 tellor.io
Risk/Reward= 1:1.2 | 1:2.1 | 1:3.0
Expected Profit= +51.3% | +89.9% | +128.5%
Possible Loss= -42.9%
Estimated Gaintime= 3-9 months
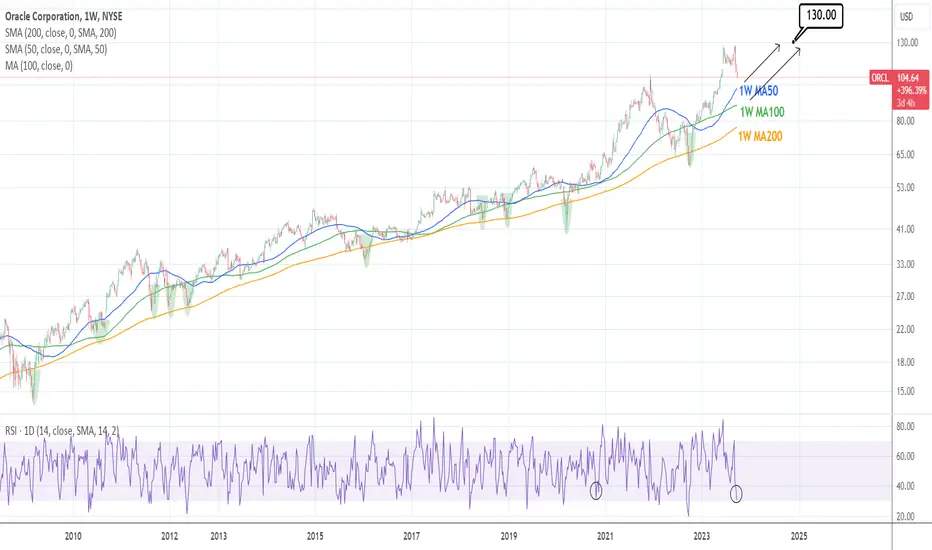
ORACLE: Sharp correction may turn into a 1 year buy.Oracle is having a sharp sell off during September, the strongest since September last year (2022), which formed the market bottom. It is almost oversold on the 1D technical outlook (RSI = 30.957, MACD = -2.920, ADX = 37.867) with the price approaching the 1W MA50, which is untouched since November 7th 2022.
On this 1W chart we have market the time of a 1W MA200 breach that was followed soon after with a strong rebound. Our trading strategy is to enter a long term buy and hold on the 1W MA50 and if by any chance (unlikely) tests the 1W MA100, then unload the rest of longs there. This will be an ideal long term buy opportunity (TP = 130.00).
## If you like our free content follow our profile to get more daily ideas. ##
## Comments and likes are greatly appreciated. ##
#BLZ/USDT 4h (Binance Futures) Ascending wedge on resistanceBluzelle broke down the small rising wedge and has been forming a bigger one which may end up breaking bearish as well, leading to a retest of 200MA support.
⚡️⚡️ #BLZ/USDT ⚡️⚡️
Exchanges: Binance Futures
Signal Type: Regular (Short)
Leverage: Isolated (4.0X)
Amount: 6.4%
Current Price:
0.15552
Entry Targets:
1) 0.16459
Take-Profit Targets:
1) 0.12635
Stop Targets:
1) 0.18375
Published By: @Zblaba
FWB:BLZ BINANCE:BLZUSDT.P #Bluzelle #Storage bluzelle.com
Risk/Reward= 1:2
Expected Profit= +92.9%
Possible Loss= -46.6%
Estimated Gaintime= 4-8 days

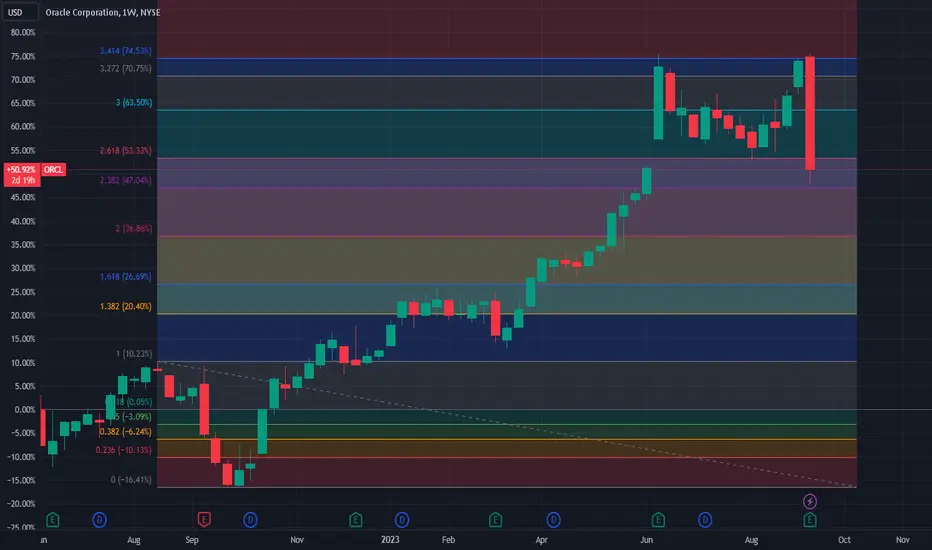
ORCL show an engulfment patternORCL show an engulfment pattern
This chart shows the weekly candle chart of Oracle's stocks over the past year. The graph overlays the bottom to top golden section at the end of 2022. As shown in the figure, the high points of Oracle's stock in June of this year and this month formed a small level double top shape, and were suppressed by the 3.414 digits of the golden section at the bottom of the figure! Although the weekly chart of Oracle's stock has not yet closed, it has now shown a large-scale engulfment pattern, completely engulfing the gains of the past three months!
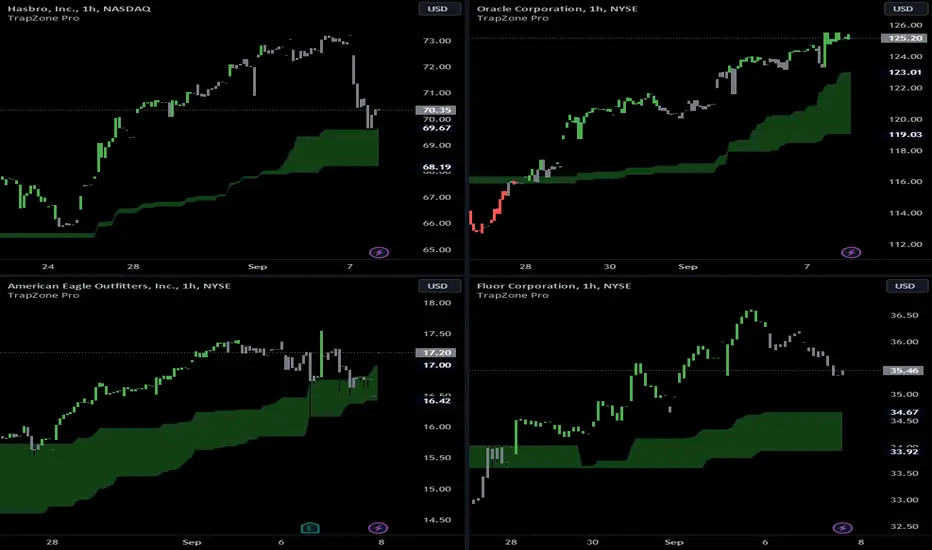
Long Picks 9/8These 4 are my top Long ideas for today into the future until the price stays above the Green TrapZone.
The picks are based on momentum, volume and price action.
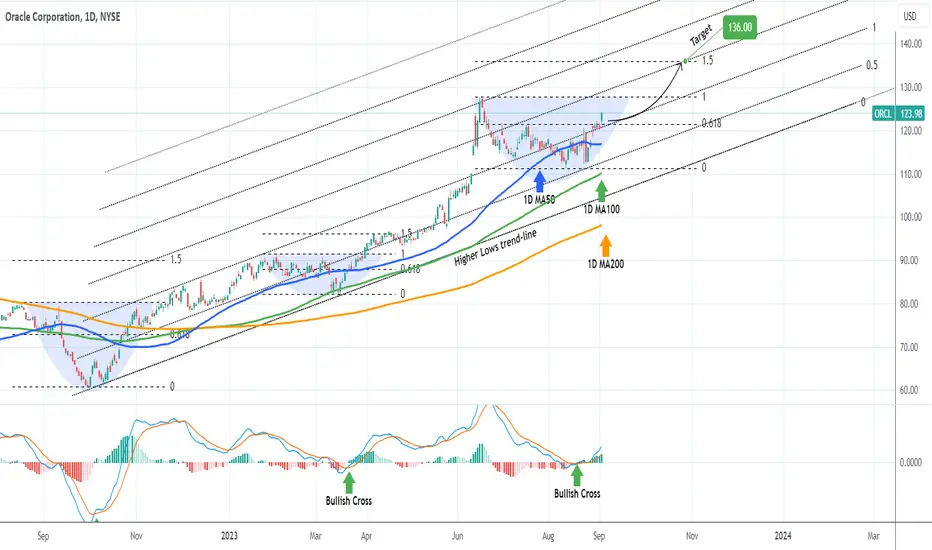
ORACLE on a strong bullish break-out.Oracle Corporation (ORCL) made yesterday a break and 1D candle closing above the 0.618 Fibonacci level, confirming the bullish continuation bias with a standard technical break-out. The long-term pattern is best displayed by the Fibonacci Channel and as the stock price has just completed a 1D MACD Bullish Cross in more than three months, we are expecting a Higher High.
Based on the last two Bullish Crosses after bottoms, the price has always hit the 1.5 Fibonacci extension before a new consolidation. That is currently at $136.00 and is our new short/ medium-term target.
-------------------------------------------------------------------------------
** Please LIKE 👍, FOLLOW ✅, SHARE 🙌 and COMMENT ✍ if you enjoy this idea! Also share your ideas and charts in the comments section below! **
-------------------------------------------------------------------------------
💸💸💸💸💸💸
👇 👇 👇 👇 👇 👇