⚠️ Next Station $9.4Daily Chart
ChainLink BINANCE:LINKUSDT is in correction phase come back to $6.7 if it can hold above that support, it will return strong and fast for next bullish.
The fifth wave will reach around $9.4 if LINK doesn't break down the ascending trend line.
So wait and see what happen
Oracle

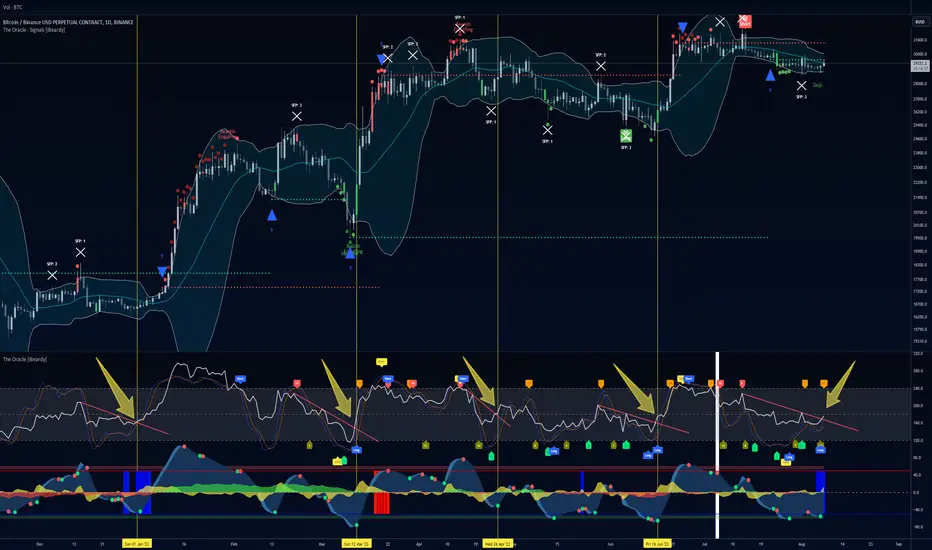
Bitcoin about to pump? First public TA using OracleHello,
after working for over 2 years on my indicator Oracle and Oracle-Signals , i think its time to start sharing some TAs using these 2 indicator.
In my future TAs, i wont write much about news, fundamentals, market structure and and and. I simply let my indicator talk.
1. Introduction - Oracle:
What you see on the bottom, is Oracle. In these 2 years i tried to improve it, tried to add confirmation signals and added other nice features.
The second part of Oracle is named Oracle - Signals (On the chart).
The Oracle - Signals indicator, helps me to spot incoming reversal easier, as it contains a lot filters and conditions. (For example the red/green colored candles)
2. So what is oracle telling me right now?
Lets have a look at the daily BTC chart.
As you can see, i marked, bullish breaks from the past with yellow arrows. Each of these signals played out perfectly and the entries were near the local bottom.
There are a few rules how to enter/exit such trades.
But #1 rule is, enter a trade only when the RSI closes above a resistance trendline or closes below a support trendline, with at least 2 confirmations (which all come from these 2 indicators).
First what i do is, i wait for some early signals of a potential reversal.
Right now Oracle prints strong hidden bullish divergences and a exhausted trend on lower timeframes. Confirmed by the bullish cross on the Wavetrend, Oracle - Signals printed a doji candle and also the candle from yesterday was a green buy candle.
After spotting these early signals, the most important part comes now.
Looking for a trendline on the RSI. If there is none, then we ignore all the early signals and wait for the next opportunity.
But right now, there is a trendline. I already drew that trendline on the RSI.
A close above this trendline today and this is a confirmation for a incoming pump.
Not forget to mention is that BBWP (A indicator made by @The_Caretaker) which shows volatility, is printing 0 = low volatility (blue columns in oracle on the bottom). So the next move could be a bigger one.
What happens after the daily RSI closes above the trendline today?
There are 3 outcomes:
Pump right away: It starts to pump without any retraces
Golden Pocket retest: Draw a fib retracement from yesterdays low, to todays high and long the golden pocket.
StopLoss: Wick below last local low ($28663 BTC/BUSD), invalidates this long signal
These indicator reads work on all timeframes pretty well. On traditional market charts even much better.
So if anyone has come down to this part of the text:
I am open to do some TA for other assets using my indicator. This would help me to understand the signals more.
Write me a comment with the asset name and timeframe and ill try to share some charts.
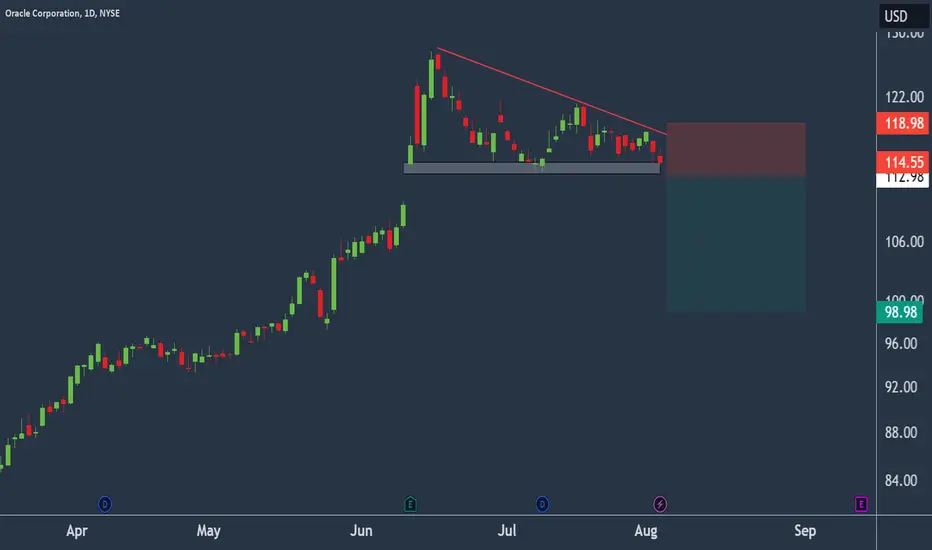
Oracle in descending triangle.Oracle - 30d expiry - We look to Sell a break of 112.98 (stop at 118.98)
Daily signals for sentiment are at overbought extremes.
Trades with a bearish descending triangle formation.
113.43 has been pivotal.
A break of the recent low at 113.43 should result in a further move lower.
The bias is to break to the downside.
Our profit targets will be 98.98 and 96.98
Resistance: 118.00 / 121.36 / 124.00
Support: 113.43 / 110.00 / 105.00
Please be advised that the information presented on TradingView is provided to Vantage (‘Vantage Global Limited’, ‘we’) by a third-party provider (‘Everest Fortune Group’). Please be reminded that you are solely responsible for the trading decisions on your account. There is a very high degree of risk involved in trading. Any information and/or content is intended entirely for research, educational and informational purposes only and does not constitute investment or consultation advice or investment strategy. The information is not tailored to the investment needs of any specific person and therefore does not involve a consideration of any of the investment objectives, financial situation or needs of any viewer that may receive it. Kindly also note that past performance is not a reliable indicator of future results. Actual results may differ materially from those anticipated in forward-looking or past performance statements. We assume no liability as to the accuracy or completeness of any of the information and/or content provided herein and the Company cannot be held responsible for any omission, mistake nor for any loss or damage including without limitation to any loss of profit which may arise from reliance on any information supplied by Everest Fortune Group.
ORACLE Sell unless the Channel's top breaks.Oracle is on a correctional wave inside a larger parabolic trend.
As long as the price is inside the Channel Down (correction wave), sell and target the 1day MA100 at 106.85.
If the price crosses over the Channel Down, buy and target the 1.236 Fibonacci level at 130.50.
Follow us, like the idea and leave a comment below!!

ORCL | Informative NYSE:ORCL
If the price of ORCL breaks above the bullish line of $118, it may indicate a bullish signal, suggesting potential upward price movement. In this scenario, the target price could be set at $119.84.
Conversely, if the price of ORCL breaks below the bearish line of $114.34, it may suggest a bearish signal, implying potential downward price movement. In this case, the target price could be set at $109.25.

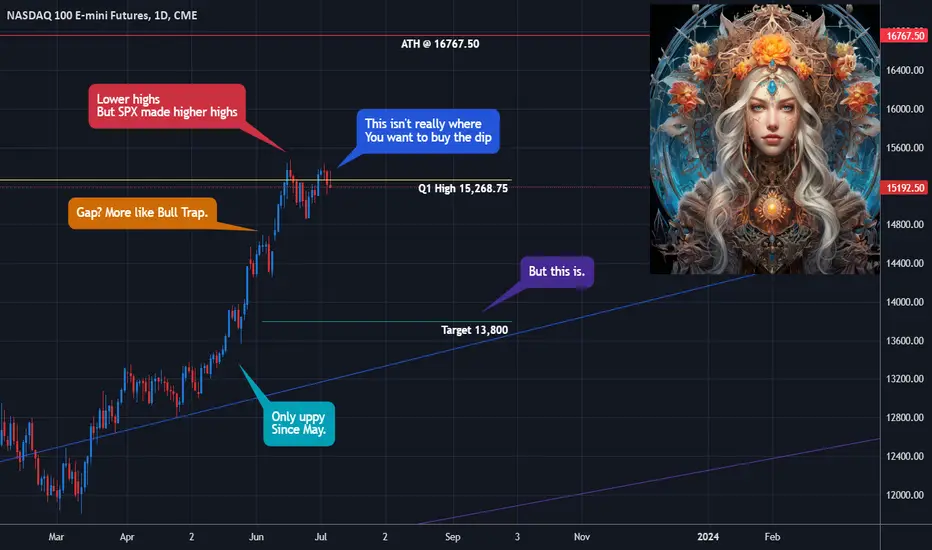
Nasdaq - The Great Bear TrapIn recent analysis on the state of the markets, I note that the notion that we're "in a bull market" is actually really dangerous, and how, if you really want to see healthy markets into the future, you don't want to see a new all time high print yet, because we're just too far over the trend:
Nasdaq NQ - A Fundamental and Technical Warning Signal
Moreover, Q2 just finished strong, and with a new quarter, comes a new deployment of the algorithms. The infamous "JPM Collar" is something I discussed in a recent post:
SPX/ES - An Analysis Of The 'JPM Collar'
Namely that I believe it forecasts a serious correction in the markets. But at the same time, it has until September to even start, really.
And it's dangerous to be long right now because the VIX is so low and we've been in a bullish impulse inside of bearish market conditions for so long, which I note below
VIX - The 72-Handle Prelude
You can see the first manifestation of this principle has begun in both the VIX, and the UVIX 2x leveraged bull ETF:
You might look at that and think "lol it gave all its gains back" but this is actually what you want to see if it's going to run a bit.
I also have open calls for Tesla, which are short term, albeit significantly, bearish.
Tesla - What To Expect Until September?
And an open call on Netflix where I actually believe it will retrace to the $170s during the next major correction.
Netflix - I Hope You Like Catching Knives
So where we're at with Nasdaq futures is that it made lower highs while the SPX made higher highs:
The divergence is noise for the short term, but if you ask me, it means that in the long term, if we see a dump, and then a bounce, that Nasdaq will actually take out the high while SPX will be a laggard.
What Friday's price action showed is that both SPX and Nasdaq have begun to dump. If you ask me, this is because before we can go higher, we must go lower.
Sells have to be matched with buys and buys have to be matched with sells, after all.
And at this point, we haven't seen any downside in the markets since March. It's too extreme.
Two important areas of note is we have the daily pivot around 14,800 and the gap around 14,500.
Both of these are places that I expect to see attempts at bounces that will not come to fruition. Because you need to give people a chance to buy the dip and then for them to get stopped out.
I believe that the reason things will dump, and they may dump violently, and fast, is to crank the VIX and have all the permabears finally see their "opportunity" emerge to get short for "the crash."
Only for markets to bounce through the end of August while everyone with money is at the sea side and VIX dies a slow death back to a 9-handle while volatility gets sold off for free money again.
By then, nobody will want to be short anymore. Everyone will have capitulated. Then the fireworks can start, and early bears will miss the move, much to their consternation.
So, I believe that Nasdaq and tech stocks give the opportunity to short through the next few weeks.
On Wednesday, we have CPI, which has not mattered in months, but may matter a lot now while the markets pretend to care about whether the Fed hikes rates again.
Then we have FOMC on July 25 and a Nasdaq 100 "rebalance" on the 24th.
A recovery through the end of July and all the way through the end of August is a very likely scenario.
Until then, I believe we will see violent and significant downside, and it finally gives an opportunity trade puts and bear ETFs until you see really significant bullish movement in price at key levels, and then look for longs.
But the next time it's time to go long, it's only a scalp.
After Q3, the remainder of 2023 and the early part of 2024 is likely to be quite dangerous.
There are more important things in life than making money. Make sure you take good care of yourselves and your family and friends.
Make sure you make up for your regrets as soon as possible, lest you find yourself with no further chances to set right what was set wrong.
ORCL Oracle Corporation If you haven`t bought ORCL here:
Then analyzing the options chain of ORCL Oracle Corporation prior to the earnings report this week,
I would consider purchasing the 110usd strike price Calls with
an expiration date of 2023-7-21,
for a premium of approximately $4.65.
If these options prove to be profitable prior to the earnings release, I would sell at least half of them.
Looking forward to read your opinion about it.
See ya at 230 It might be gearing up to hit 230 in 3 months. It must stay above 125 on a weekly basis.

Oracle to breakdown?Oracle - Expires 17/4 (30d) - We look to Sell a break of 81.98 (stop at 85.22)
Although the bulls are in control, the stalling positive momentum indicates a turnaround is possible.
Broken out of the channel formation to the downside.
Previous support at 86.00 now becomes resistance.
A break of the recent low at 82.04 should result in a further move lower.
The bias is to break to the downside.
Our profit targets will be 73.88 and 71.88
Resistance: 86.00 / 88.00 / 91.22
Support: 82.04 / 79.00 / 78.06
Please be advised that the information presented on TradingView is provided to Vantage (‘Vantage Global Limited’, ‘we’) by a third-party provider (‘Signal Centre’). Please be reminded that you are solely responsible for the trading decisions on your account. There is a very high degree of risk involved in trading. Any information and/or content is intended entirely for research, educational and informational purposes only and does not constitute investment or consultation advice or investment strategy. The information is not tailored to the investment needs of any specific person and therefore does not involve a consideration of any of the investment objectives, financial situation or needs of any viewer that may receive it. Kindly also note that past performance is not a reliable indicator of future results. Actual results may differ materially from those anticipated in forward-looking or past performance statements. We assume no liability as to the accuracy or completeness of any of the information and/or content provided herein and the Company cannot be held responsible for any omission, mistake nor for any loss or damage including without limitation to any loss of profit which may arise from reliance on any information supplied by Signal Centre.

Oracle in a range.Oracle - 30d expiry - We look to Buy at 86.41 (stop at 83.42)
Price action continued to range between key support & resistance (86 - 90) although we expect a break of this range soon.
The bias is to break to the upside.
The primary trend remains bullish.
Preferred trade is to buy on dips.
The 1 day moving average should provide support at 86.40.
Posted Mixed Daily results for the last 56 days.
Our profit targets will be 93.88 and 94.88
Resistance: 90.00 / 91.22 / 92.00
Support: 88.00 / 85.87 / 84.00
Please be advised that the information presented on TradingView is provided to Vantage (‘Vantage Global Limited’, ‘we’) by a third-party provider (‘Signal Centre’). Please be reminded that you are solely responsible for the trading decisions on your account. There is a very high degree of risk involved in trading. Any information and/or content is intended entirely for research, educational and informational purposes only and does not constitute investment or consultation advice or investment strategy. The information is not tailored to the investment needs of any specific person and therefore does not involve a consideration of any of the investment objectives, financial situation or needs of any viewer that may receive it. Kindly also note that past performance is not a reliable indicator of future results. Actual results may differ materially from those anticipated in forward-looking or past performance statements. We assume no liability as to the accuracy or completeness of any of the information and/or content provided herein and the Company cannot be held responsible for any omission, mistake nor for any loss or damage including without limitation to any loss of profit which may arise from reliance on any information supplied by Signal Centre.

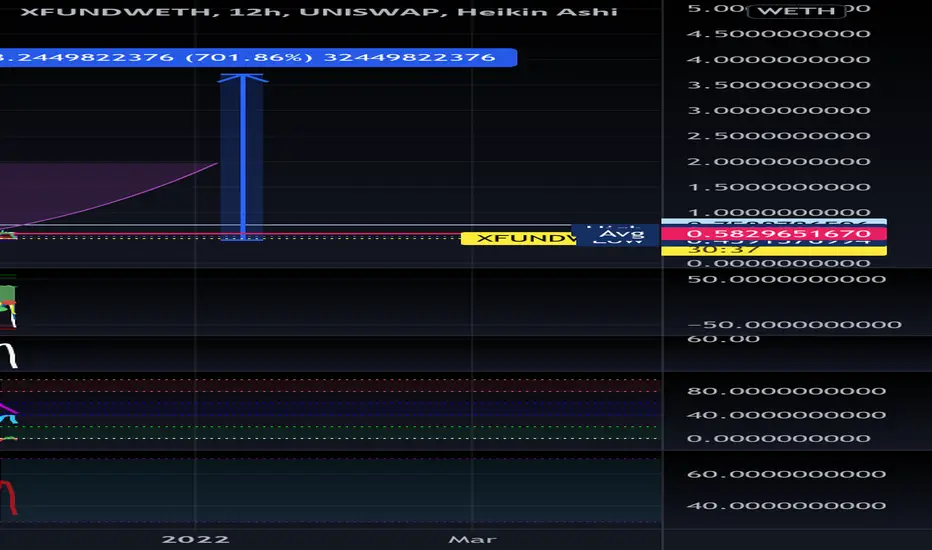
When Xfund goes back to ath it will be a 700% gain. Get ready.Unification Xfund is the oracle for Shibaswap. Most people dont know about xfund but they build blockchains for business. They have recently voted the max supply to lock in at 8,888 with a marketcap currently only 17 million. Huge growth potential here.
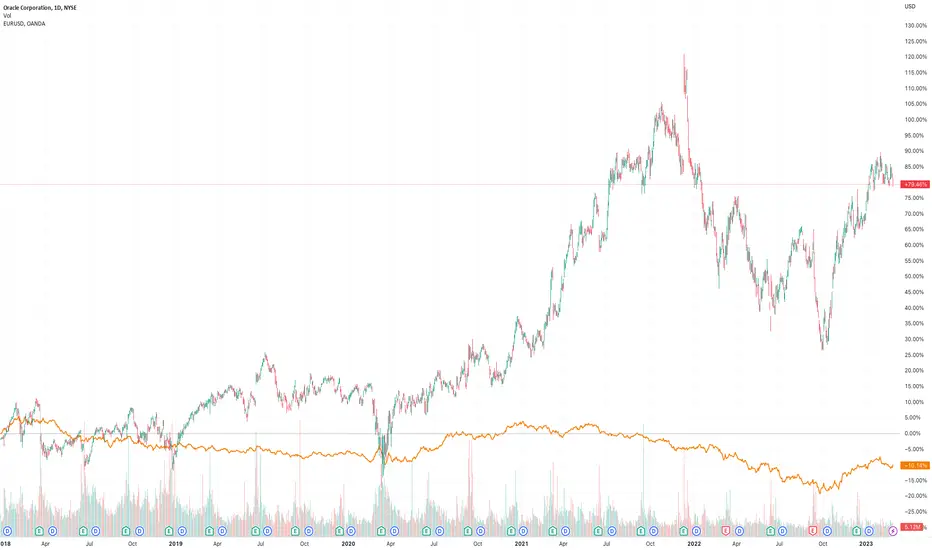
Oracle’s mixed financial image buffles investors
Shares in Oracle Corporation (symbol ‘ORCL’) have been trading in an aggressive bullish momentum for the last 5 months. The company is expected to report its earnings for the quarter on Thursday 9th of March. The consensus EPS is $0.95 compared to the result for the same quarter last year of $0,94.
‘Oracle’s payout ratio is around 40% indicating that the company is saving up most of their earnings for reinvestment in the company to influence growth while at the same time the company’s total liabilities are more than the total assets making investors hesitant to heavily invest in the near term. In addition the company’s intrinsic value ( what an asset is worth in a more objective calculation rather than just the share price) is around $86,40 while the share price is trading at $87,80 at the time of this report. This indicates that the share is slightly overvalued and investors might be waiting for a better price to buy the stock.’ said Antreas Themistokleous, an analyst at Exness.
On the technical side the price has been trading in an aggressive upward movement for the last 5 months and currently the price entered a descending trading range in the last month. With the Stochastic oscillator not showing any overbought or oversold levels the movement on the chart could be either direction.
The bulls for the time being look strong with no signs of reversal yet while the 50 day moving average and the lower band of the Bollinger bands are acting as a support on the price around the $86 price area.
KYL $0.01 | Oracle like Link only SexierBig Data and Validated ones are cool
as it gives peace of mind for the PARTICiPANTS and investors
at current levels this is simply allocating to big funds
of series of foundations and the usual suspects of VCs in the Valley
could be as EPIC and robust as China Coin play and the Ai Metaverse WAVE
good luck

ORACLE Bullish as long as the 1D MA50 supports.Oracle Corporation (ORCL) is on a Channel Up within a Channel Up (blue) that is rising despite the Channel Down (bearish divergence) on the 1D RSI. We are now exactly on the 0.618 Fibonacci retracement level, which is the highly critical Golden Ratio. As long as the 1D MA50 (blue trend-line) is holding, then the Channel Up will eventually push higher towards the 0.786 Fibonacci (96.50). A break below the 1D MA50, should re-test the 0.382 Fib (78.20) and depending on the time it breaks, potentially the 1D MA200 (orange trend-line) as well.
-------------------------------------------------------------------------------
** Please LIKE 👍, FOLLOW ✅, SHARE 🙌 and COMMENT ✍ if you enjoy this idea! Also share your ideas and charts in the comments section below! **
-------------------------------------------------------------------------------
💸💸💸💸💸💸
👇 👇 👇 👇 👇 👇

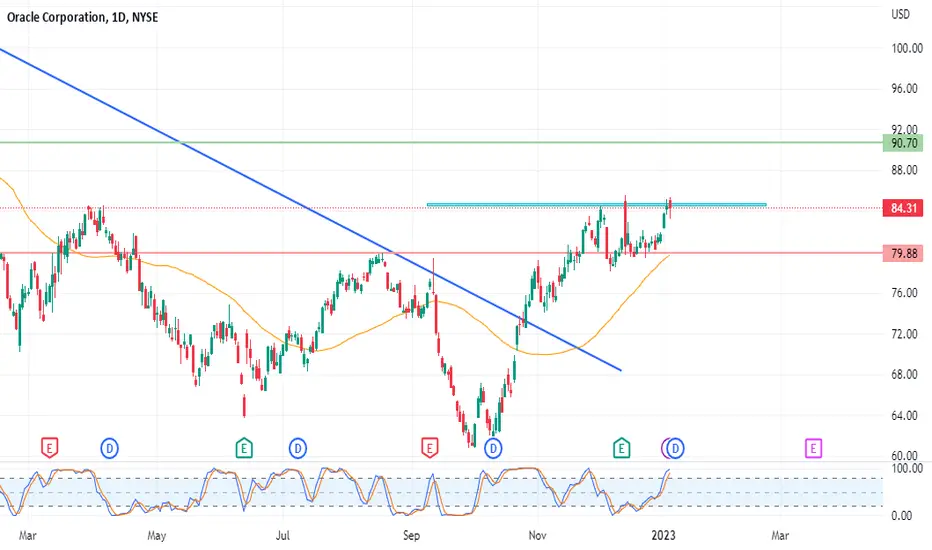
Oracle attacks pivotal resistance - AnalysisOracle Corporation's stock (ORCL) extended its gains and tackled the pivotal resistance of 84.50, amid the dominance of the upward correctional short-term trend, while buoyed by trading above the 50-day SMA, with positive signals from the RSI.
Therefore we expect more gains for the stock, targeting the resistance of 90.70, provided the resistance of 84.50 was breached.
Oracle: Sweet Temptation 🔥Oracle is moving dangerously close to the resistance line at $85.58, which would activate our alternative scenario. In that case, the stock would rise further into the green target zone between $85.45 and $92.50 to finish off the grey wave alt.I before sinking back into a correction. Primarily, we expect the course to drop into the green target zone between $72.66 and $63.46 to complete the grey wave II. After completion, we predict Oracle heading North in the longterm.

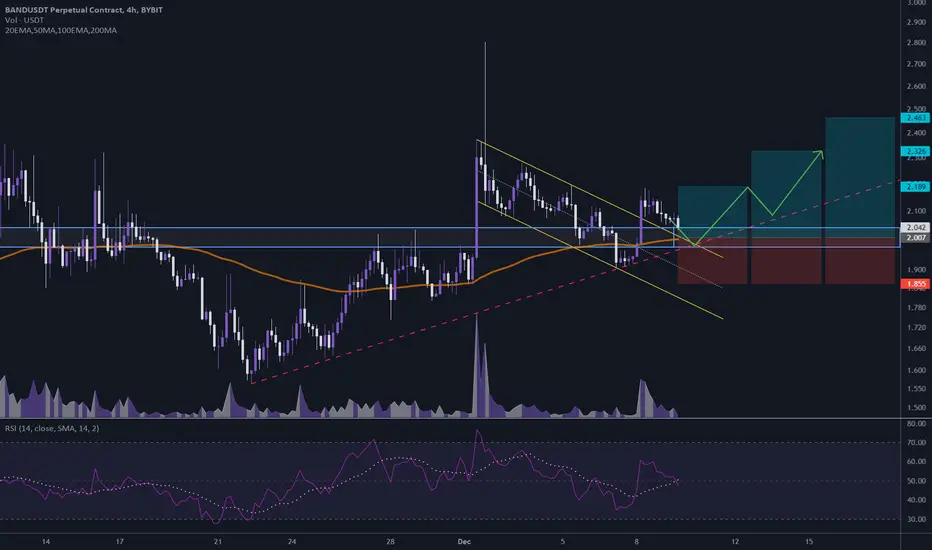
$BAND/USDT 4h (#Bybit) Descending channel breakout and retestBand Protocol is pulling back to ascending TL / 100EMA support where a bounce seems likely.
⚡️⚡️ #BAND/USDT ⚡️⚡️
Exchanges: ByBit USDT, Binance Futures
Signal Type: Regular (Long)
Leverage: Isolated (4X)
Amount: 6.6%
Current Price:
2.042
Entry Zone:
2.040 - 1.974
Take-Profit Targets:
1) 2.189
2) 2.326
3) 2.463
Stop Targets:
1) 1.855
Published By: @Zblaba
Risk/Reward= 1:1.2 | 1:2.1 | 1:3
Expected Profit= +36.27% | +63.58% | +90.88%
Possible Loss= -30.29%
Fib. Retracement= 0.618 | 0.883 | 1.117
Margin Leverage= 4x
Estimated Gain-time= 1-2 weeks
Tags: #BAND #BANDUSDT #BandChain #Oracle #Web3 #DPoS #DeFi #BSC
Website: bandprotocol.com
Crypto collective intelligence platform to price illiquid assetsWhile the valuation of tokens on-chain and on DEX/CEX exchanges is easily achieved through a traditional order book or various AMMs, there are still massive problems valuing NFTs, pre-IDOs/IPOs, secondary tokens and other illiquid assets. The problem goes so far that even in traditional finance, valuing illiquid assets is usually costly, subjective and involves a lot of work. Lithium addresses the issue of unavailable pricing information of illiquid assets by bringing in accurate pricing through collective intelligence and tokenomics. Lithium is applicable to both digital and real world assets, all Price Seekers have to do is to submit their enquiry attached with a bounty offer to receive genuine pricing information from Price Experts who in turn, are incentivized by our platform’s tokenomics.
Dates to remember:
Testnet product release (Matic): Target Launch Jun 30th, 2022
Mainnet Beta product release (Matic): Target Launch Sep 30th, 2022
Investors:
Almaeda research, Pantera, FBG, Petrock, and much more known VCs.
About 25% of the tokens are already in circulation, the remaining 75% will be elicited over the next 4 years, including staking rewards as an incentive for participation in pricing.. We are currently (to this date) 50% below the seed price (0.003$).
Potential:
The idea and potential to fill a gap in the market that both DeFi and the traditional world are truly unique. The core team has specific knowledge and experience for this project. It is also that the team, with its very many known investors, has a very large network, with extensive ressourecn and enough capital to make ends meet over the next few years. As we are currently below the seed price, the risk/reward ratio here is more than good. It's quite unusual to get into a promising project below seed price of known brands such as Pantera.
Short-term:
TP: 0,003, 0,0045, 0,006, 0,01,
Mid-term:
0,03, 0,06 , 0,1
Long-term
0,15 , 0,20, 0,50
This is not a recommendation to buy or sell or trade $LITH tokens. Do always your own research and never invest more than you can afford to lose. This is not an investment advise.

ORCL Oracle Corporation Options Ahead Of EarningsIf you haven`t bought the last breakout before the earnings:
Then you should know that looking at the ORCL Oracle Corporation options chain ahead of earnings, i would buy the $78 strike price Puts with
2022-12-30 expiration date for about
$2.49 premium.
If the options turn out to be profitable Before the earnings release, i would sell at least 50%.
Looking forward to read your opinion about it.

One more timeOne more dump and the last to buy this Oracle.
The Oracle of the Blockchain for the planet.
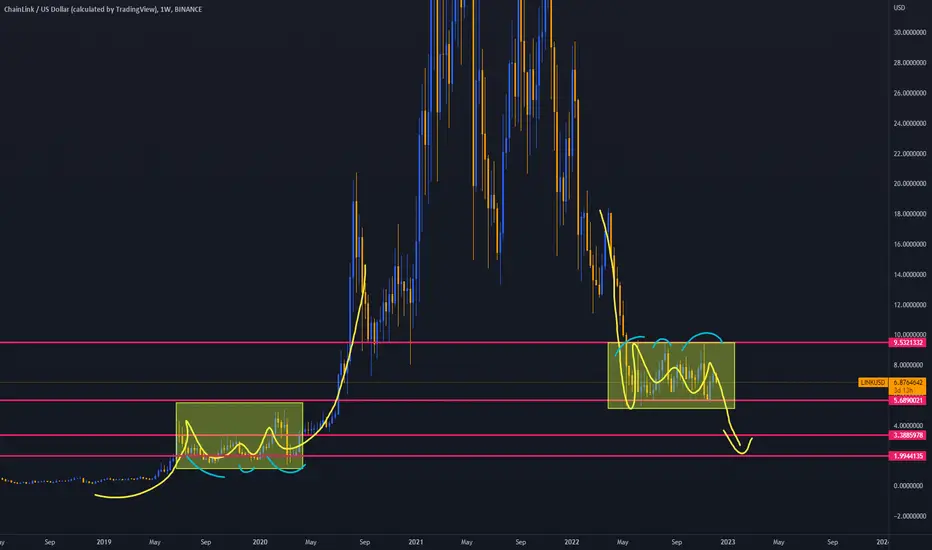
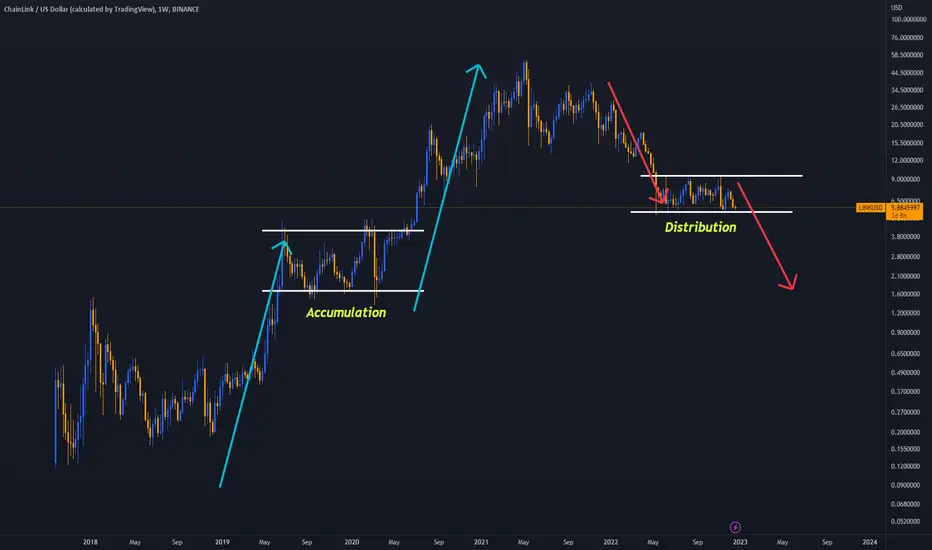
LINK MAJOR ACCUMULATION HAPPENING!LINK has been in a major accumulation zone since May 2022. The range is currently between $5-$9. Once this range is broken with a bullish continuation PA we can say goodbye to these levels. I believe most of 2023 we will play around with the highs of these levels if we do manage to breakout but this is clearly institutions loading up their bags and waiting for the market to move up. If we break below, this will be an absolute massive resistance to try and break through. The volume at this level is huge. Let us see how the next few months play out.
Love it or hate it, hit that thumbs up and share your thoughts below!
Every day the charts provide new information. You have to adjust or get REKT.
Don't trade with what you're not willing to lose. Safe Trading, Calculate Your Risk/Reward & Collect!
This is not financial advice. This is for educational purposes only.

oracle fin service good for investment?Oracle Fin Service(OFSS) good for investment as per my analysis. it took support 3122 is lower support 6242 first target second one 6888..
