Fibo levels of WinkLinkFibo levels:
1.6 BC=$0.00031
2 BC=$0.00046
2.24 BC=$0.0006
2.6 BC=$0.0009
3.6 BC=$0.0025
1.6 XA=$0.007
1.6 EF=$0.00142
2 EF=$0.00194
2.24 EF=$0.0022
2.6 EF=$0.00315
3.6 EF=$0.007
1.6 YD=$0.014
Oracle


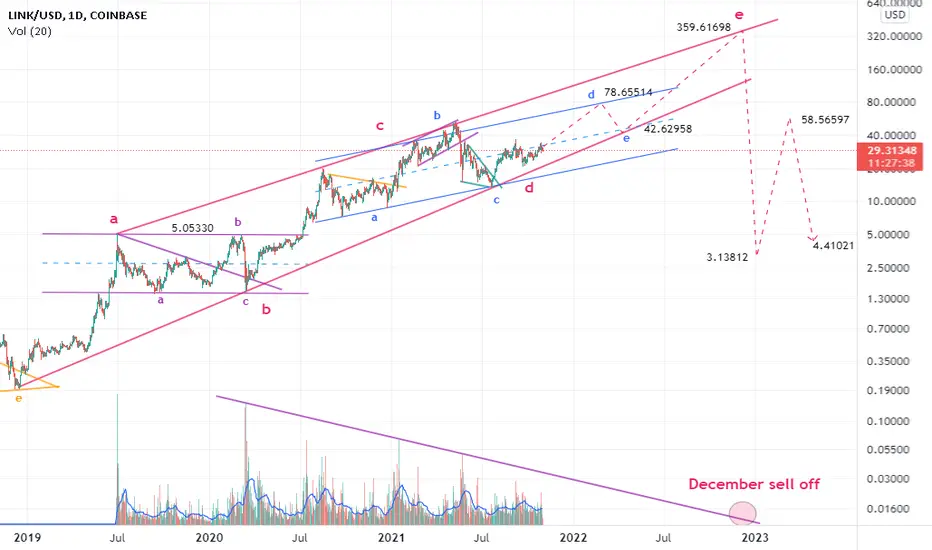
December sell offcrab harmonic pattern:
AB=0.61 XA
BC=0.88 AB
tp1=1.6 BC=$5 *reached*
tp2=2.6 BC=$42 *reached*
tp3=1.6 XA=$78
tp4=3.6 BC=$360
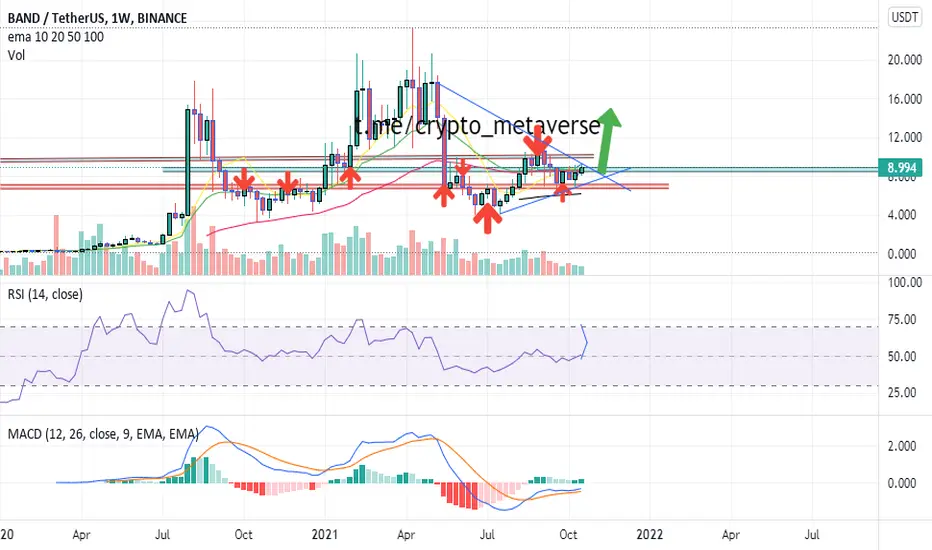
band . new big bangband is trying to break the resistance . with weekly chart where macd is good for us . it didnt cross down ( death cross) and rsi is going up from average point . looking to break 50 ema with support of 10 and 20 ema .
no need to put stoploss . it will rebounce back just like before . this is for long term so no leverage
ORACLE CORPORATION : CMP 97 Oracle Corporation good st current levels .... Stock completed correction on 4 hour chart pattern...stock expected to run 30-40 percent in next one year...

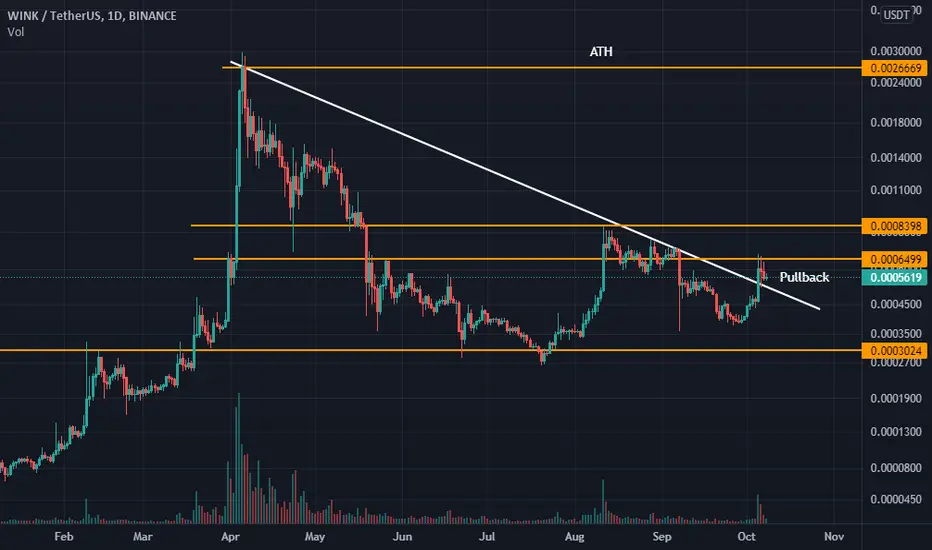
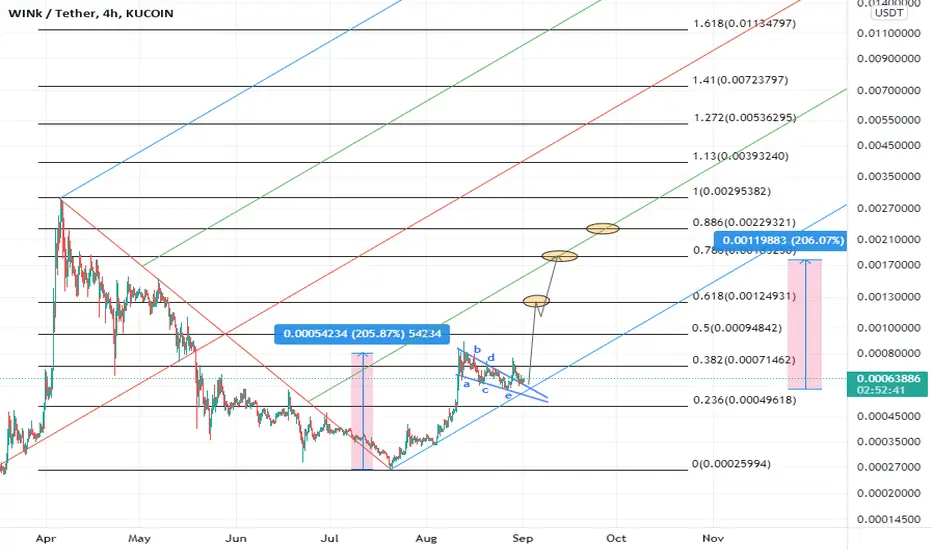
WINK Downward trend is broken, Oct 8WINUSDT downward trend is broken and a pullback to the broken trend is happening.
Trading volume has increased.
If you want to buy WinkLink, This is your chance.
distance from ATH ≈ %400 which is also Fibonacci expansion target
ERG/USDT Is a downtrend breakout in sight? We are Ready!Intro:
- ERGO is an Oracle that will be used for the Cardano blockchain.
- ERGO worked together with Charles from Cardano and they talk highly from each other which is a good thing if you believe in ADA and it's approach.
- SEC confirmed that crypto will not be banned and especially Bitcoin and Ethereum will not be banned.
Daily chart:
- Price currently is within a downtrend and near a local support around 10.5$.
- Volume decreases since the start of September where ERG was listed on Kucoin. Once we break the downtrend this could change quickly.
- RSI analysis shows a "soft" downtrend breakout. We are still going down but could set a higher low.
- Support lines are at 10.5$ and 8$.
- Resistance lines are at 12.5 and 19$.
Expectation:
- We expect a further price appreciation during the next three months and a solid recovery until the end of October. Currently price depends on the ADA price token which is stagnant at this moment.
- Looking forwards into October where we might see an ETF approval for Bitcoin . This would be in favor for the whole market.
- We possibly retest the 10.5$ line which could act as support and help ERG to push through the purple line. This could lead to another bullish rally together with the whole Cardano ecosystem.
- End of the year prediction: We will see a 50$+ Ergo before the end of 2021.
Basic rules:
- Never buy the top/ ATH
- Take profit as long as you can (also partial profit is profit)
- Use Stop/loss for leveraged positions
- If you are not experienced, don't leverage in the first place
Enjoy the ride and don't be too greedy.
If you like the content, please like, comment and give this channel a follow.
We would love it if you could share your thoughts in the comments.
Discussions are very welcome here.
Always do your own research and keep in mind that my charts and comments cannot be considered financial advice.
Cheers
ps.
Chart explanation:
Main lines:
- Green lines are tested support lines.
- Orange lines are resistance lines or, if we are above, possible support lines which were not tested yet.
- Cyan line is for volume trendline.
- White lines are Fibonacci retracement levels
Helplines:
- Purple lines are trendlines we take a look at.
- Blue, green, white and pink lines are 200MA, 100MA, 50MA and 20MA.
- Yellow lines are for visual help only.
Specials:
- Boxes represent either entry zone or support zone . Check the description.
- Cameras represent MA crossings. Yellow camera stands for a golden cross while the cyan camera stands for a death cross.

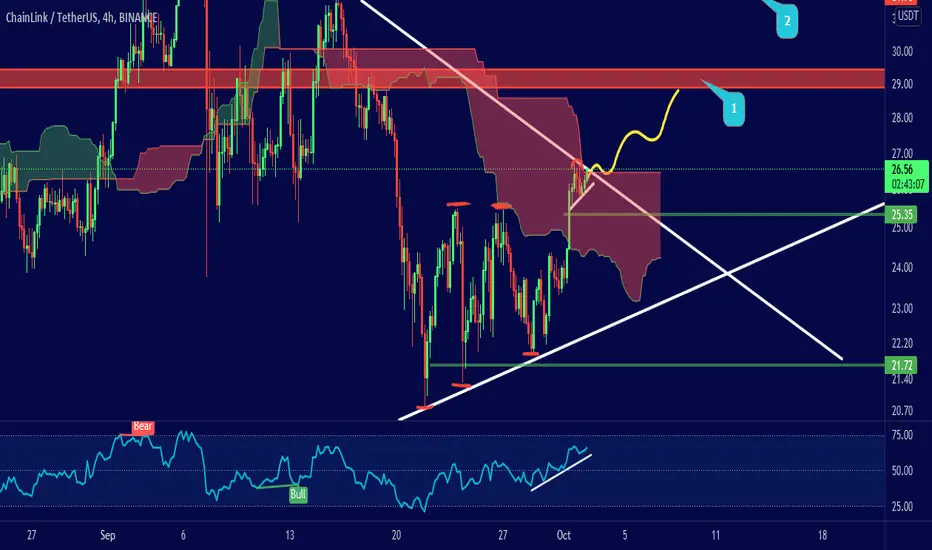
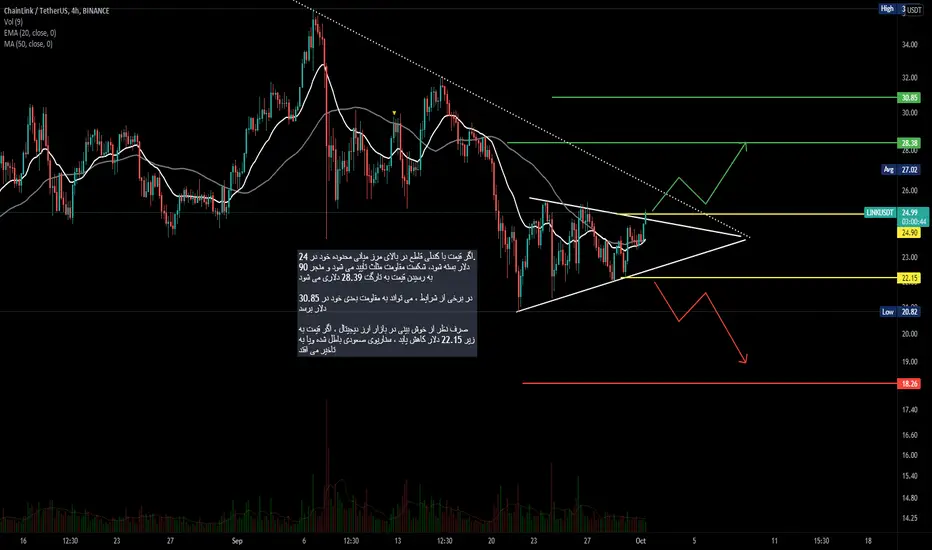
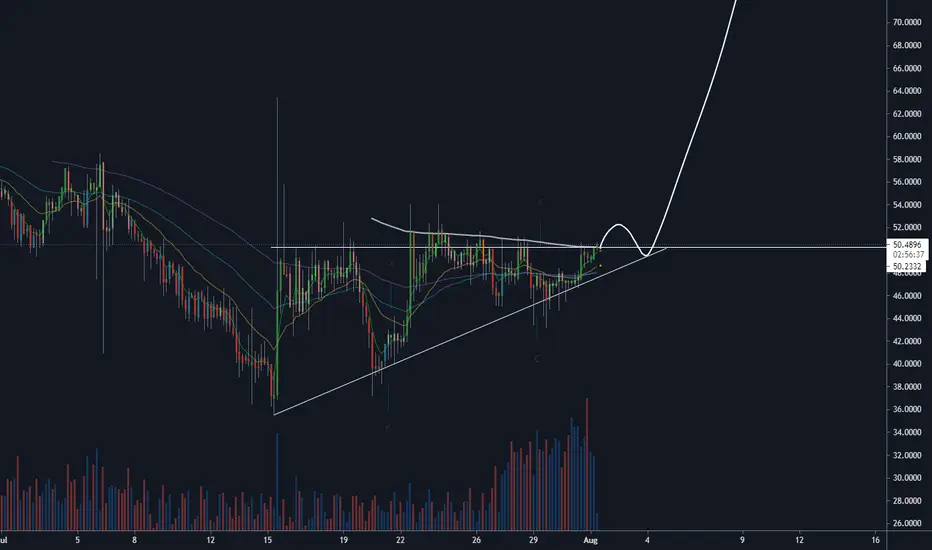
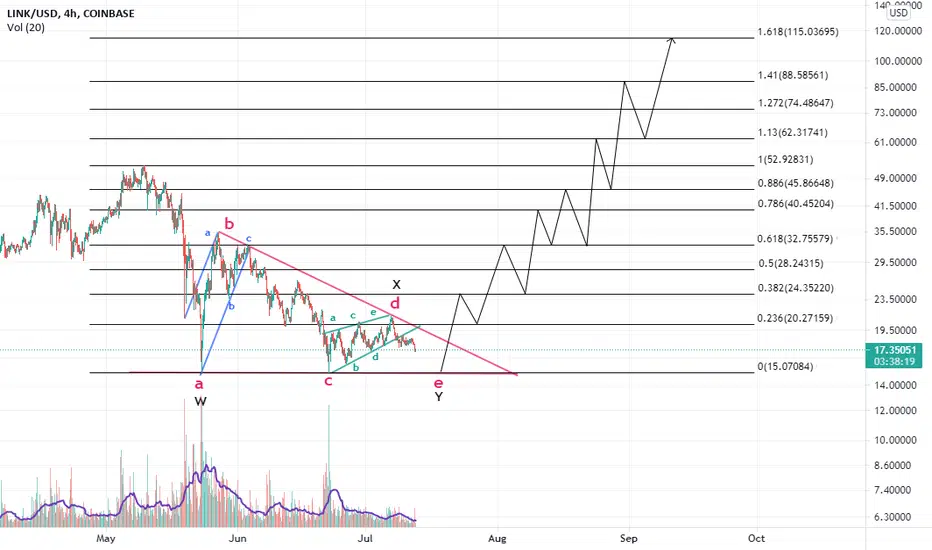
LINKUSDT 4HHi everyone
If the price closes with a decisive candle above the mid-range of $ 24.90, the triangle resistance will be broken and the price will reach the $ 28.39 target.
In some cases, it could reach its next resistance at $ 30.85
Regardless of the optimism in the digital currency market, if the price falls below $ 22.15, the uptrend will be canceled or delayed
Do you think the uptrend will continue?
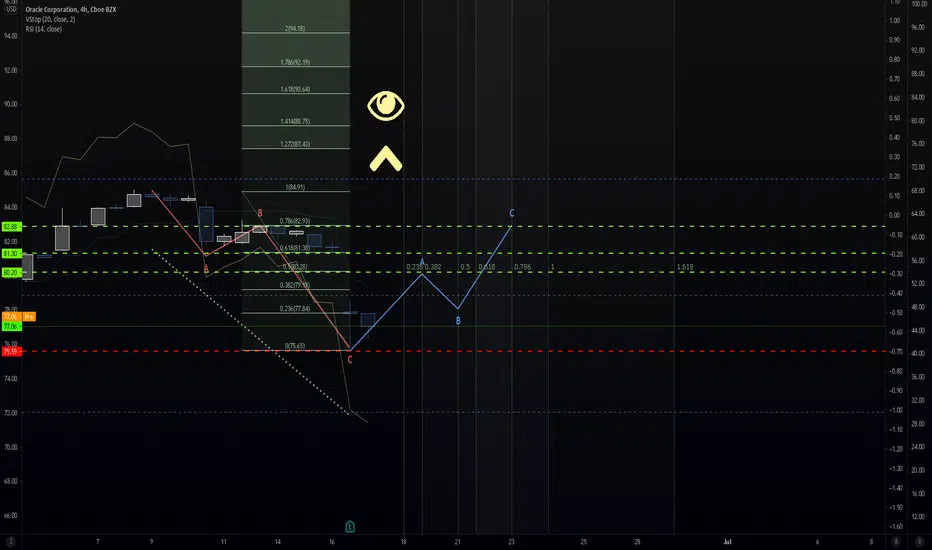
Local recovery for Oracle. ORCLVery short term outlook in this idea in an otherwise bearish tangent. Oracle Pivoted a while ago without yet establishing the lowest of lows.
Fibonacci goals are in green, and invalidation is in red. We know of no more powerful tool in analyzing the markets other than NeoWave/Elliott Wave theory when correctly combined with a few tools in out belt. Make sure to remember that this is not financial advice, and we never give financial advice on this channel. It is your job to create or seek out your own. Good luck out there and be smart!
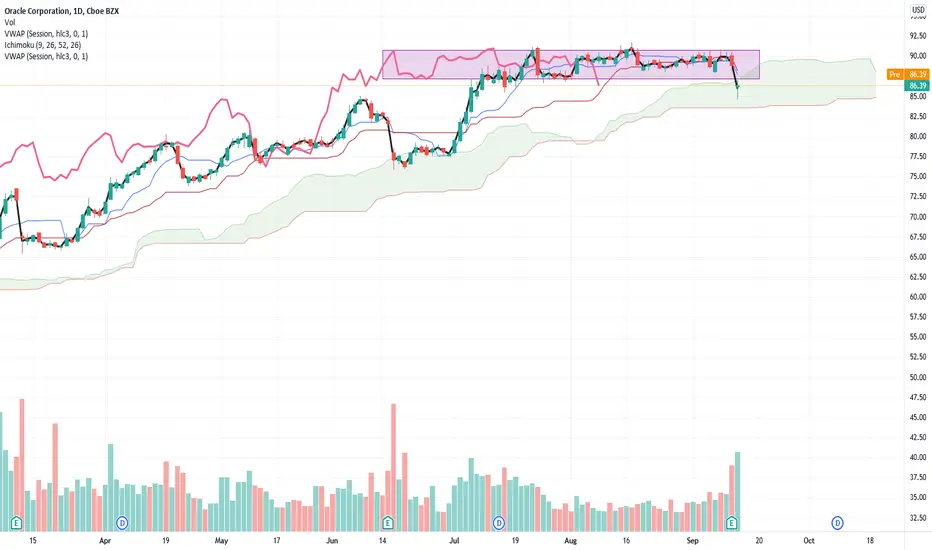
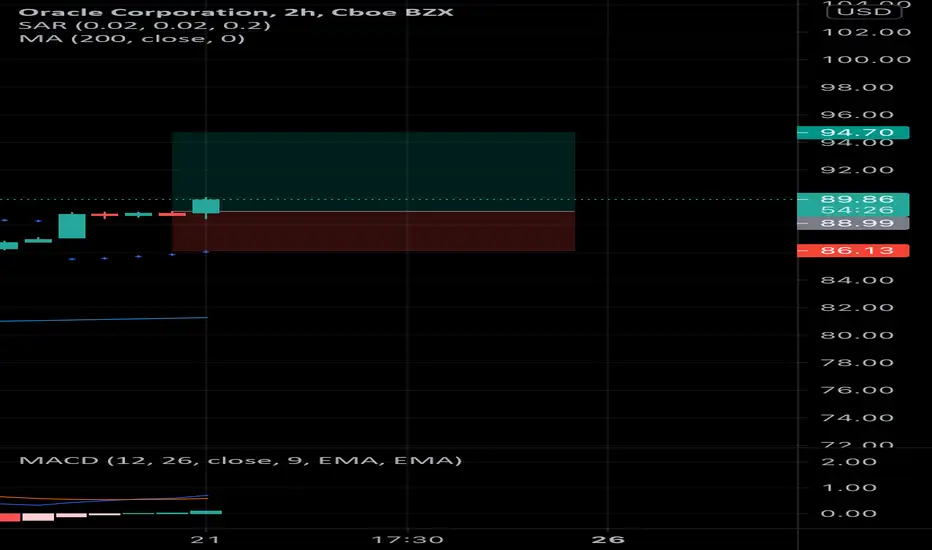
ORCL : Oracle Next steps ?the trend is bullish, a range phase bteween 07/22 and 09/13
the Price break the limit inferior of this range, the chinkou span also, but today candle is a signal to re- integrate this range.
if we break on closur the kijun (86.28) is a signal of the weakness of the trend.
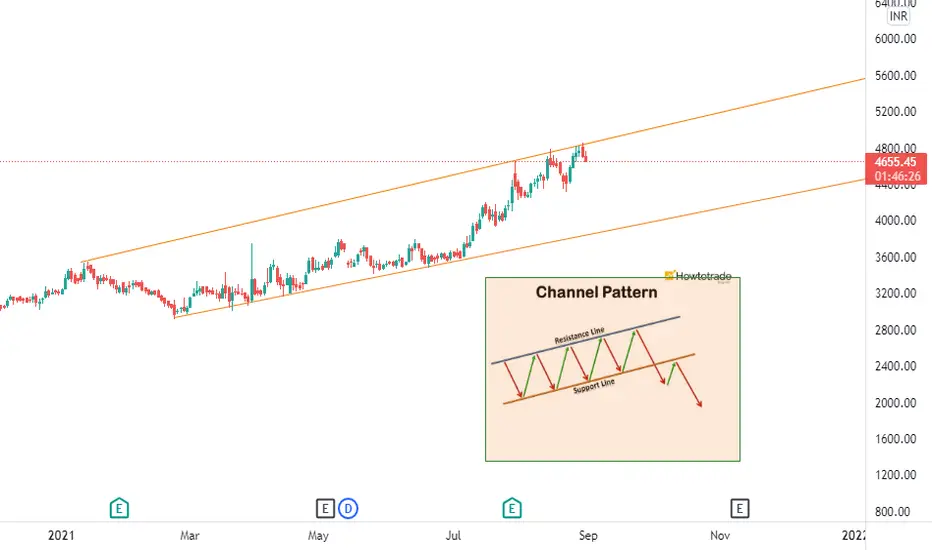
OFSS CHANNEL PATTERNHello
Welcome to this analysis about OFSS , we are looking at daily timeframe perspectives. OFSS is developing here that will be a decisive factor in the upcoming times. I discovered the main formation OFSS is developing here that will be a decisive factor in the upcoming times. As when looking at my chart now we can watch there how OFSS has emerged with this key channel pattern marked in my chart with boundaries. which is an important resistance and also psychological resistance-mark together with the lower-boundary of the channel-formation a pullback
In this manner, thank you for watching my update-analysis about OFSS and its major channel-formation with the determining factors we need to consider in upcoming times, support the analysis with a like and follow or comment for more market insight!
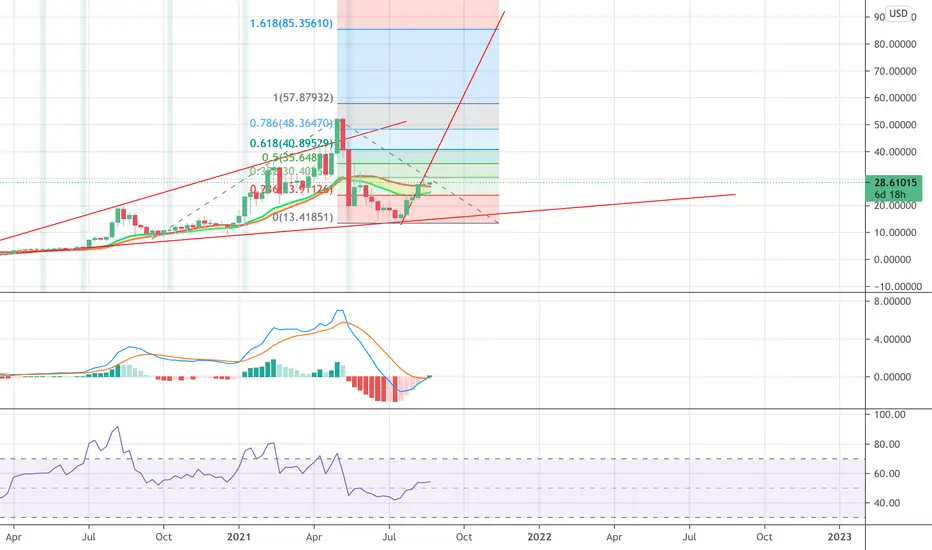
UMB/USDT is aiming at 100x in this crypto super cycleFibonacci overextension of 4.236 is giving us a price target of almost 7$. During the lowest low of this oracle network token, the price dipped down to 0.07$. During bullish time tokens with low market cap and strong fundamentals go through different scenarios. The one presented here is linear and steady grow based on the solid APY of almost 150% coming from staking for the next few months. The fist resistance level is technically at 0.236 fib and psychologically just below 0.5$. Overextending beyond the fibonacci of 4.236 is not unseen in the crypto world and it is regarded as a pump, printing a lambo candle on the chart.

LINK headed to $85+? Bullish weekly MACD crossAppears that LINK may be starting its next wave up. A couple of very bullish things worth noting. Link has now closed to weekly candles above the 21 week and 20 week moving average. The second weekly candle closed above the 20 week after testing the 21 week as support. Also - we have just gotten a bullish weekly MACD cross. The last time this happened LINK rallied over 350%. Maybe this will finally be LINK's time to shine, time will tell.
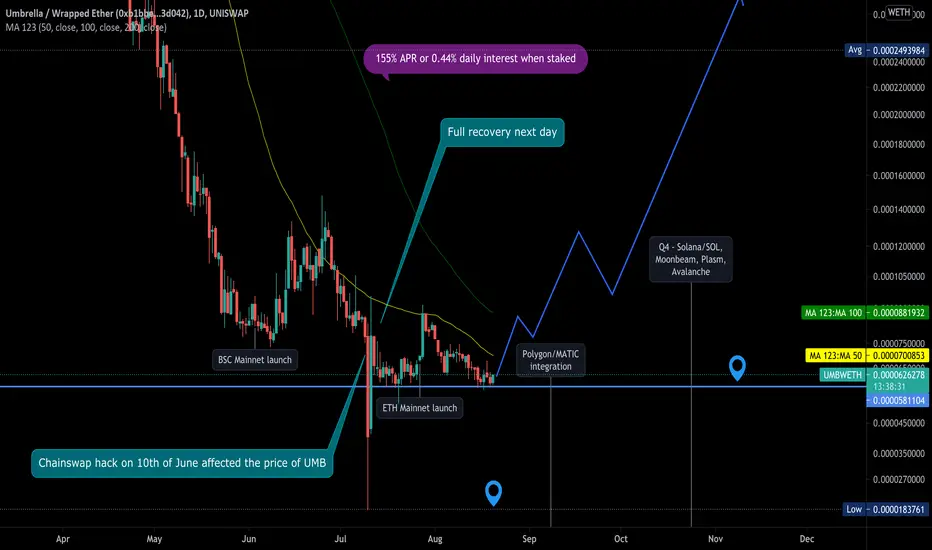
Umbrella offers 155% APR right now when staked softly0.44% daily interest on UMB when staked. Since everything is bullish right now, it is just matter of time to see this low market cap gem attracting investors and speculators.

$HAPI acending triangle$HAPI has had a lot of bullish news lately, with founder Dona Mara stating they found a way to burn 20% of the total supply.
HAPI a token with a max supply of 1 million, but will be lowered to 800k tokens... let the liquidity crisis begin!
LONG
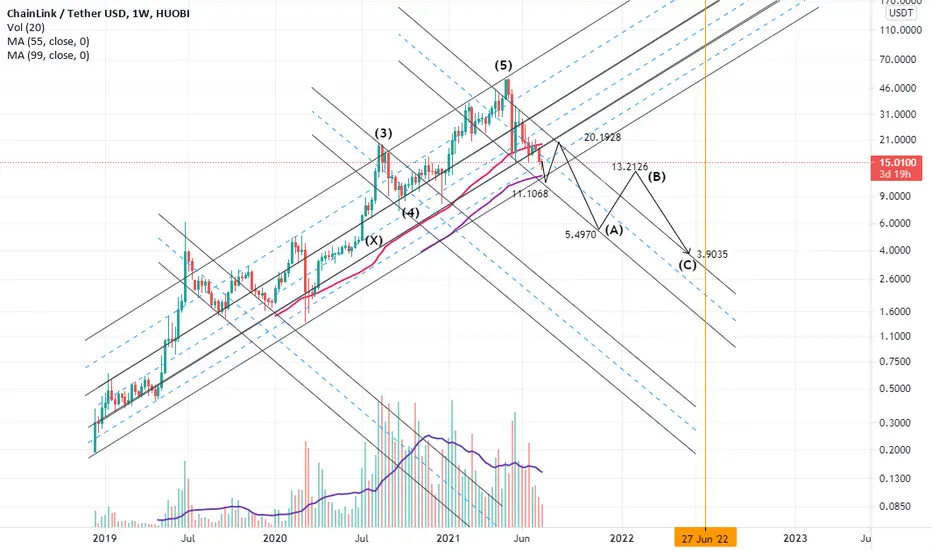
bearish ideashark harmonic pattern:
3-4=0.61 X-3
4-5=1.6 3-4
tp1=0.78 4-5=$11.1
tp2=0.88 X-3=$5.49
tp3=1.13 X-3=$3.82

oracle stock will crash !oracle stock will go down for the next weeks to come....
only sell for oracle till the next big support.
