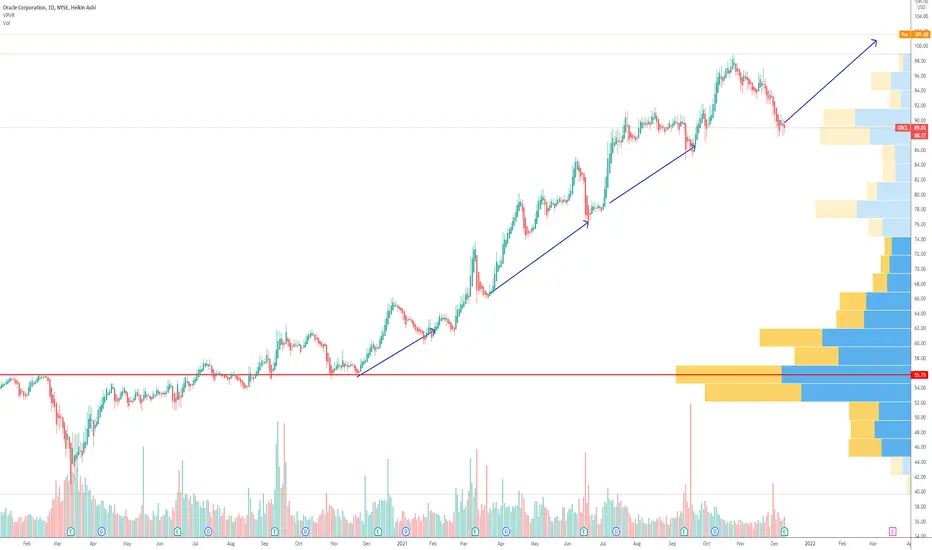
ORCL - Rising Trend Channel [MIDTERM]- ORCL shows strong development within a rising trend channel in the medium long term.
- It also gave positive signal from the double bottom formation at the break up through the resistance at 79.52.
- Further rise to 96.32 or more is signaled.
- ORCL has broken a resistance level in the short term and given a positive signal for the short-term trading range.
- ORCL has marginally broken up through resistance at 90.
- Overall assessed as technically positive for the medium long term.
*EP: Enter Price, SL: Support, TP: Take Profit, CL: Cut Loss, TF: Time Frame, RST: Resistance, RTS: Resistance to be Support LT TP: Long Term Target Price
Verify it first and believe later.
WavePoint ❤️
ORCL
Oracle to breakdown?Oracle - Expires 17/4 (30d) - We look to Sell a break of 81.98 (stop at 85.22)
Although the bulls are in control, the stalling positive momentum indicates a turnaround is possible.
Broken out of the channel formation to the downside.
Previous support at 86.00 now becomes resistance.
A break of the recent low at 82.04 should result in a further move lower.
The bias is to break to the downside.
Our profit targets will be 73.88 and 71.88
Resistance: 86.00 / 88.00 / 91.22
Support: 82.04 / 79.00 / 78.06
Please be advised that the information presented on TradingView is provided to Vantage (‘Vantage Global Limited’, ‘we’) by a third-party provider (‘Signal Centre’). Please be reminded that you are solely responsible for the trading decisions on your account. There is a very high degree of risk involved in trading. Any information and/or content is intended entirely for research, educational and informational purposes only and does not constitute investment or consultation advice or investment strategy. The information is not tailored to the investment needs of any specific person and therefore does not involve a consideration of any of the investment objectives, financial situation or needs of any viewer that may receive it. Kindly also note that past performance is not a reliable indicator of future results. Actual results may differ materially from those anticipated in forward-looking or past performance statements. We assume no liability as to the accuracy or completeness of any of the information and/or content provided herein and the Company cannot be held responsible for any omission, mistake nor for any loss or damage including without limitation to any loss of profit which may arise from reliance on any information supplied by Signal Centre.

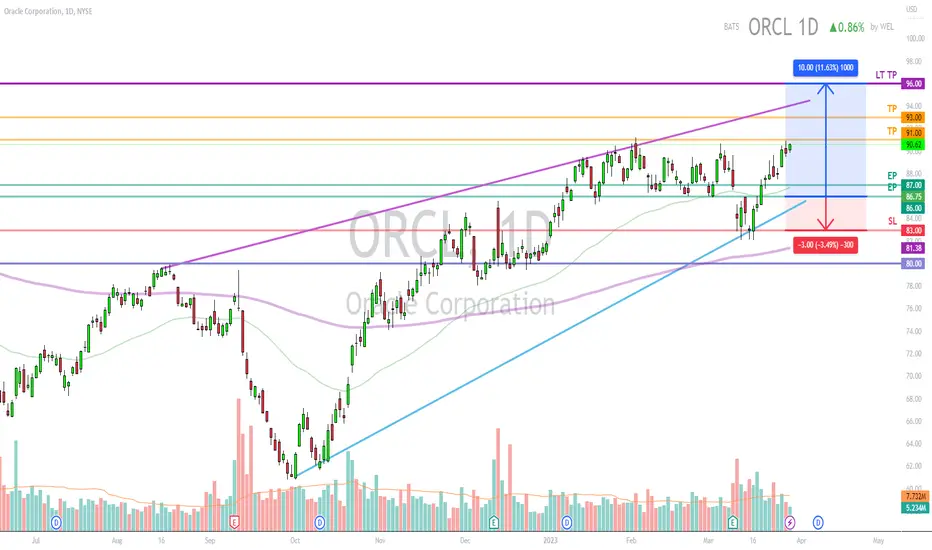
Oracle in a range.Oracle - 30d expiry - We look to Buy at 86.41 (stop at 83.42)
Price action continued to range between key support & resistance (86 - 90) although we expect a break of this range soon.
The bias is to break to the upside.
The primary trend remains bullish.
Preferred trade is to buy on dips.
The 1 day moving average should provide support at 86.40.
Posted Mixed Daily results for the last 56 days.
Our profit targets will be 93.88 and 94.88
Resistance: 90.00 / 91.22 / 92.00
Support: 88.00 / 85.87 / 84.00
Please be advised that the information presented on TradingView is provided to Vantage (‘Vantage Global Limited’, ‘we’) by a third-party provider (‘Signal Centre’). Please be reminded that you are solely responsible for the trading decisions on your account. There is a very high degree of risk involved in trading. Any information and/or content is intended entirely for research, educational and informational purposes only and does not constitute investment or consultation advice or investment strategy. The information is not tailored to the investment needs of any specific person and therefore does not involve a consideration of any of the investment objectives, financial situation or needs of any viewer that may receive it. Kindly also note that past performance is not a reliable indicator of future results. Actual results may differ materially from those anticipated in forward-looking or past performance statements. We assume no liability as to the accuracy or completeness of any of the information and/or content provided herein and the Company cannot be held responsible for any omission, mistake nor for any loss or damage including without limitation to any loss of profit which may arise from reliance on any information supplied by Signal Centre.

Oracle’s mixed financial image buffles investors
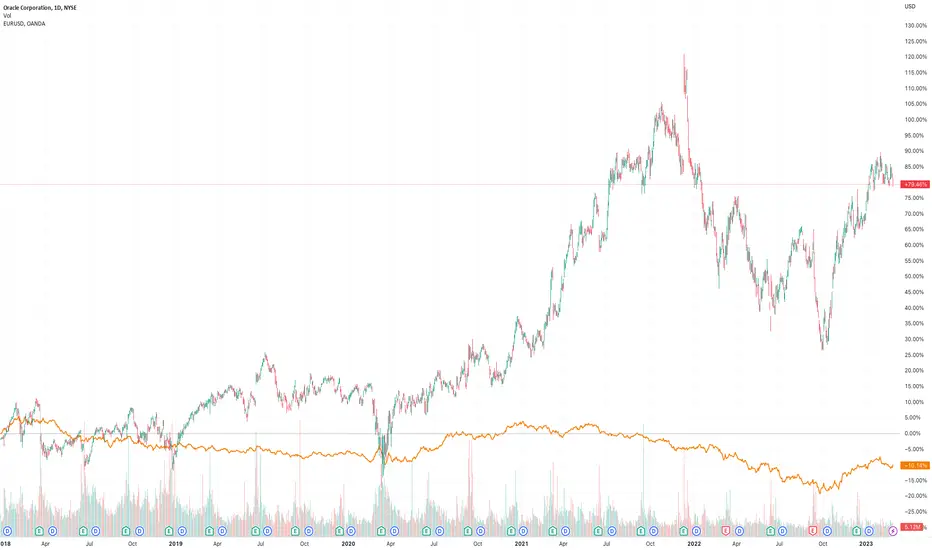
Shares in Oracle Corporation (symbol ‘ORCL’) have been trading in an aggressive bullish momentum for the last 5 months. The company is expected to report its earnings for the quarter on Thursday 9th of March. The consensus EPS is $0.95 compared to the result for the same quarter last year of $0,94.
‘Oracle’s payout ratio is around 40% indicating that the company is saving up most of their earnings for reinvestment in the company to influence growth while at the same time the company’s total liabilities are more than the total assets making investors hesitant to heavily invest in the near term. In addition the company’s intrinsic value ( what an asset is worth in a more objective calculation rather than just the share price) is around $86,40 while the share price is trading at $87,80 at the time of this report. This indicates that the share is slightly overvalued and investors might be waiting for a better price to buy the stock.’ said Antreas Themistokleous, an analyst at Exness.
On the technical side the price has been trading in an aggressive upward movement for the last 5 months and currently the price entered a descending trading range in the last month. With the Stochastic oscillator not showing any overbought or oversold levels the movement on the chart could be either direction.
The bulls for the time being look strong with no signs of reversal yet while the 50 day moving average and the lower band of the Bollinger bands are acting as a support on the price around the $86 price area.
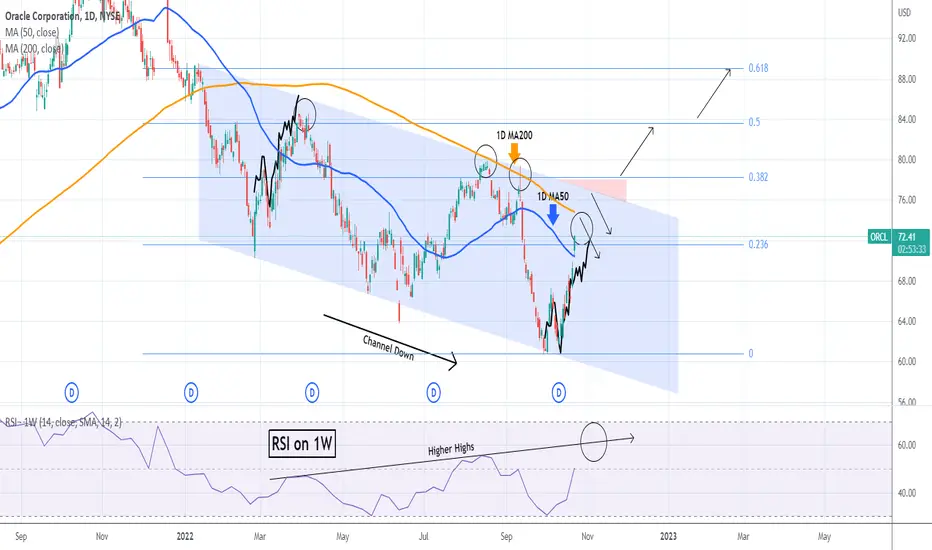
ORACLE Bullish as long as the 1D MA50 supports.Oracle Corporation (ORCL) is on a Channel Up within a Channel Up (blue) that is rising despite the Channel Down (bearish divergence) on the 1D RSI. We are now exactly on the 0.618 Fibonacci retracement level, which is the highly critical Golden Ratio. As long as the 1D MA50 (blue trend-line) is holding, then the Channel Up will eventually push higher towards the 0.786 Fibonacci (96.50). A break below the 1D MA50, should re-test the 0.382 Fib (78.20) and depending on the time it breaks, potentially the 1D MA200 (orange trend-line) as well.
-------------------------------------------------------------------------------
** Please LIKE 👍, FOLLOW ✅, SHARE 🙌 and COMMENT ✍ if you enjoy this idea! Also share your ideas and charts in the comments section below! **
-------------------------------------------------------------------------------
💸💸💸💸💸💸
👇 👇 👇 👇 👇 👇

Oracle: Sweet Temptation 🔥Oracle is moving dangerously close to the resistance line at $85.58, which would activate our alternative scenario. In that case, the stock would rise further into the green target zone between $85.45 and $92.50 to finish off the grey wave alt.I before sinking back into a correction. Primarily, we expect the course to drop into the green target zone between $72.66 and $63.46 to complete the grey wave II. After completion, we predict Oracle heading North in the longterm.

$ORCL - Post dividend distribution dumpNot following the company's fundamentals or anything, just general market sentiment and macro along with obvious signs on SPY's head and shoulders. The pile up into safe dividend stocks & the additional pump done by dividend distributions on tech stocks which caused the recent 2-3w tech rally is over. The top is in for tech stocks and the price is about to be "Stabilized" lower than it's normal trading range. The move has already started as you can see from the spinning top you can see on the chart.
ORCLLooking like a good setup at it has gotten rejected at the price trendline several times. It will be interesting to see if it breaks the RSI daily trendline and comes back down to the golden pocket on the daily chart first, and then possibly going down to the lows. The weekly is above the 50 on RSI, but it went up rather fast. I could see a pull back even if it pushes higher.

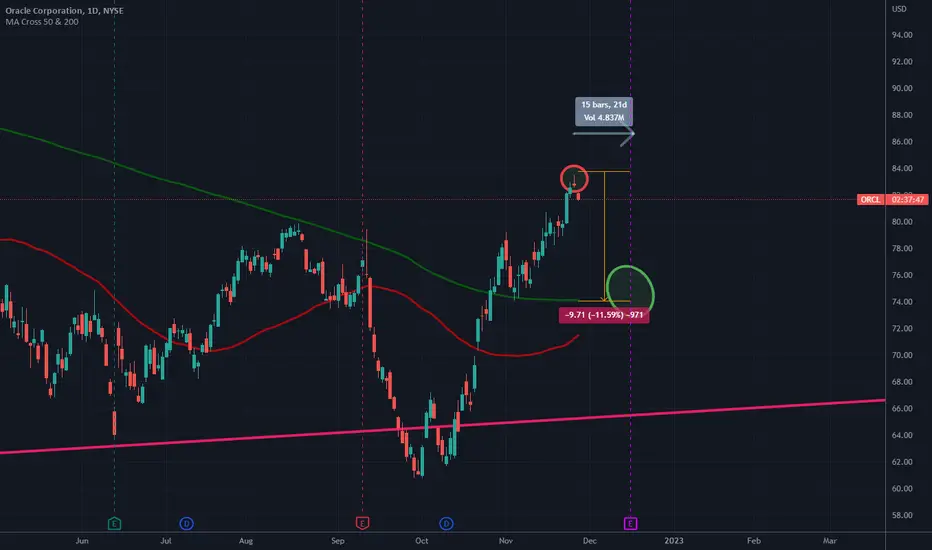
ORACLE Broke above the 1D MA50, first time in more than a monthThe Oracle Corporation (ORCL) broke today above its 1D MA50 (blue trend-line) for the first time since September 14. Within the long-term Channel Down pattern that the price has been trading in since January 12, this is the fastest break-out after a Lower Low bounce. Basically it resembles the fast rebound after the February 24 Low and in order for you to see the similarities I have plotted it on the current price action.
Technically, the top should be either on the 1D MA200 (orange trend-line) or the Lower Highs trend-line of the Channel Down. A break above the Lower Highs though, and more importantly the 0.382 Fibonacci retracement level, can potentially be a signal that the long-term sentiment has shifted back to being bullish and the upper Fibs should be targeted. It is worth noting that while the price has been trading on Lower Highs, the RSI on the 1W time-frame has been trading on Higher Highs. This divergence could be an early sign of an upcoming trend change.
-------------------------------------------------------------------------------
** Please LIKE 👍, SUBSCRIBE ✅, SHARE 🙌 and COMMENT ✍ if you enjoy this idea! Also share your ideas and charts in the comments section below! This is best way to keep it relevant, support me, keep the content here free and allow the idea to reach as many people as possible. **
-------------------------------------------------------------------------------
You may also TELL ME 🙋♀️🙋♂️ in the comments section which symbol you want me to analyze next and on which time-frame. The one with the most posts will be published tomorrow! 👏🎁
-------------------------------------------------------------------------------
👇 👇 👇 👇 👇 👇
💸💸💸💸💸💸
👇 👇 👇 👇 👇 👇
ORCL SqueezingKeeping an eye on ORCL in the next few days.
Price is squeezing inside a falling wedge.
I would love to see price breaking above the trendline and 67.50 level.
Can possibly long there towards 70

ORCL beautiful setupBeautiful descending triangle pattern.
For the downside scenario, price must break below 69 which has been strong.
Below that we might see an acceleration to the downside towards 64
A break above 71.54 could have price moving towards 74
Keep both directions in play

$ORCL Fade The News IdeaOracle shares rise on better-than-expected earnings report - CNBC
My thought process on this idea is the following:
1) 10yr yield @ 3.33
2) Strong dollar
3) Fed potentially raising .75 basis points, according to J.P. Morgan.
Risk/Reward and environment is to the downside. If NASDAQ catches a bid and dollar/yields cool off, this may be a nice long. As of right now, it is a short the rip environment.

Getting closer to the outside month triggerWe bounced off it last week and I am pretty sure we are headed back there. The trigger for the 50% on the month is also around our weekly trigger for a 3-2-2d. 4/29 $74 contracts have 3800 volume .
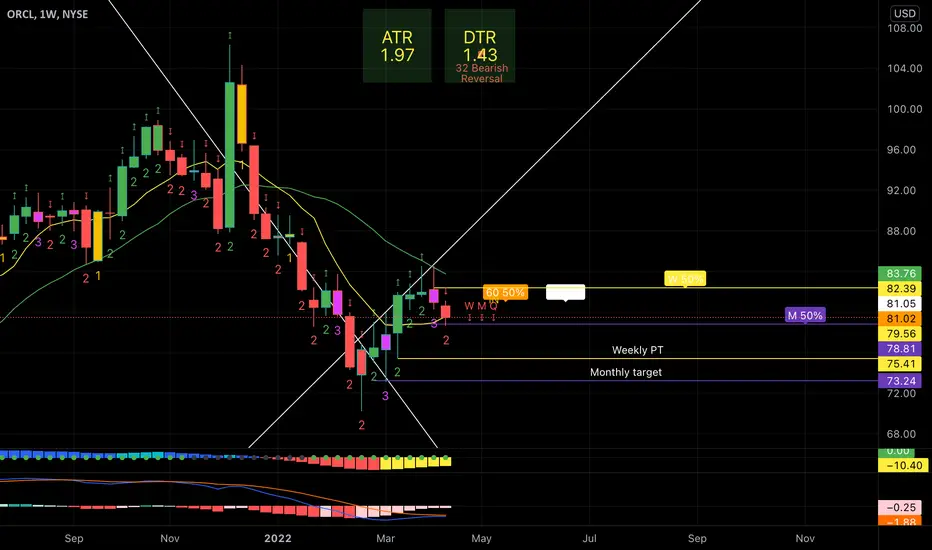
ORCL possible outside monthWatching ORCL for the trigger around 78.85. This gives us the #sss50percent rule trigger for the month. Target 73. Remember as a monthly target, this contract may need some time. Looking on the week, we already started the 3-2.

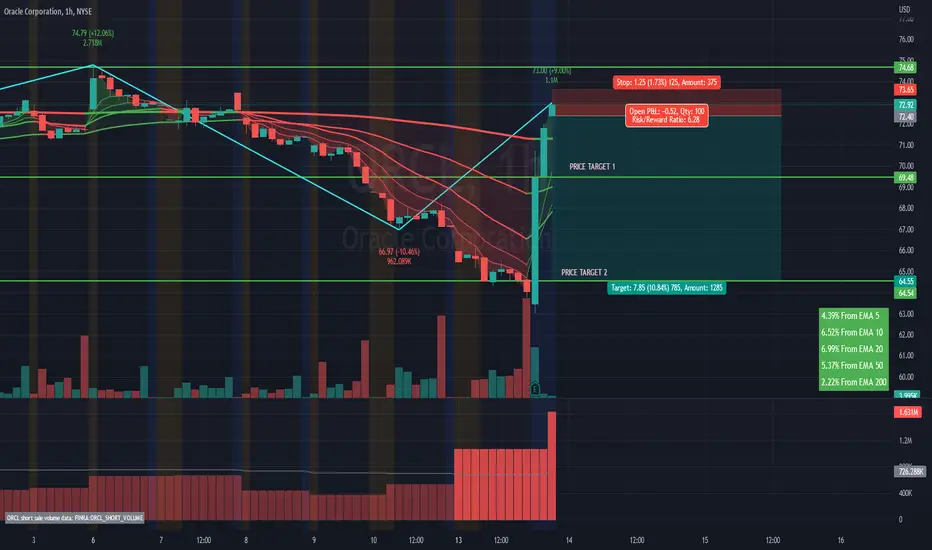
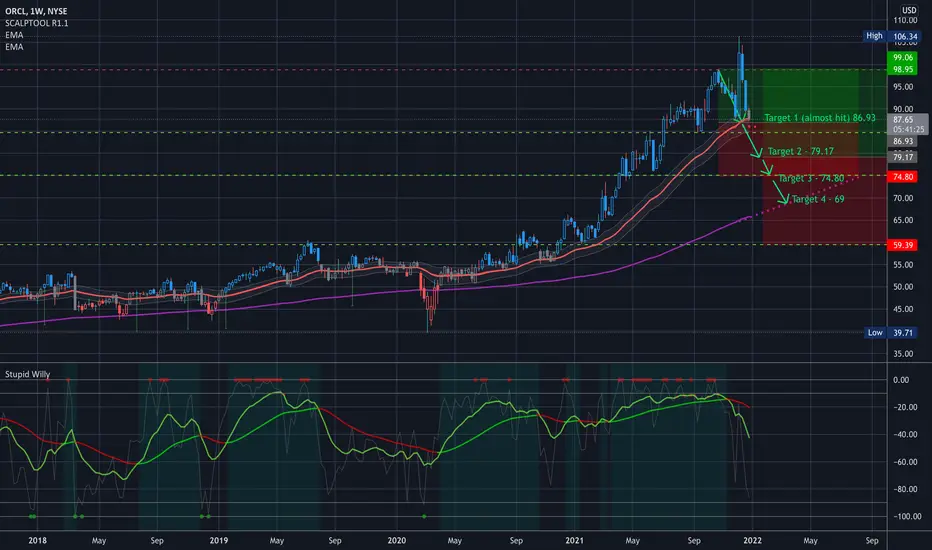
$ORCL Analysis, Key levels & targets $ORCL Analysis, Key levels & targets
Alright… Here’s the ORCL battle plan --- looking to start a position at 79.17
And then all of the targets below are add levels…
I’m really looking forward to this one 😏
——————
I am not your financial advisor, but I will happily answer questions and analyze to the best of my ability but ultimately the risk is on you. Check out my ideas, but also do your own due diligence.
I am not a bull. I am not a bear. I just see what I see in the charts and I don’t pay too much attention to the noise in the news.
If you want me to analyze any stock or ETF just leave me a comment and I’ll do it if I can. (If I have time)
Have fun, y’all!!
(\_/)
( •_•)
/ >🚀
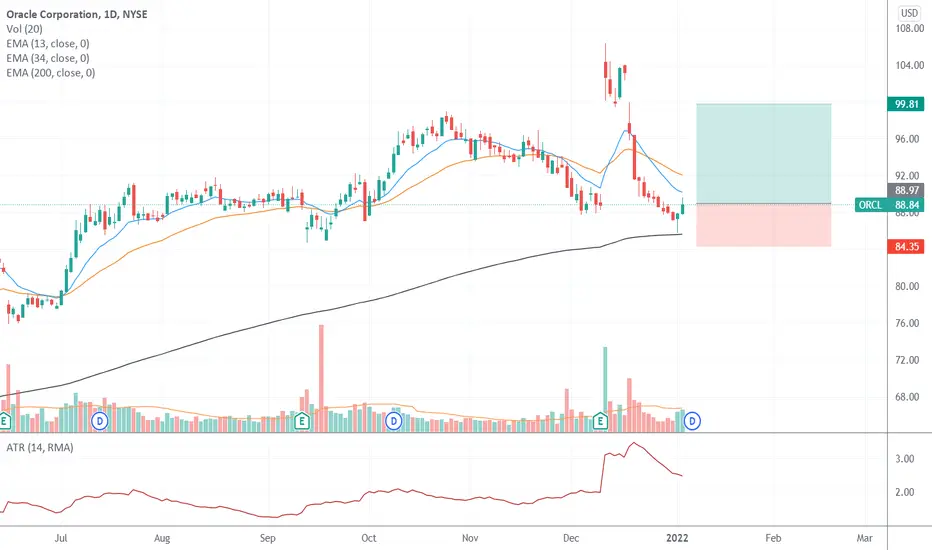
Buy oracle (ORCL) 5/1/2022You can buy ORCL target 99.8 stop loss 84.35
Money management your responsibility.
I recommend entering a maximum of 10% of the portfolio.
Good luck
$ORCL Deep oversold bounce back into historical channelNice hammer doji on the daily signaling a possible reversal. Bouncing nicely off historical support. Looking for a move back to the supply zone for a nice ~4% move. Time horizon ~2weeks.

ORCLOversold and bounced off a weekly support with very strong bullish sentiment. Expected a move to the upside.

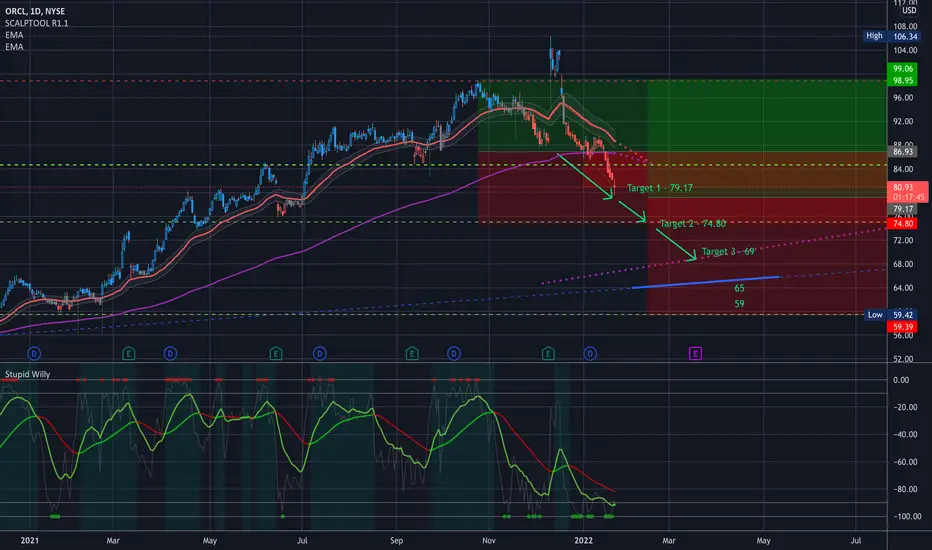
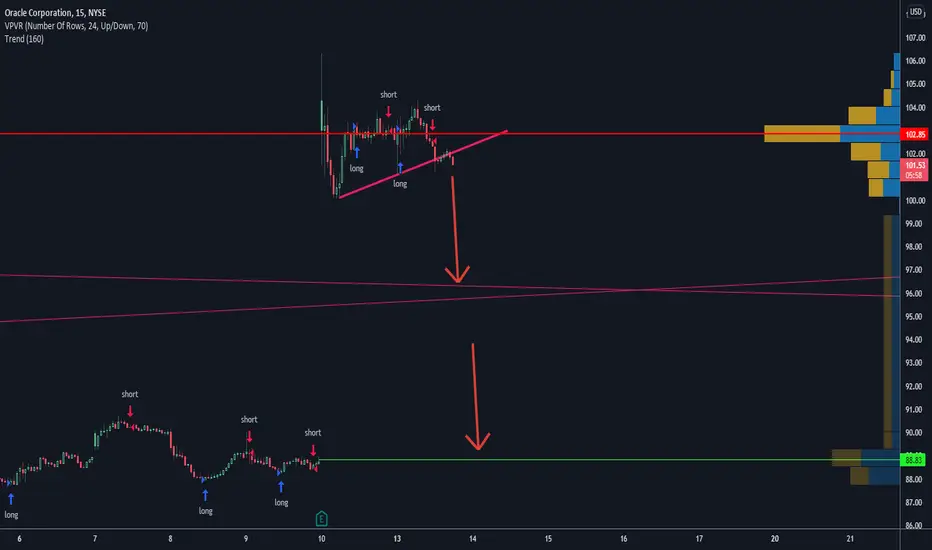
$ORCL Key Levels & Analysis $ORCL Key Levels & Analysis
No position here yet… but looking to targets 2-3 for a starting position as see where it goes from there…. Will update when I take a position…
——————
I usually trade both ways, but lately I’ve been focusing more to the downside because of how high the market is. It makes more sense to sell puts right now, and I’m usually at Target 2.
——————
I am not your financial advisor, but I will happily answer questions and analyze to the best of my ability but ultimately the risk is on you. Check out my ideas, but also do your own due diligence.
I am not a bull. I am not a bear. I just see what I see in the charts and I don’t pay too much attention to the noise in the news.
Very often you have to look at my charts from the perspective of where I’m looking to sell puts. But I also do open positions still once in a while.
If you want me to analyze any stock or ETF just leave me a comment and I’ll do it if I can.
Have fun, y’all!!
(\_/)
( •_•)
/ >🚀
ORCL Short Setup Not sure of the reason, may just be because it's over-extended. Or could be that they own Javascript which is the source of the huge hack that hit headlines today. Also was pushing 30 p/e..
(Opinion only)
Software at 200sma + HorizontalIGV, a Software based ETF, is currently at the 200sma which has shown support before. It is also at horizontal support from February highs.
Trade setup is drawn in chart. The risk-reward-ratio is above 4.
Top 10 holdings
MSFT (10%)
CRM (9%)
ADBE (9%)
INTU (7%)
ORCL (6%)
NOW (5%)
ADSK (2%)
PANW (2%)
SNPS (2%)
WDAY (2%)
Good luck.

ORCL best growth quarter since 2018Oracle (ORCL) reported revenue of $10.4 billion, up 6% growth YoY vs company’s guidance range of 3% to 5%.
Street consensus forecast was $10.2 billion.
ORCL quarterly earnings of $1.21 per share VS Consensus Estimate of $1.11 per share.
Earnings surprise of 9.01%.
My price target is 100usd, similar to Citigroup`s.