ORCL

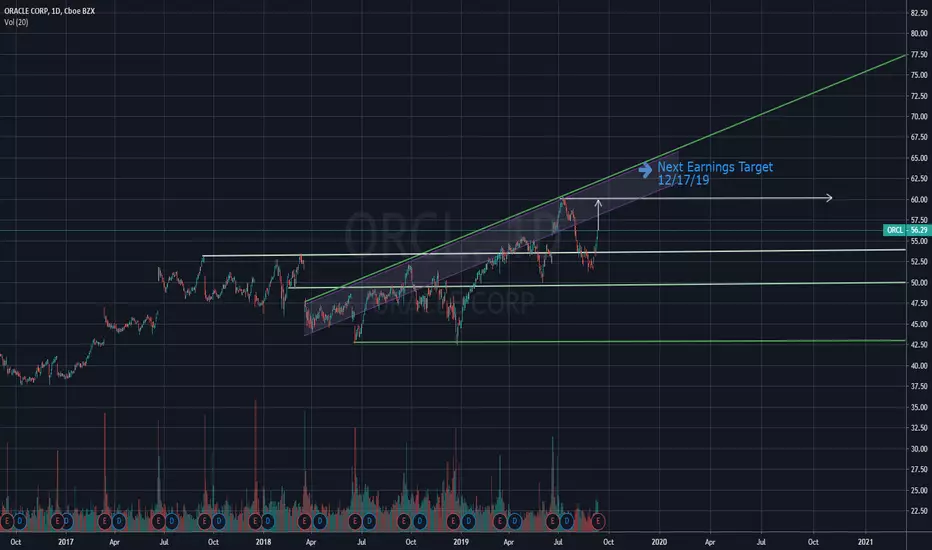
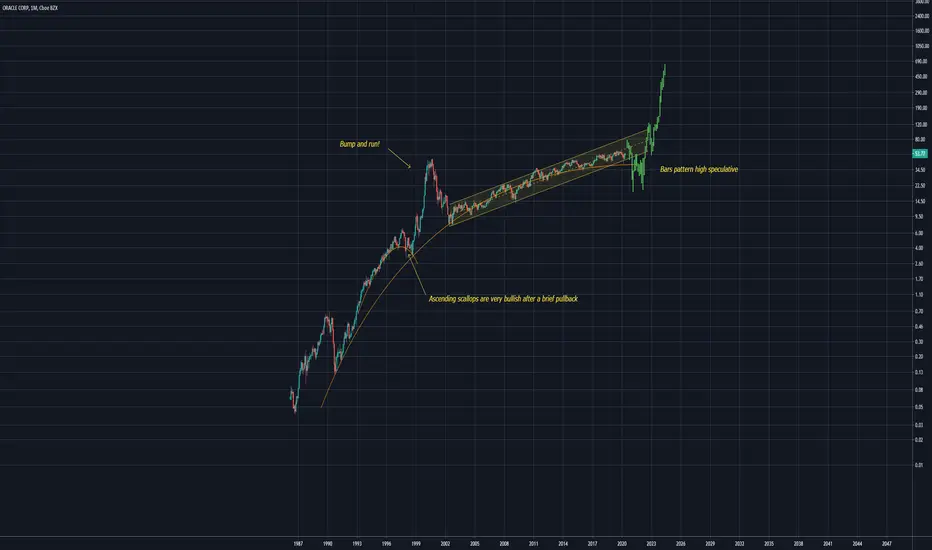
ORCL WEEKLY CHANNELORCL has set a perfect channel can be seen between the green lines. If it can be succeded to break the first resistance, it may target the second resistance which is the second green line. Red line is support line.

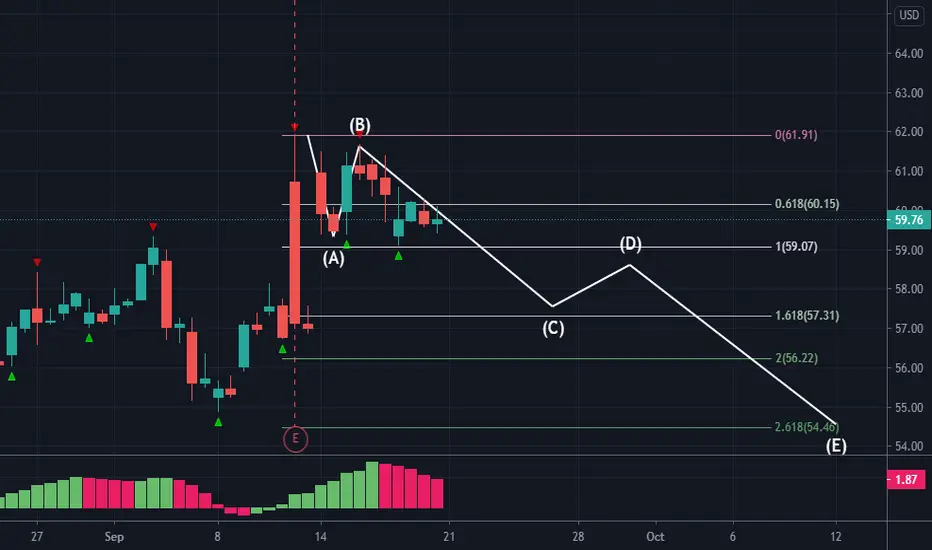
ORACLE CORP. SHORT📉 NYSE:ORCL SHORT H4
🛒SELL BELOW = 59.05
🎯Target1 = 57.35
🎯Target2 = 56.20
🎯Target3 = 54.50
🛑Stop loss or cancel trade = 61.90
🙈Recommended risk = (1%-2%)
#ORCL #ORCLSHORT #SHORTORCL #ORCLSELL #EAORCL
+$3010 today with 2/3 wins Hi Guys,
Won in WKHS & $PTON which were on the watch list and lost in $ORCL which was not!
+$3010 for the day,
Enjoy,
Enda

ORACLE SPECULATION $60 BILLION (TIKTOK DEAL)ORACLE SECURES DEAL WITH TIKTOK JUST AS TRUMP BAN IS INITIATED. TIKTOK NEW VALUE REPORTED TOWARD $60 BILLION.
~
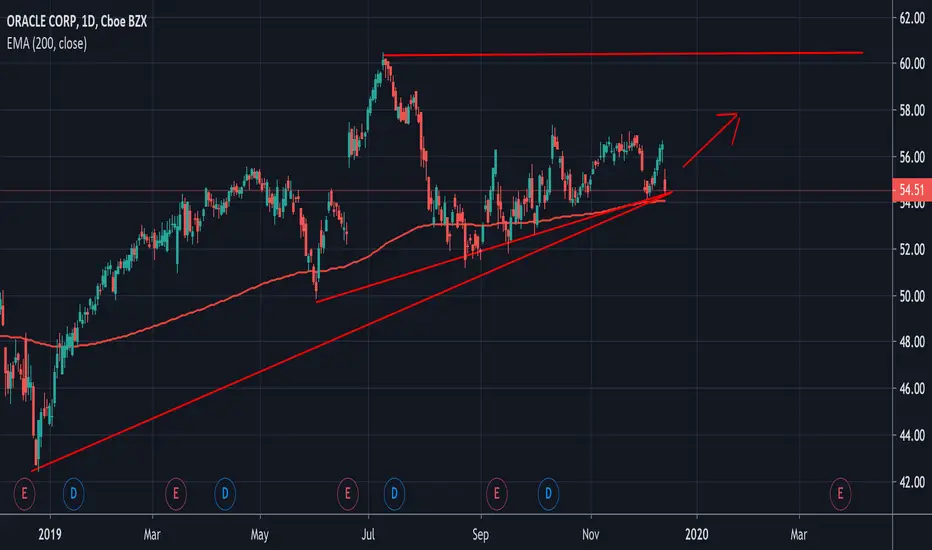
The stock currently sits below a possible future support at $60.5, Moving forward we need a break and close before I even think of entering.
Watching the orange trend lines as support and resistance, it holds strong on the weekly timeframe .
Possible buy on a break and hold of resistance @ $60.5.
Upside targets: $$63.63, hold beyond at your own risk
Possible Short Entry if break and hold below $57
CAUTION: I hate playing news, this Tiktok bs is getting out of hand. Play at your own risk
DotcomJack | Michael Jordan of Stonks

Oracle Tik Tok Deal NOT finalized, proceed with cautionTik Tok and Oracle deal not officially approved by Trump yet. Government overall concerned that Oracle only wants a partial ownership (20% I think), and is not outright buying all the software like Microsoft had planned to do. Bytedance will still be majority shareholder, overall this deal could fall apart quickly, so be careful with overall share prices severely overinflated and overbought. Copyright Rohan Karunaratne 2020

ORCL to 70+ next few weeks?* one view here is an inverse head and shoulders with a neckline at either 55 or 60
* another view is just a cup-n-handle formation with a clear break to the upside
* obviously tiktok deal cements their advertising business; are they transitioning to an advertising company? (dont forget they bought bluekai. could there be a re-valuation, like we saw with aapl?)
* implied volatility in the options market seems very depressed.
* expansion of bollinger bands suggests an increase in average implied volatility could be coming and prop up longer dated OTM options
* clear break to new highs from lengthy base
* appears to be forming bullish flag after recent break to new highs
* imo, one of the most solid looking charts out there
* I am playing this with the following positions:
55 oct16 call
55 jan2021 call
85 mar2021 call

ORACLE CORP WINS TIK TOK DEAL (ROCKET TIME)TikTok has reached an agreement to sell its U.S. operations to software giant Oracle, a landmark deal that could redefine how the U.S. and China square off over the reach of their homegrown technology companies.
Oracle has reportedly won a deal to manage TikTok’s US cloud operations. Oracle had been rumored to be part of the bidding process to acquire TikTok, but The Wall Street Journal reports that the company has been selected as a “trusted tech partner” instead. This is different from an outright sale, and appears to suggest Oracle will be helping run TikTok’s US operations with its own cloud technologies.
News of an Oracle deal comes just an hour after Microsoft revealed it was no longer acquiring TikTok after its bid was rejected by TikTok owner ByteDance. Microsoft had been pursuing a deal to buy TikTok’s operations in the US, Australia, Canada, and New Zealand. It’s clear talks have swayed away from a full acquisition, with Oracle reportedly winning the bid to be a technology partner instead.
President Trump signed an executive order August 6th blocking all transactions with ByteDance, and the order demanded an American company purchase TikTok’s US business. The EO was intended to take effect within 45 days, although the president later signed a follow-up order giving ByteDance 90 days to sell or spin off TikTok in the US. This does not supersede the original deadline, though. As Department of Commerce secretary Wilbur Ross told The Verge: “Per the 45-day period outlined in the Executive Orders, the Department of Commerce is operating under a deadline of September 20th.”
An inverse or reverse head and shoulders pattern is also a reliable indicator which can also signal that a downward trend is about to reverse into an upward trend. ... The final rally after the third dip signals that the bearish trend has reversed and prices are likely to keep rallying upward.

ORCL breaking out of rising wedge amidst TIKTOK rumors ORCL breaking out of days long rising wedge with TIKTOK acquisition rumors coming to a close between ORCL vs. WMT and MSFT.
ORCL is at High of Week so it's hard to determine a target. My personal price target is 60.
Set a trailing stop for this one. Break above descending upper trendline has been confrimed. Now we wait for Monday.


ORCL TIKTOK Rumors may push for a break out of falling wedge ORCL has been consolidating lately but new fundamentals elements may push the price to break out of the falling wedge that it is currently consolidating in.
Technicals:
RSI looks healthy, MACD making golden cross.
Consolidation inside of falling wedge(near breakout)
Fundamentals:
TIKTOK acquisition rumor
Note:
Wait for confirmation of breakout to be safe.
ORCL LONG OR BUY , TARGET UP TO $68ORCL prepares to confirm the great "SHS" model at $56, a good opportunity to buy.
ORCL BUY : $56
TARGET : $68
STOP LOSS : $52.5
Wish you good deals!

THE WEEK AHEAD: ORCL, CCL, KMX EARNINGS; XLE, IWM, IYREARNINGS:
I'm not really seeing anything at the moment that meets my criteria for good liquidity, high rank/high implied to play this coming week for earnings-related volatility contraction plays.
While ORCL (53/44/9.8%) announces Tuesday after the market close, 30-day's only at 44 with the July at-the-money short straddle paying 9.8% of the stock price, which doesn't exactly get my motor running for a volatility contraction play.
CCL (47/142/31.6%) announces Thursday. It has the right volatility metrics and the July short straddle is paying a whopping 31.6% of the stock price, but most are playing this for a recovery from a coronavirus beat-down. For what it's worth, the July 15th 17 short put (19 delta; bullish assumption) is paying 1.17 at the mid price with a cost basis of 15.83 if assigned.
KMX (60/71/15.11%) announces on Friday morning, but isn't the most liquid thing in the world, with the July 17th 75/105 showing bid 3.60/mid 3.80/ask 4.00.
SECTOR EXCHANGE-TRADED FUNDS SCREENED FOR >35% 30-DAY:
XLE (55/61)
XLU (53/38)
SLV (51/38)
EWW (49/46)
GDXJ (49/63)
EWZ (45/61)
SMH (45/46)
GDX (45/41)
XOP (41/79)
USO (18/68)
Notes: I don't have any XLE on currently. The August 21st 32/48 (17 delta) is paying 1.76.
BROAD MARKET:
IWM (66/50)
EFA (42/36)
QQQ (41/34)
SPY (39/35)
Notes: If you're going to sell premium in broad market, small caps is probably the place to do it. Unfortunately, we're kind of mid-cycle here with July only having 34 days left in it and the August, 69, but if you're willing to go a bit longer with duration: IWM August 21st 113/159 (17 delta), paying 4.81.
DIVVY YIELDING EXCHANGE-TRADED FUNDS FOR THE IRA:
IYR (65/47)
EWA (57/44)
XLU (53/38)
EWZ (45/61)
HYG (45/26)
EFA (42/36)
SPY (39/35)
TLT (23/20)
EMB (23/18)
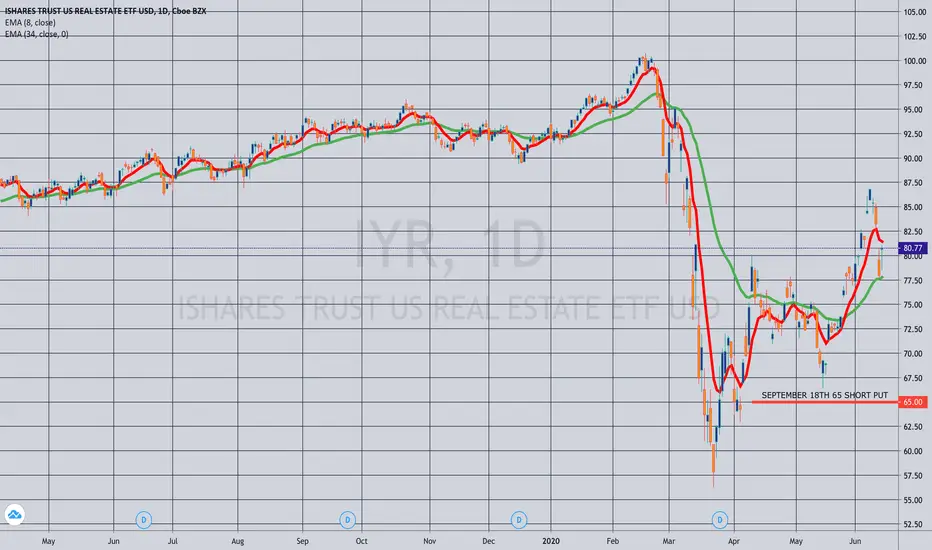
Notes: Pictured here is an IYR (3.51% yield) September 18th 65 short put paying 2.02 at the mid. I've been generally laddering out as an acquisitional play for the IRA, but July has only 34 days left, and there is currently no August (although there will probably be one post June opex), so a single September put would have to do.
Oracle Corporation (ORCL) long.All description on the chart.
Please, don't forget to like and follow.
Thank you.

ORCL - Inverse HnS and Earnings Coming UpTake a look at this chart for ORCL - long term consolidation pattern and an inverse HnS has formed. A break below the right shoulder would invalidate this trade to the upside. I plan to buy commons as well as calls out to August.
I hope we profit TOGETHER! If you found this to be insightful or helpful, please show appreciation by hitting that like button. If you want more ideas I invite you to follow as well! I try to be here for all of my followers with any questions they might have. Feel free to shoot me a DM or comment below to start a conversation!

Oracle Corporation (ORCL) short.All description on the chart.
Please, don't forget to like and follow.
Thank you.
THE WEEK AHEAD: CHWY, LULU, COST, ORCL EARNINGS; EEM, VIXEARNINGS:
It's a fairly light week for earnings, but there is some highly liquid underlyings to play for volatility contraction:
CHWY (--/74): Monday, After Market Close.
LULU (64/42): Wednesday After Market Close.
COST (44/23): Thursday, After Market Close.
ORCL (42/26): Thursday, After Market Close.
Pictured here is a CHWY January 17th 21 short put at the 20 delta, paying .78 at the mid price as of Friday close with a 20.22 break even. In this particular case, I'm not looking to play earnings for volatility contraction, but waiting for earnings to pass, as well as lock up to end, which is supposed to occur on the 11th (Wednesday) with a whopping 83% of outstanding shares subject to lockup. Depending on what happens with the share price at the end of lock up, as well as implied volatility, I will look to put on a play thereafter.
The only other play I'm potentially interested in is LULU, where the January 17th 190/200/260/270 iron condor is paying 2.61 with delta/theta metrics of -1.69/5.35. It's not a one-third the width setup, but LULU has had a tendency to move, so my inclination would be to go wider to stay clear of potential friskiness.
EXCHANGE-TRADED FUNDS:
UNG (55/54)
TLT (44/13)
USO (21/30)
GLD (19/10)
GDXJ (18/27)
With the possible exception of UNG, shorter duration premium selling isn't ideal here, with rank below 50% and 30-day below 35%.
As an interesting aside, however -- compare and contrast premium selling in UNG and USO versus trading /NG and /CL directly, using at-the-money short straddle pricing:
UNG January At-the-Money Short Straddle: 2.68 versus 18.03 (14.9%)
/NG January At-the-Money Short Straddle: .309 versus 2.25 (13.1%)
USO April At-the-Money Short Straddle: 1.75 versus 12.32 (14.2%)
/CL March At-the-Money Short Straddle: 6.76 versus 59.07 (11.4%)
BROAD MARKET:
EEM (8/16)
QQQ (7/16)
IWM (6/16)
SPY (2/13)
First Expiries in Which At-the-Money Short Straddle Credit Exceeds 10% of Value of Underlying:
EEM: June: --4.48 versus 43.07 (10.4%)
QQQ: June -- 21.49 versus 205.00 (10.5%)
IWM: September -- 20.05 versus 162.83 (12.3%)
SPY: September 34.46 versus 314.87 (10.9%)
As with the exchange-traded funds, short duration premium selling isn't paying here, so your choices are to hand sit or sell in higher implied volatility expiries farther out in time. I've been largely opting for the latter, while simultaneously exercising some restraint as to sizing, since the last thing you want to do is tie up buying power with longer-dated setups, only to have literally nothing left over to take advantage of shorter duration volatility pops. Secondarily, I've been managing these longer-dated setups more aggressively, taking them off in profit in many cases a good deal short of 50% max.
FUTURES:
/6B (60/12)
/NG (55/58)
/CL (21/29)
/6E (20/5)
/GC (19/10)
As with the exchanged-traded funds, volatility is in natty and oil with /NG paying in short duration (January). One thing I noticed is that /CL expiry-specific premium selling doesn't necessarily lend itself to going longer-dated (at least at this moment in time) since implied is about the same regardless of where you go (i.e., January: 28.9%; February: 29.5%; March: 29.3%), so all you're basically getting paid for is duration, as compared to -- for example -- expiry-specific implied in SPY, which generally increases incrementally over time (i.e., January: 14.5%; February: 15.7%; March: 16.8%, etc.). This is not necessarily a bad thing, just an observation of what you're getting by going out farther in time with /CL options versus other instruments that have a sort of expiry-specific implied volatility "term structure."
VIX/VIX DERIVATIVES:
VIX finished Friday at 13.62, with /VX futures contracts trading at 16.32, 17.51, 17.63, and 18.19 in January, February, March, and April respectively. Consequently, the contango environment remains productive for term structure trades in those expiries, although it's apparent that you won't get much trading February over January due to the fairly small differential between where those two contracts are trading at the moment. In practical terms, the February 17/19 short call vertical is paying .65 with a 17.65 break even versus 17.51; the March 17/19, .65, with a 17.65 versus 17.63. In other words, it doesn't pay to go longer in duration (February versus March) here ... .
As before, I'll look to put on bullish assumption plays in VXX or UVXY at extreme lows (these setups don't work well in VIX directly due to /VX term structure) and add bearish assumption in VIX, VXX, and/or UVXY on VIX pops to greater than 20 on top of any VIX term structure trades that I'm working ... .

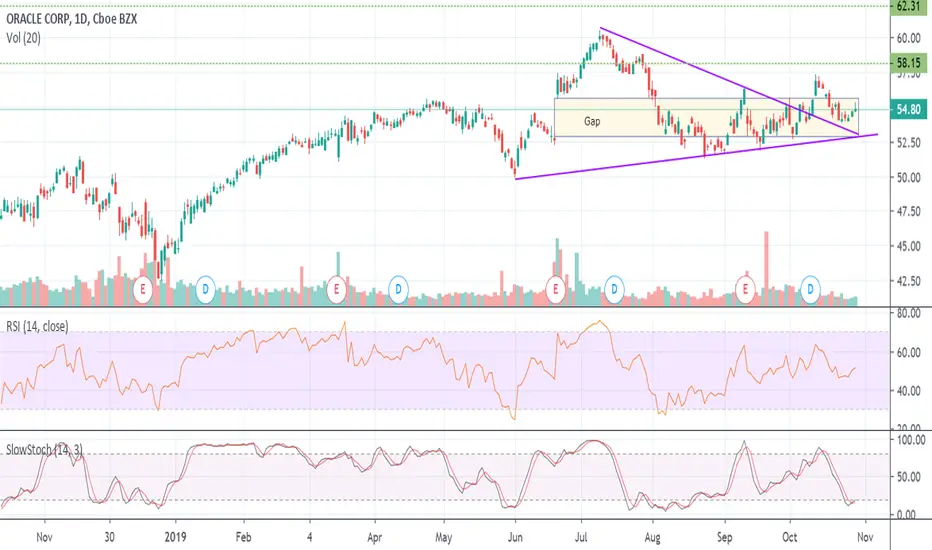
ORCL - A Bullish Future?The stock has created a symmetrical triangle pattern since the beginning of June. Also mixed into this pattern is an earnings gap halfway through the month. The price has continued to trade within this gap range but the consolidation has led to the stock price moving out of the triangle pattern. The recent pullback, while remaining in the gap zone, is now testing the previous triangle resistance line as support. The stock is also exiting an oversold position.
I have two Fibonacci Extension levels targeted. The 61.8% & 100% levels are noted by the dashed green lines should the bullish move continue.
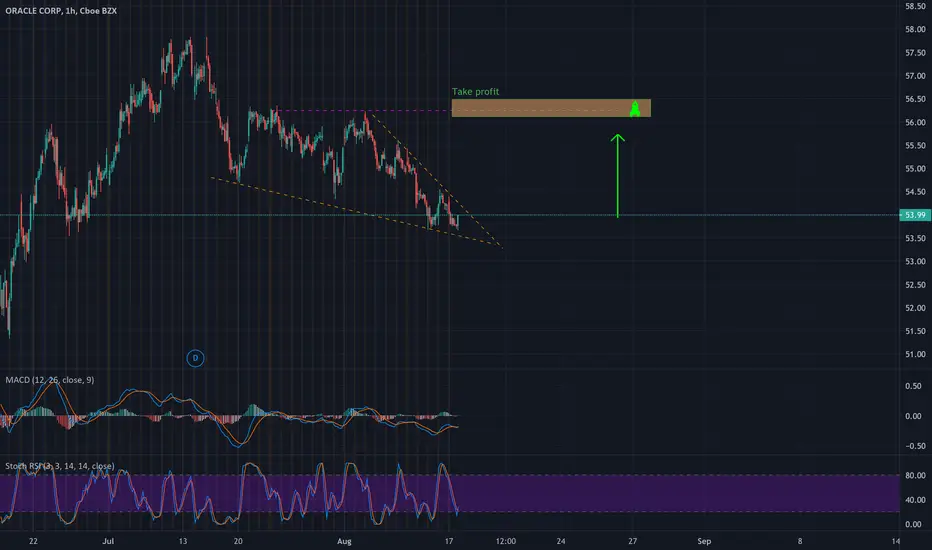
$ORCL Next Earnings could hit $63There is nothing stopping $ORCL breaking the into the 60's when the market opens.
Target $60 - $61 and take profit