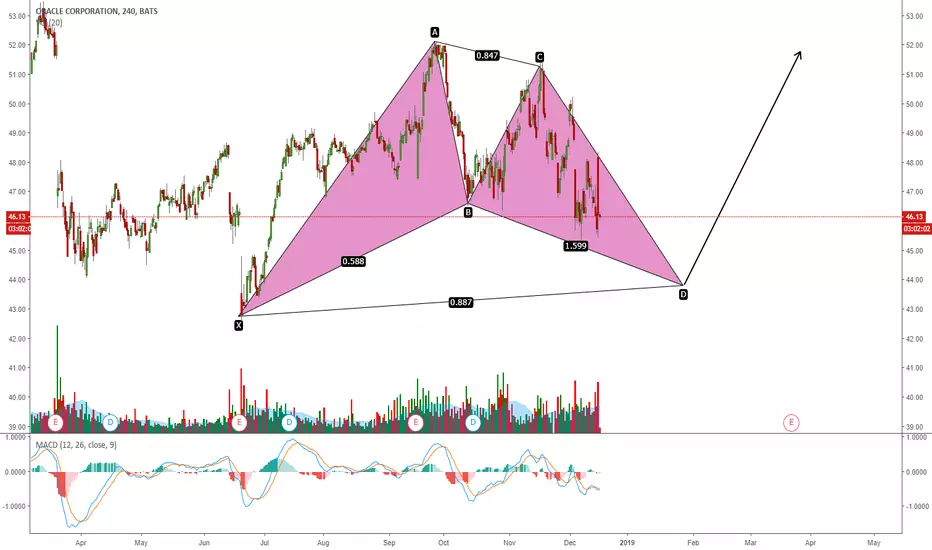
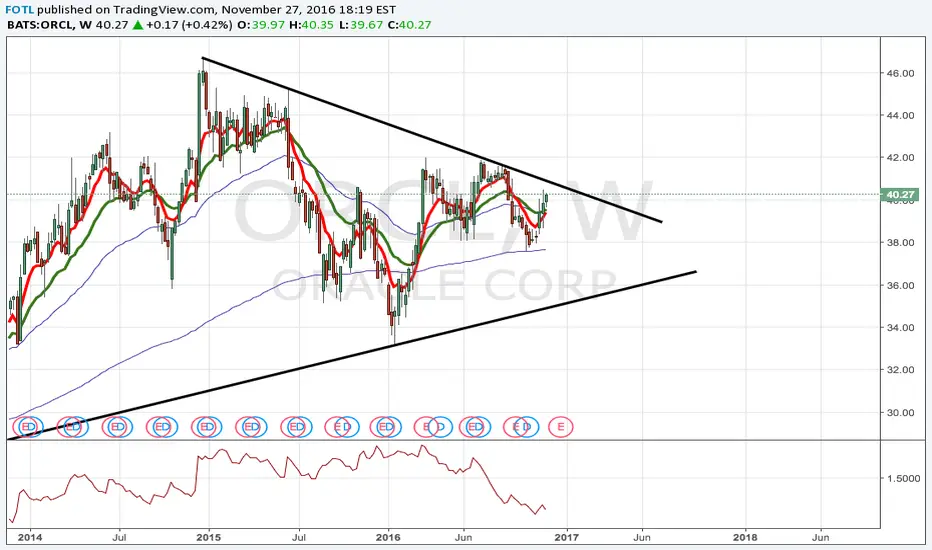
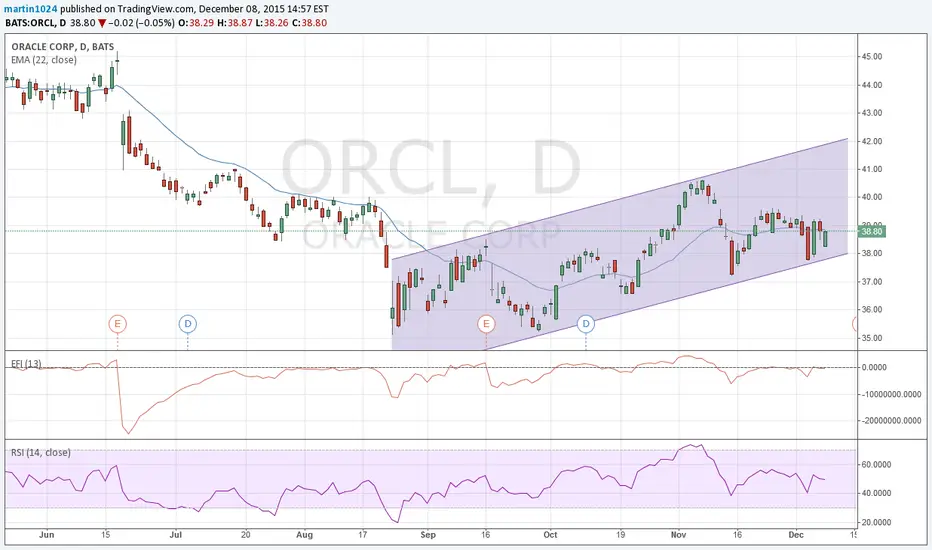
ORACLE: POTENTIAL HARMONIC PATTERN ON THE MAKINGORACLE is still in a downtrend. Look to the price action on the level posted on chart for a potential completion of this harmonic pattern
ORCL
THE WEEK AHEAD: ORCL, KR EARNINGS: EWZ, TSLA, CRONEarnings:
ORCL: Announces Thursday after market. Rank/IV: 74/31. Sept 21st 68% Probability of Profit 20 delta 45/50.5 short strangle: .79 credit.
KR: Announces Thursday before market. Rank/IV: 54/37. Sept 21st 72% Probability of Profit 20 delta 30/35 short strangles: .60 credit.
Non-Earnings:
EWZ: Rank/IV: 97/48
TSLA: Rank/IV: 95/57
GDX: Rank/IV: 68/30
USO: Rank/IV: 62/26
FXE: Rank/IV: 53/8
Others of Note:
CRON: Background IV at 138% on volume of 24.1 million shares. Oct 19th 70% Probability of Profit 9/19 short strangle: 1.30 credit.
See also (for other cannabis-related underlyings):
TLRY: Background IV at 135% on volume of 9.02 million shares.
CGC: Background IV at 98.5% on volume of 13.1 million shares.
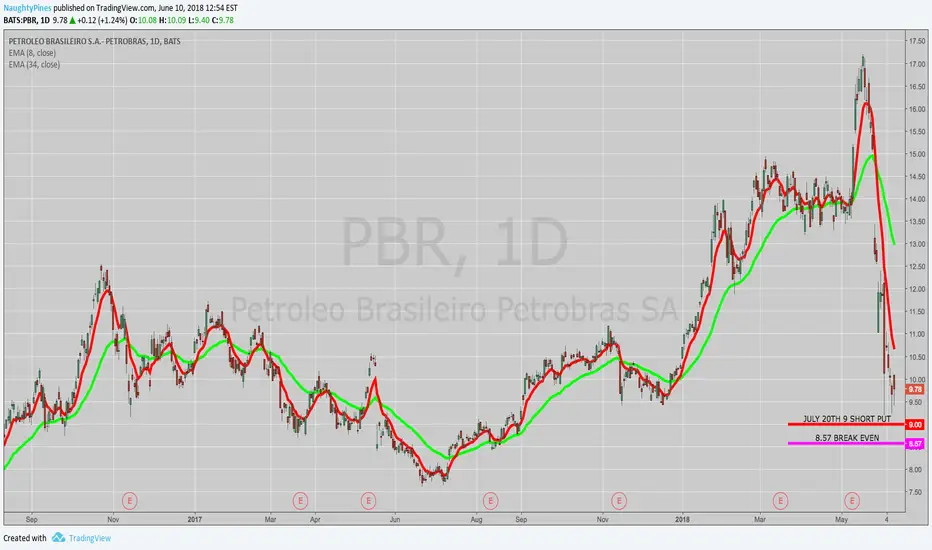
THE WEEK AHEAD: PBR, USO, GE, T, ORCL, EWZWith various things Brazilian in implosion mode, it's no surprise that PBR and EWZ have high implied volatility here.
PBR:
Bullish Assumption Setups: The July 20th 30 delta 9 put is paying .43/contract, resulting in an 8.57 break even, which isn't very compelling, but might appeal to some smaller account holders who are willing to hold the short put until near worthless and or roll for duration/further cost basis reduction should the worst not be over (check out the weekly). The natural alternative is a synthetic covered call with the short put at the 70 delta 11 strike, which pays 1.55, and gives you a 9.55 break even. I would work the synthetic as a "money, take, run" affair and look to take profit at 50% max or sooner.
Neutral Assumption Setups: The July 20th 10 short straddle pays 1.56 at the mid, with break evens at 8.44 and 11.56. Generally, I look to take profit on these at 25% (here, .39), but would naturally be prepared for a bumpy ride and to make adjustments as things unfold.
USO: I generally don't like this instrument a ton as a petro play due to its size, with my preferred go-to's being XOP, XLE, and (when in a pinch), OIH. However, if you're willing to go a little larger than you usually would with contracts, it can be productive. The July 20th 13 short straddle pays .93/contract and is skewed quite short delta wise (-20.93). To neutralize some of that, I could see doing a July 27th "double straddle" with one straddle at the 13 and one at the 13.5 (you need to move to the weeklies to get the half strikes). That would pay 2.01 per contract, give you break evens at 12.25 and 14.25, and reduce the directionality to -9.67 delta. Taking profit on the whole shebang at 25% max (.50) wouldn't be horrible.
GE and T: Both have earnings around the July monthly; I'd hold off putting on plays, opting instead to play for vol contraction around earnings ... .
ORCL: Announces in 9 days, so sit on your hands and play the announcement.
EWZ: With underlyings under $50, I've been short straddling or iron flying. The July 20th 34 short straddle pays 3.09, with break evens at 30.91 and 37.09. Naturally, that isn't for everyone, since short straddles and iron flies generally skew out delta-wise fairly immediately, so they're not "nervous nellie" trades or trades for the "delta anal"; for those kids, the July 20th 31/37 short strangle camped out around the 20 delta strikes might make more sense; it's paying .98.
COMPARISON/CONTRAST OF FOUR BULLISH TRADES IN ORCLORACLE
The Plain Jane "Spack" (Short Put/Acquire/Cover) Trade
Sell the June 15th 44 put
Metrics:
Probability of Profit: 75%
Max Profit: $69/contract
Max Loss: Undefined
Break Even: $43.31
Delta: 26.48
Theta: 1.17
The Plain Jane Covered Call
Buy Shares at 46.23/Sell the June 15th 48 call
Metrics:
Probability of Profit: 48%
Max Profit: $174
Max Loss: $4626
Break Even: $46.26
Delta: 66.29
Theta: 1.21
The 90/30 Poor Man's*
Buy the Sept 21st 37 long/Sell the June 15th 48 call
Metrics:
Probability of Profit: ~50%
Max Profit: $177
Max Loss: $823
Break Even: $46.23
Delta: 52.50
Theta: .55
* -- The back month bid/ask is wide in the off hours, but I wouldn't want this filled for anything more than a break even at where spot is currently trading.
The At The Money Net Credit Put Diagonal
Buy the Sept 21st 42 long/sell the June 15th 45 short put
Metrics:
Probability of Profit: ~50%
Max Profit: Undefined
Max Loss: $383
Break Even: $45.83
Delta: 21.29
Theta: .54
Comments: One of my frequent primary considerations is how much I want to hang up on the trade in buying power and -- to a certain extent -- that is depending on what kind of environment I'm working in (cash secured versus margin). As you can see, the Plain Jane covered call is quite pricey to put on, and I would probably never choose that option out of the gate because I don't like to buy stock at market: I'd rather sell short puts and get assigned shares that are lower in price and then proceed to cover instead.
Even the "Spack" trade may be pricey for some, depending on the environment in which you're trading; if cash secured, you're going to pay $4331 to put that trade on, although you could buy a cheap, throwaway long put to reduce that buying power effect substantially without giving up much (e.g., the 35 long, which costs .07 to put on at the mid, results in a "definition" of the risk to the width of the spread (9-wide) minus the credit received (.63) or $837 instead of the over $4k you'd be paying to "go naked"). On margin, doing that doesn't get you much in terms of freed up buying power, since you're likely to pay $860 on margin to put the naked on.
Out of all the plays, the net credit diagonal is cheapest to put on, but max profit is unknown since it will depend on how much you get for rolling the short put.
From a max profit standpoint, the Plain Jane covered call and Poor Man's are comparable in pure dollar and cents terms, but return on cap is much higher for the Poor Man's (21.5%) versus the Plain Jane covered call (3.8% cash secured; twice that if on margin). From that standpoint, the naked "Spack" trade is probably the worst if you go undefined in cash secured: a 1.5% return on cap risked, although if it's better if you play it on margin (8.0%) or go with the uber wide spread with the throwaway long, which -- weirdly enough -- almost no one ever does in spite of the fact that it (a) defines the risk; and (b) dramatically improves return on cap ... .
Takeaways: (a) Never covered call out of the gate; short put/acquire/cover instead; (b) there is little to no advantage of going naked over "wide defined" in a cash secured account; buy a cheap throwaway, define your risk, and conserve your buying power over tying up the large notional associated with a full-on naked; (c) Poor Man's have better return on cap metrics than virtually every other play; (d) for uber cheap buying power tie-up in small accounts, go with flexible, at the money net credit diagonal and opt for cost basis reduction with rolls of the short aspect over time.

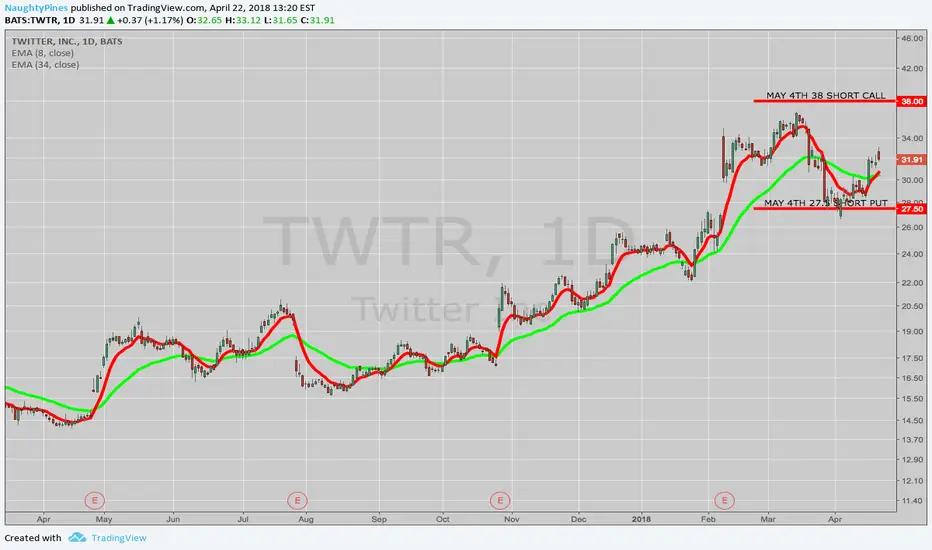
THE WEEK AHEAD: TWTR, X, IYR, XLU, ORCL, IBMAlthough there are quite a few earnings coming up next week, only two catch my eye from a premium selling standpoint: Twitter and U.S. Steel.
Twitter announces on Wednesday before market open; has a 30-day implied volatility of 75.19%; and the May 4th 20-delta, 74% probability of profit 27.5/38 short strangle is paying 1.28 at the mid with its defined risk counterpart, the 24/27.5/38/41 iron condor paying .87.
US Steel (which can be a mover; 30-day implied 59.6%) announces on Wednesday after market close; and the May 4th 20-delta, 72% probability of profit 33/41 is paying 1.07 with its defined risk counterpart, the 30/33/41/44, paying .69.
On the exchange-traded fund front, nothing looks particularly enticing at the moment. OIH and XOP round out the top of the pile volatility-wise, but their 30-days are sub-35, with other funds trailing off from there, so I'm looking at potentially putting on a couple of directional plays in single names where earnings are in the rear view mirror -- ORCL and IBM and/or in exchange-traded funds where concerns over rising interest rates and/or comparative yield have beaten them down, temporarily or otherwise -- IYR and XLU.
I'll set out those ideas in a separate post, since there are multiple ways in which you can go directional with an options setup in those without hanging up a lot of buying power in actual shares. Additionally, sometimes it can be worth comparing and contrasting various "options options" so that you can decide which strategy suits your preference as to how much you want to devote to the trade ... .
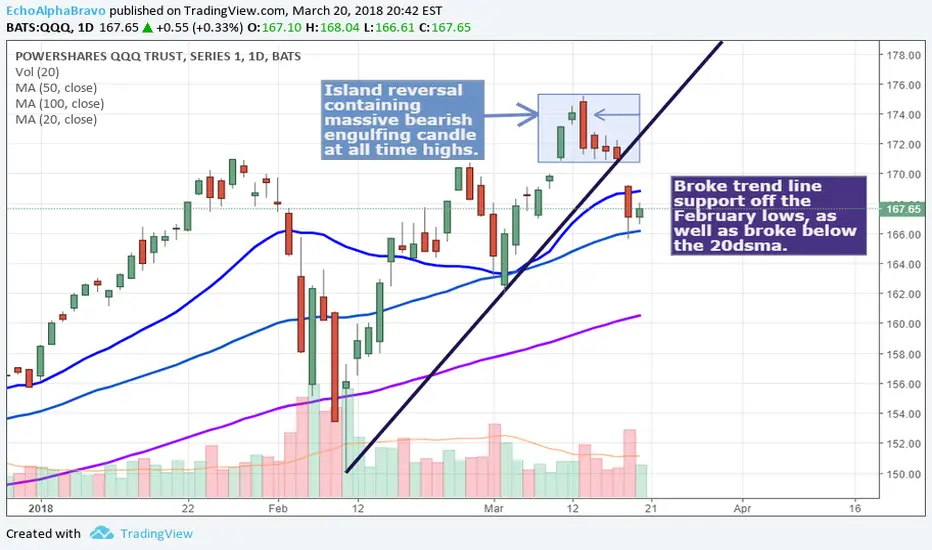
QQQ in troubleAfter forming an island reversal last week, complete with a massive bearish engulfing candle off of all time highs, the break below the trend line support and 20dsma seemed fitting. Today's action was bearish, as volumes were subdued relative to recent down days. This suggest that few participants are eager to defend prices in a significant way and bid the market higher, so it seems bears have taken control of this market. I'm a seller, especially specific names heavily weighted in the index. I closed TWTR short today after huge success, added to NFLX short, initiated ADBE and FDX short, stood still on my TSLA short, and opened a deep OTM FB long put after noticing unusually high volume at the April 115/120 strikes (several spreads, buying the 120's and selling 115's and massive volume relative to open interest). I also took a flyer on ORCL, buying April calls for a bounce, as this selloff seems overdone.
Bottom line... Watch out below!
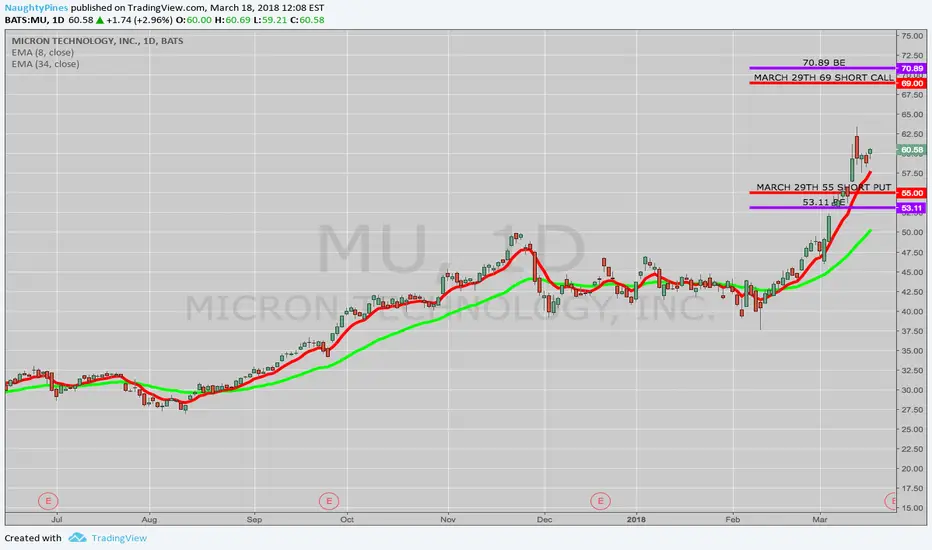
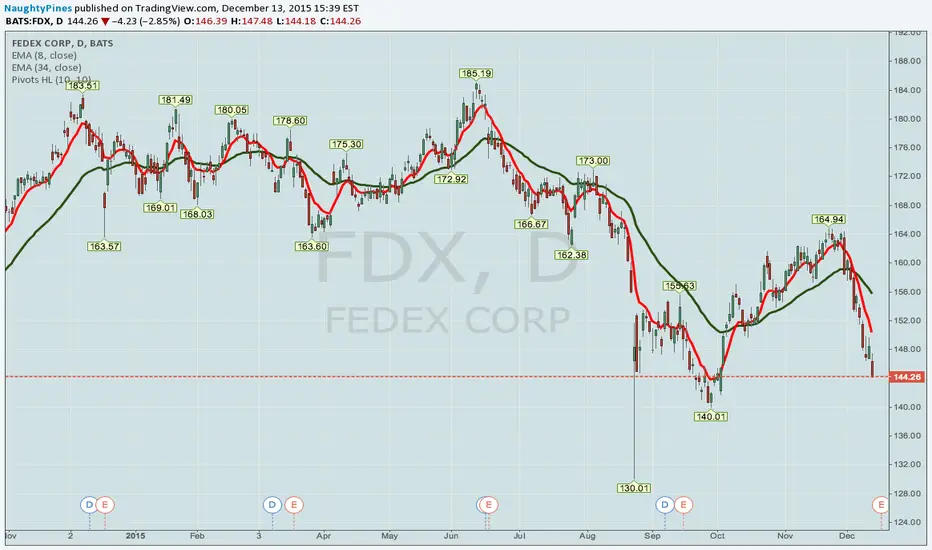
THE WEEK AHEAD: MU, OIH, EWZ, XOP, GDXJThe only earnings play coming up next week that currently interests me from a premium selling/volatility contraction standpoint is MU -- with a background implied volatility in the 60's -- which announces earnings on Thursday after market close. Neither ORCL nor FDX -- which announce Monday and Tuesday respectively -- have sub-30 implied volatility, although they're probably worth watching to see if their implied's bump up closer to the announcement or, depending on price movement post announcement, whether there is an opportunity to take advantage of earnings announcement "afterglow."
Preliminarily, the MU March 29th 20 delta 55/69 is paying 1.89/contract (off hours) with break evens at 53.11/70.89. The defined risk iron condor would require slightly more aggressive strikes to get one-third the width out of the longs -- the 53.5/56.5/67.5/69.5 (30 delta) in the March 29th pays 1.03 with break evens at 55.47 and 68.53.
For short put/acquire/cover cycle traders who are looking to potentially get into MU lower than current market prices, the April 20th 25 delta 55 short put is paying 1.88 at the mid, yielding a break even of 53.14, a 12.28% discount over where the underlying is currently trading. Alternatively, you can look at going out to May here where the 55 is at the 30 delta, bring in 2.87 at the door and get a break even of 52.13 (a nearly 14% discount).
As far as non-earnings is concerned, we're kind of in "the dead zone" between the April and May monthlies; for me, the April month is too short in duration (33 days to go) and the May, a bit too long (61 days).
Nevertheless, here are the top four exchange-traded funds ranked by implied volatility -- OIH (29), EWZ (29), XOP (29), GDXJ (28) -- and by implied volatility rank/percentile: XHB, FXI, XLF, and XLB, all of which are at the upper end of their 52-week ranges. Unfortunately, that isn't saying much, since background implied in all of these is sub-25, with the preferred metric for background implied being >35%.
It may be time to scrounge around for something directional to keep me engaged in "the dead zone" -- for example, this GE play (See Post below) ... .
Oracle - Stocks to watch this monthORCL down 10% after earning season with 1.64% beat estimation. We have one more down after dividends share in october.
From fundamental anaysis this sharp down only correction, coz oracle have many good financial data.
from financial strength, this stocks have 6/10 score, with :
Cash-to-Debt 1.26
Equity-to-Asset 0.42
Debt-to-Equity 0.95
Interest Coverage 6.81
and have 7/10 profitability/growth, with :
Operating Margin %33.64
Net Margin %25.35
ROE %18.95
ROA %7.58
PE ratio : 21.04
If we look at technical analysis,
before earning this stocks hit resistance channel up, and down 10%, but still inside channel.
we have support around 0.382 fibonacci, but we still have 1 more down price after dividents this october.
Maybe we still have false break after dividents and continue to bullish to reach new ATH with target at 54.77 and maximum at ABCD fibonacci retracement projection at 56.92


ORCL on the move...Yesterday, ORCL gapped up. It opened at almost $52 but closed closer to $50.
This morning, ORCL dropped below yesterday's low but quickly got back up above that low.
If ORCL can stay above 50 it should see higher prices. Any long play should have a stop at $50.

A Big Boy Oracle For The Bucket? Well, it looks real... Oracle is already traded the highs, technical the stock is distributing. So It is question of whether we upthrust or we go straight through the Ice. Not one I want to bet on...

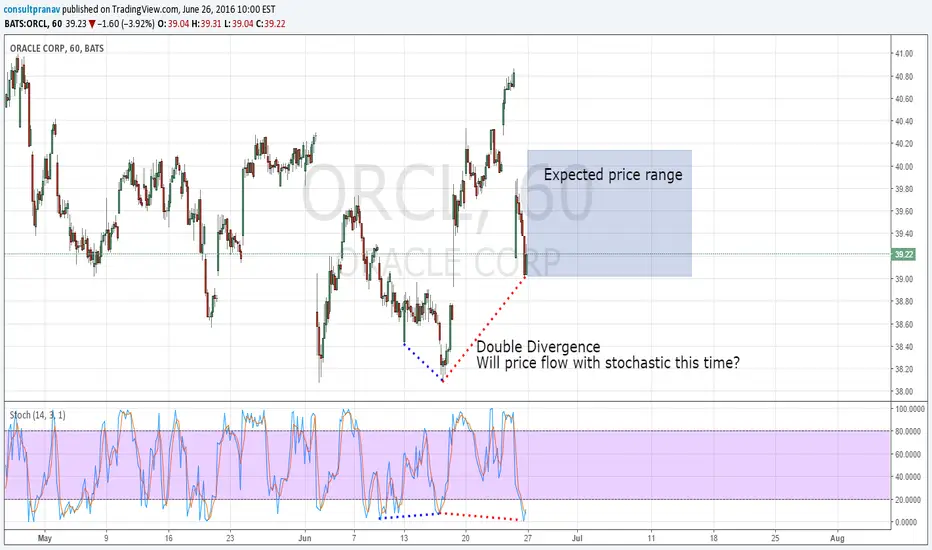
Bullish OracleStochastic created two divergences simultaneously.
There is a ~75% chance of price following the stochastic this time.
If it does, expect the price to trade in the box given.
So be bullish on Oracle.
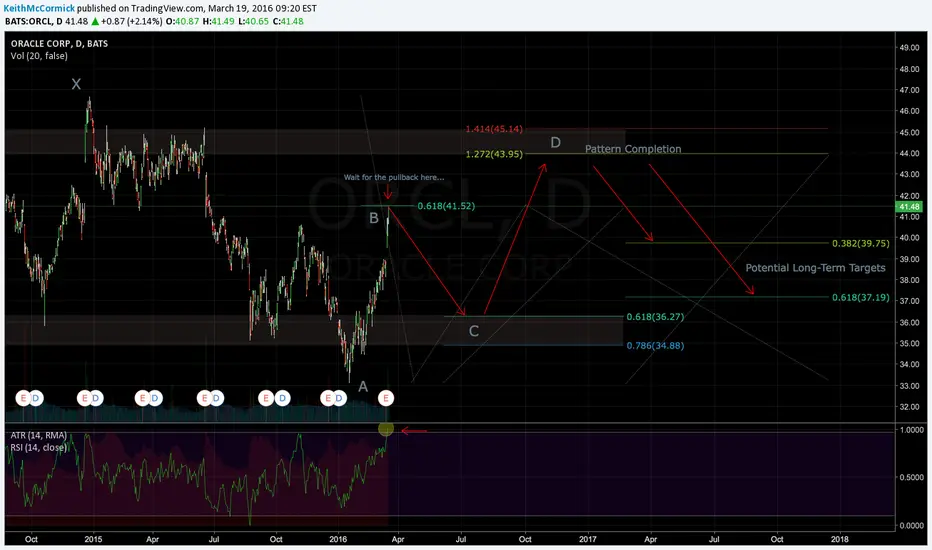
Potential Long-Term Gartley (WIP)This is more of a "Concept". I am a complete newbie, just looking to validate the concepts of these patterns. Please feel free to comment and critique. I would appreciate the feedback.
THE WEEK AHEAD -- FOMC, FOMC, FOMC; LONG VIX; OIL; EARNINGSHere's what I'm looking at for next week:
VIX/VIX PRODUCTS . VIX finished last week at 16.50. I will look at VIX/VIX product setups early next week depending how the "horse does at the gate" (Monday). If we see a tight range in the S&P like we did pre-Draghi in prepation for FOMC, VIX could drift go a little lower Monday through Wednesday, in which case I will want to use VIX, VIX, or UVXY to go "long volatility."
Index ETF's . There is little sense in selling April expiry premium here in broader index instruments with VIX the way it is. Brazil, oil/gas, and the gold space continue to have the volatility, but I'm already in all of the underlyings that have any juice in their options that are at 70+ implied volatility rank (UNG (covered call), EWZ (iron fly), GDXJ (short strangle), RIG (short strangle), GLD (credit spread), and XOP (short strangle) in those sectors.
If you look at SPY implied volatility month-to-month, it doesn't approach something "regular" until the June expiry (19.9%), so I may look to set up some small premium selling play in the June expiry on the possibility that low volatility sticks around for a period of time and to have something in the queue for that event. Trying to sell 45 DTE premium in the index ETF's in a period like we had last year between mid-March and late August was a total slog ... .
Oil . The 2016 high was set on 1/4 at 35.36 in USOIL. it tested the underside of that level Tuesday, Wednesday, and Thursday of last week and broke through it by a whopping .20 cents on Friday, so who knows whether that'll hold. If oil caves, the S&P will follow hard (the S&P currently has a .93 correlation with USOIL). However, oil has a tendency to enter fairly lengthy consolidative periods before moving directionally forward, so be prepared for oil to taunt you with both suggestions that it's going to break significantly higher and indications that it's going to totally implode ... .
If you're into trading spot forex, watch oil's effect on the petro currency USDCAD. The Loonie may get a double whammy from a cave in oil plus Fed tightening/dovish-hawkishness. The Loonie's entire strength profile from 2/11 is largely on the back of oil.
EURUSD. This is the strong/weak pair to watch post-Draghi and running up into FOMC. For me, this is not a pair I would mess around with "playing in the middle" between 1.08 and 1.10. As I did last year, I would wait for it to hit 1.14 and then go short if it's inclined to react to the upside on whatever FOMC says; otherwise, stay out. The fundamentals on this pair should be telling everyone to only short on strength (ECB easing; Fed tightening), as attempting to play the 200 pips between 1.08 and 1.10 has been and is likely to continue to be somewhat discouraging as it looks to find its footing in the larger range between 1.14 and near parity.
EARNINGS. Although the earnings season has been described as "over" for this quarter, there are a few issues that are still due to report that might be worth playing, assuming that the volatility is there: ORCL (Tuesday, after close), FDX (Wednesday after close), and ADBE (Thursday, after market close). As it stands right now, none of those meet my implied volatility rank rules (70th percentile plus), with all three of those having percentiles hovering around 50, but naturally that might change running up into the actual announcement.

THE WEEK AHEAD -- "LESS THAN SEXY" FOR PREMIUM SELLINGWith the VIX finishing the week out at 16.66, next week is setting itself up to be a less than sexy week for premium selling, particularly in broader market instruments like SPY, IWM, QQQ, and DIA.
Moving to other sectors, the Brazil ETF, EWZ continues to be hot premium selling wise, with an implied volatility rank of 72. A couple of issues in the oil and gas space follow closely behind in the 70+ club (UNG (implied vol rank 72); RIG (71)); with several gold plays remaining in the 60s (GDXJ, GDX, GG).
From there, volatility in individual underlyings and/or ETF's slips off somewhat dramatically, with only a few in the 50-60 range (X at 57; ORCL, 57 (one of this season's last earnings plays); CAT, 55 (earnings afterglo vol); and GLD, 52; with the remainder of most highly liquid, options playable issues slipping below 50 thereafter.
Given the fact that I'm in a gold play, in EWZ, and have exposure to oil, I don't see myself putting on a heckuvalot of new trades next week. That's not all bad; these little volatility lulls make for a good time to do housekeeping on the various messes I created during the last volatility wave, clean up the earnings plays that didn't work out this past season, and/or dry out powder for the next volatility spike or whatever comes next ... .
Naturally, should VIX spike to plus 25, I'll be right back in it with some new plays to take advantage of that. In the meantime, a cleaning of my trading "garage"/"basement"/"backyard" is overdue.
It ain't sexy, but it's gotta be done some time.

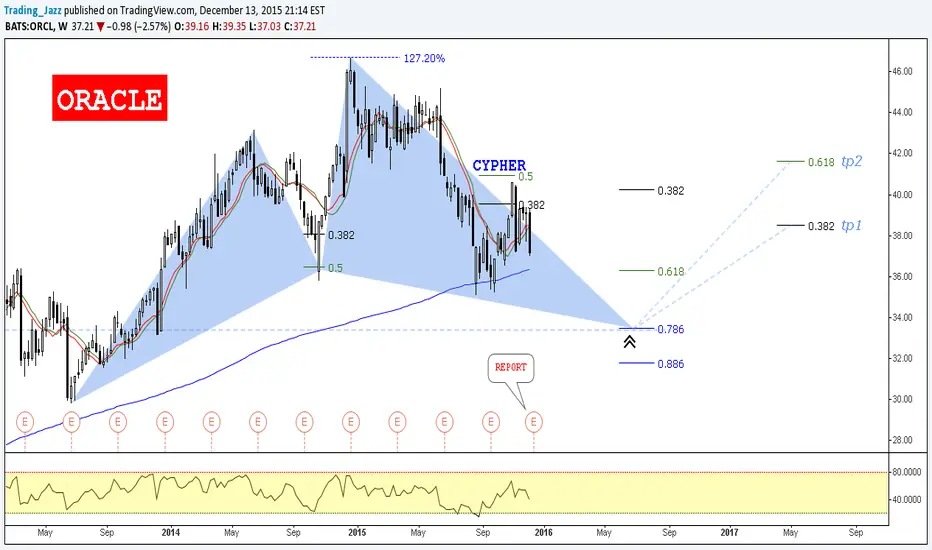
Oracle // Bullish Cypher @33.46$ / IF=THEN ®NYSE:ORCL
"Cloud competitors have their eyes on Oracle as the company continues to rapidly build out its SaaS and PaaS product offerings. To put this in perspective, Oracle’s human capital management (HCM) SaaS product secured three times as many new customers as competitor Workday’s similar HCM product. This focus on the cloud has led Oracle to expect approximately $1.5-$2 billion in new SaaS and PaaS purchases this year alone. Oracle’s SaaS and PaaS revenues experienced a 54% increase last quarter as a result of the shift of 95% of its services to the cloud. While the cloud has been gaining traction, it hasn’t been enough to offset weakness in Oracle’s bread and butter software licensing division, which dropped 16% last quarter. For that reason, Oracle has not been able to beat analyst estimates on the bottom-line for the past eight quarters, missing in five of those quarters and meeting in the other three. Revenues have been even worse, missing expectations in six of the past eight quarters. Year-to-date the stock has dropped nearly 15%."
Report Wednesday, December 16;
Information Technology - Software | Reports December 16, after the close.
The "community" consensus calls for EPS of $0.61, in-line with Wall Street. Revenue estimates are also quite close, with the "community" calling for $9.113B and the Street slightly lower at $9.094B.
Safe trades;
EARNINGS PLAYS THIS COMING WEEK -- FDX, ORCLOnly two earnings plays stick out to me this coming week -- FDX and ORCL, both of which announce earnings on 12/16 (Wednesday) after market close, so look to put on setups before NY close on Wednesday.
Currently, FDX's 52 week IVR is at 54 (IV 34), which isn't stellar, but it's at 92 for the past six months. Moreover, there is pretty good credit to be had whether you go short strangle or iron condor, so I imagine I'll play that one way or another if the IV sticks in there.
ORCL (IVR 75/IV 35) isn't looking all that hot, frankly, because I can't get 1.00 in credit with either a short strangle or iron condor (a Dec 24 34.5/39.5 short strangle will only get you a .61 credit at the mid price right now, which isn't anything to go crazy over; a same expiry iron condor just isn't worth it). Nevertheless, we could see a greater volatility pop toward earnings that makes it a little bit more worthwhile such that I'll play just because there isn't that much else worthwhile to do ... .
(Of course, there is that all FOMC thing next week, too).
Bullish On ORCL1. Bullish Engulfing+Bullish Divergence
2. Bounce on Fibs 61.8
3. Primary Trend Sideways
4. Intermediate : Bullish, Minor Bearish

ORCL: Failed Bear Flag to the Upside ORCL is in a bear flag. but with that being said the chart is in an overall uptrend. Enter as the trade breaks out of the trendline then add once more conformation is gained when each decending high pivot is broken shown by the brown lines. These failed bear flags when triggered to the upside tend to retrace the down move about 80% giving us our target of around 42.35
