How to Trade Smart Money Concepts (SMC)\ How to Trade Smart Money Concepts (SMC)\
\ This article explores the foundation, key tools, and practical insights of Smart Money Concepts — and why it’s worth your attention.\
In today's fast-changing financial landscape, Smart Money Concepts (SMC) has become a popular strategy among modern traders. But what is SMC exactly, and how can it improve your trading decisions? This article breaks it down in a simple, professional way for traders at all levels.
---
\ What Are Smart Money Concepts?\
SMC is a trading approach based on the belief that large institutions ("smart money") like banks and hedge funds control most of the market's movements. These institutions often move the market in ways that confuse or trap retail traders. The goal of SMC is to understand and follow the footsteps of these big players.
Instead of relying on simple patterns or indicators, SMC focuses on:
\ - Market structure\
\ - Supply and demand zones\
\ - Liquidity pools\
By aligning your trades with the behavior of smart money, you can position yourself more strategically in the market.
---
\ Key SMC Concepts Explained\
\ Order Blocks\
Order blocks are zones on the chart where large institutions have placed significant buy or sell orders. These zones often lead to strong price reactions and act as hidden support or resistance levels. Order blocks are considered more precise than traditional supply and demand areas.
Example: ()
\ Fair Value Gap (FVG)\
A Fair Value Gap occurs when price moves sharply in one direction, leaving a gap or imbalance in the price action. These areas often get filled later and can act as magnets for price.
In a bearish move, the FVG is the gap between the low of the previous candle and the high of the next one. In a bullish move, it's the reverse.
Example: ()
\ Timeframe Consideration\
If you can’t monitor charts during the day, avoid relying on 5–30 minute setups. Consider 4H or daily timeframes for clearer signals and more manageable trading decisions.
\ Liquidity\
Liquidity refers to price zones where lots of pending orders exist. These are usually at obvious highs, lows, or trendlines. Smart money often targets these areas to trigger stop-losses and generate movement.
One common tool to identify liquidity is a "pivot point," which is a candle with a lower low or higher high than its neighbors.
Example: ()
\ Break of Structure (BOS)\
BOS occurs when price breaks above or below a previous high or low, signaling a possible trend continuation.
Example: ()
\ Change of Character (ChoCH)\
ChoCH happens when the market changes direction. For example, if price breaks a higher low in an uptrend, it may signal a reversal.
Example: ()
Combined with BOS: ()
---
\ How SMC Compares to Wyckoff\
The idea of "smart money" isn't new. Richard D. Wyckoff, a pioneer in technical analysis, laid the foundation for understanding market cycles driven by institutions. His price cycle theory includes four phases:
\ 1. Accumulation\
Smart money buys while the public is unaware.
\ 2. Markup\
Price rises as smart money pushes the market.
\ 3. Distribution\
Smart money sells into public buying.
\ 4. Markdown\
Price falls as the cycle completes.
SMC borrows from this logic but focuses more on structure and liquidity zones. Still, the core idea is the same: understand what big players are doing, and follow them.
\ For deeper insights into Wyckoff, explore additional resources focused on accumulation/distribution cycles.\
---
\ Summary\
Smart Money Concepts give traders a deeper look into market mechanics. By focusing on order blocks, fair value gaps, liquidity, and structure breaks, SMC helps identify high-probability trade setups based on institutional behavior.
It may seem complex at first, but once you understand the basics, SMC can become a powerful tool in your trading strategy. Whether you’re new or experienced, aligning with smart money can improve your edge in the market.
Order-blocks


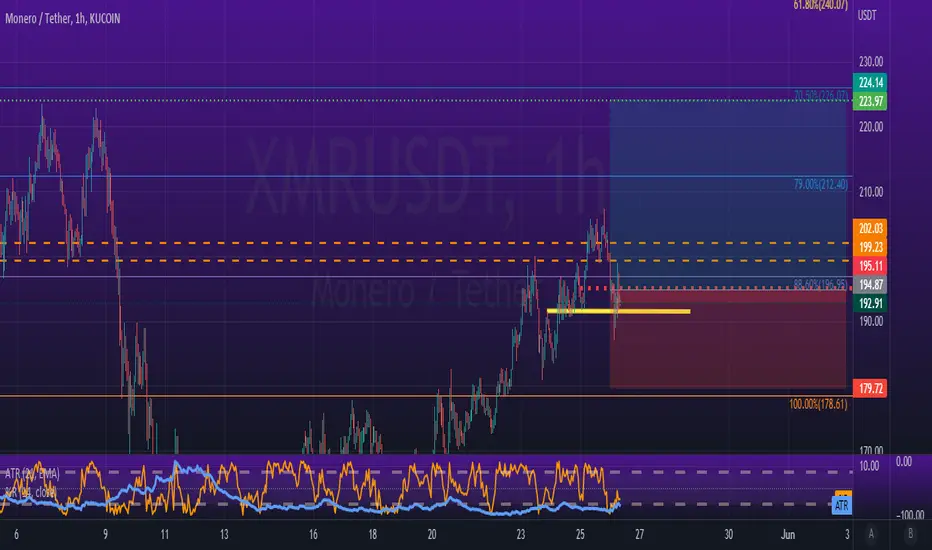
#XMR - Remins Bullish Aiming for Equal HighsI entered around 190, BY THE timr I posted this it was already 194. In tough timers, look to monero to get you out from under. I've been scalping BTC and ETH. bUT Longing Monero aklways at thje right time. Started with a $100 account for fun in futures, nit at $449 in 2 wees.
Now, a larger time frame it did get rejected zt bearish order block (Chart in messae) fahard but rebounded even harder. There's Natural iquidity sitting above the doyble eual highs. That.s where U believe you can take A BULK of you positino off and continue to see where the trade is headed.
HTF CHART
I don't think ETH amd BTC have hit their lows yet, But Monero will be the one to watch as it continues to climb.
The correction is over, the bullish wave of cryptocurrency beginGALA LONG
I expect to a large extent that the price is at the bottom now and the correction waves are complete. It is the time to rise

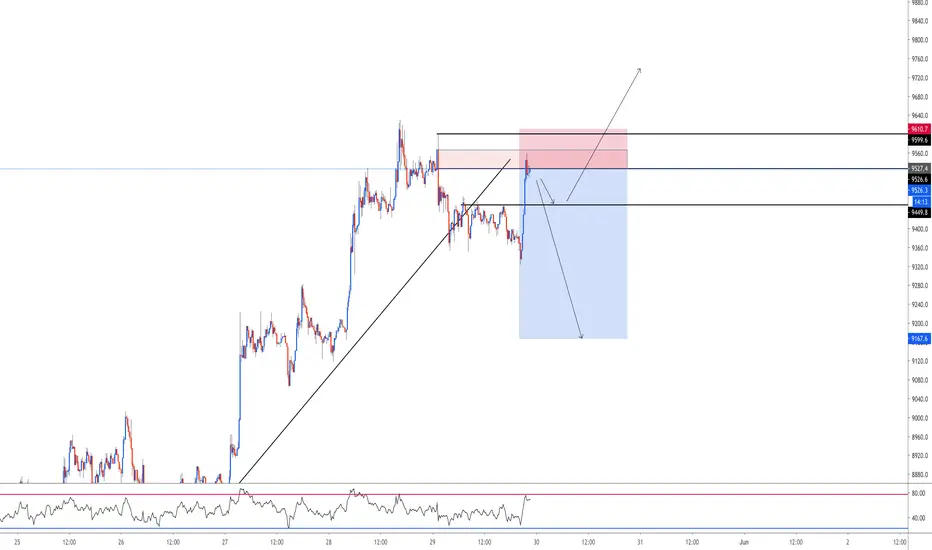
$MTS - To Fill 4 Hr Fair Value Gap on Order Block For Up Bounce*SMT = Smart Money Theory = everything you think that is not retail related to trading. First, SMT does not believe that triangles, wedges , trendlines , channels, harmonics, etc. has any effect on how price reacts. The second is to recognize that the price is not random, it is set by an algorithm controlled by those that control the asset. The Third thing to remember is price will move toward Liquidity and Balance. That's the basics. The rest is very unique in the vocabulary you need to have and the concepts that wrap around these ideas.
It's slowly working it's way down into the smart money "Buy Zone" or discounted area. With Kucoins 60% staking of the coin, I'm surprised it's going this low. But I have three short targets along the way up.

Order Blocks live Discuss with Bangla Order blocks really amazing for day trading - we are sharing order blocks system setup ..

XAUUSD(GOLD) NOVEMBER 2020Hello traders,
My analysis on XAUUSD THIS MONTH, I assume it will go up there to 1960.00, to the end of the month up to 2050.00. We're waiting on happy december so the gold can even break highest tops. -StdFX

BTCUSD 15 MIN - May 29, 2020Two scenarios for BTCUSD
- Price broke trend and is now retesting a bearish order block
1) Price will reject the outlined zone and create a new support to continue a new uptrend
2) Price will continue to push down.
EURUSD Buy Limit OB - May 4, 2020Order block on EURUSD for Buy
Retest of previous resistance
USD fundamentals appear bearish which may drive this pair to the upside.

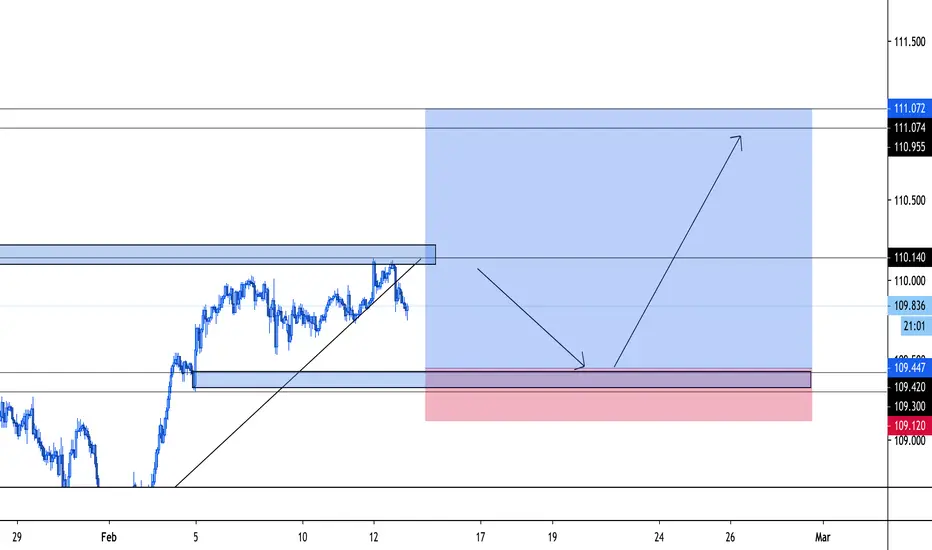
USDJPY 1 hour block - February 12, 20201 hour buy block
- Looking to take this past previous high and to close gap above.
S&P 500 3 hour short - February 12, 20203 hour timeframe
Bearish engulfing candle breaking resistance
Waiting for test on block to enter

CHFJPY 2 hour long entry - February 12, 2020Price on trend / Price on 2 hour block / Bullish momentum / Keeping Stop Loss below the block and trend

GBPCAD 4 hour block Long and Short entry - February 12, 2020Short term buy and then short, Right shoulder on H&S formation.

CADJPY 4 hour Sell Block - January 5, 2019CADJPY 4 hour
- CAD forecast is bullish so this setup may not hold.
- Looking for a shorting opportunity mid week.

GBPNZD Trade Idea / Speculation - 12 hour Long BlockGBPNZD
- 12 hour time frame
- Long block on the 12 hour and Daily.
- Momentum on the downtrend has slowed and is now creating support off the block and trend line.
- I do not follow news religiously but BREXIT appears to be happening which would strengthen the pound and NZD may be looking for a retrace as highs are being hit on many NZD pairs.
- I highlighted two bullish engulfing candles, focus on the current one on trend, and on block. I want to see price come a little lower. I have not entered this trade so no long position icon is shown.

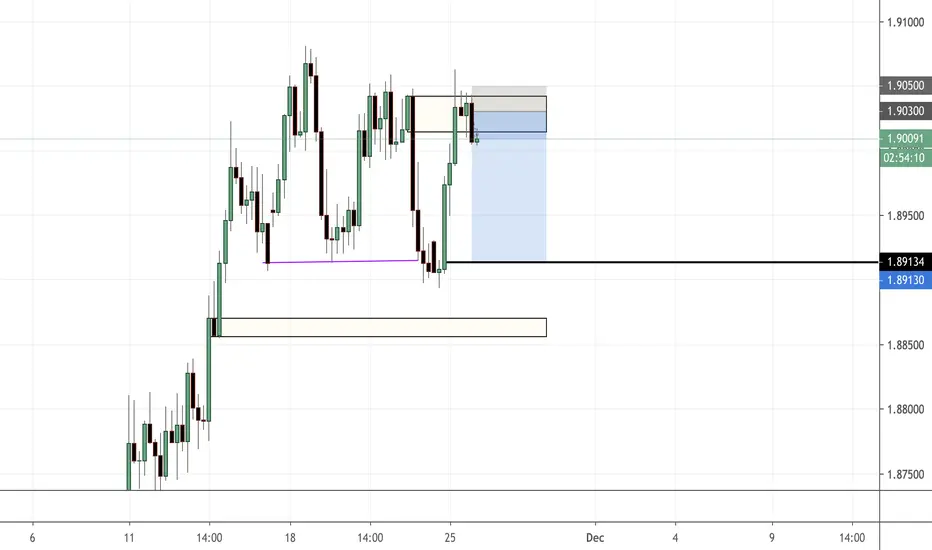
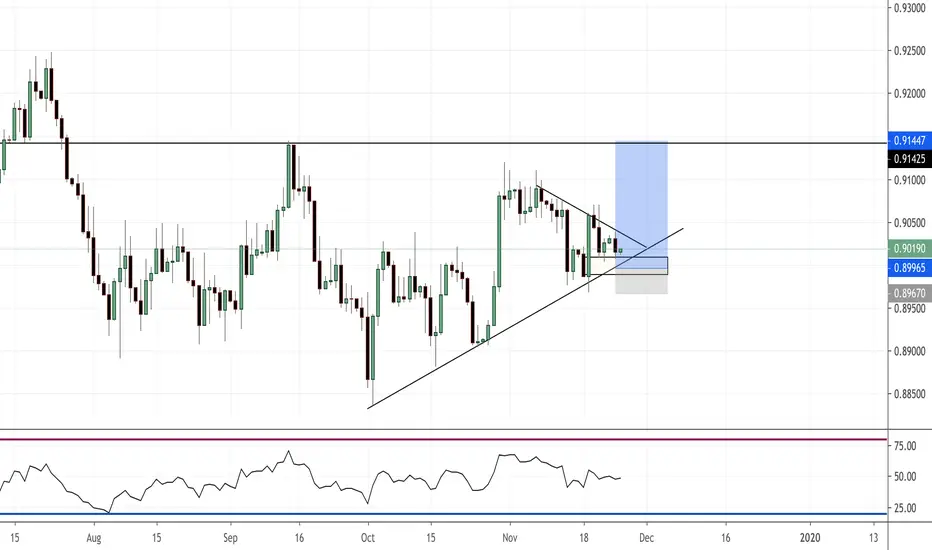
GBPAUD 4 hour Sell Block - November 25, 2019Taking this down to the 1.89200 level, we could see this push down further to 1.88500.
GBPJPY 1 hour Short and Long Blocks - November 25, 2019GBPJPY 1 hour
- Divergence is spotted on the 1 hour
- 1 hour sell block created after breaking equal highs
- Looking to short to gap and then upon finding support a possibly long position to break equal highs.

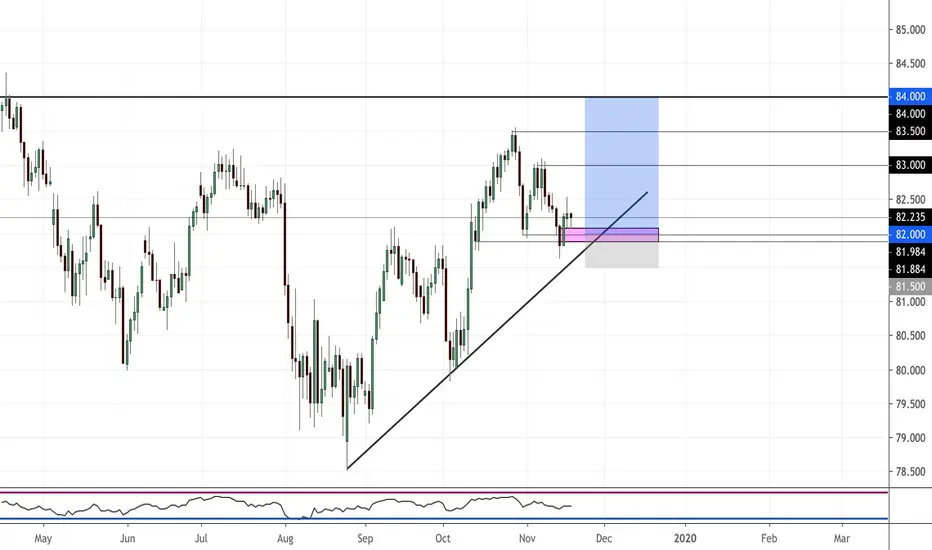
AUDCAD Daily Bullish - November 25, 2019- Daily bullish block, SL is about 30 pips, TP at previous highs.
AUDCHF - 4 hour sell limit analysis - November 19, 2019AUDCHF sell limit @ .67550
- 4 hour block, equal lows broken to create structure
- Price nearing equal highs to break.
- 38.2 fib level rejection indication of strong trend.
- liquidity below for price to catch

CADJPY Daily Bullish Block - November 18, 2019CADJPY - Bullish Daily Block
- Entry resting on previous bullish pullback and previous resistance. Block formed that broke lows.
- Can enter manually, TPs are even critical numbers making this highly favorable.
GBPUSD Bullish Daily Block - November 18, 2019This will take some time to play out. Looking for GBPUSD to fill out several gaps and make way to previous major resistance at around 1.26000, this also intersects to major fib areas. SL placed before previous low on resistance.

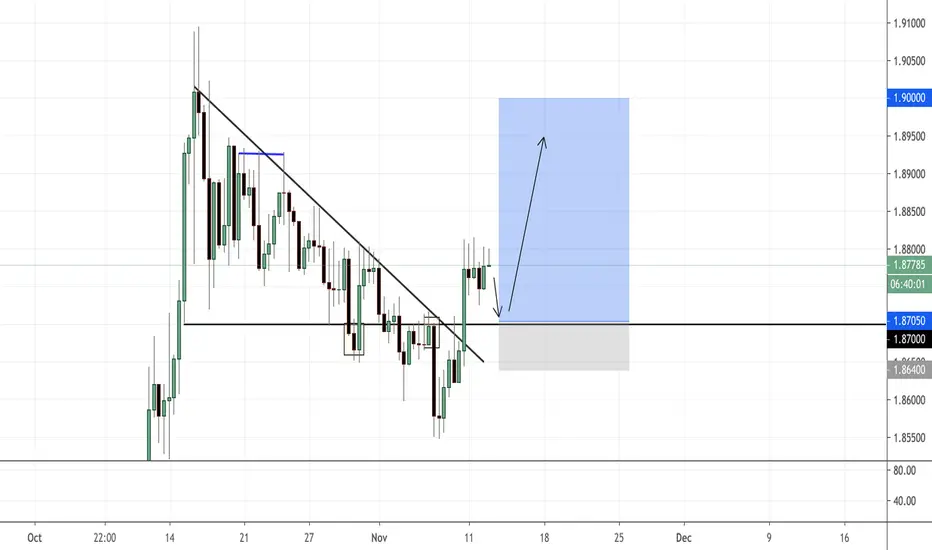
GBPAUD 8 hour Bullish Block - November 12, 2019Price has broken out of trend
Looking for a retest. Critical level .87000 shows as a favorable entry
Two blocks are lined up where this retest could occur.
Equal highs pointed above
Price may come down lower and form a double bottom
- On the daily a k-tail is shown at around .87000 from several days ago.
EURAUD - Block September 16, 2019Price is stalling on the 4 hour, price broke trend. Based on COT data, AUD should be going up, however, there may be some AUD retest this week bringing this trade to fruition.
