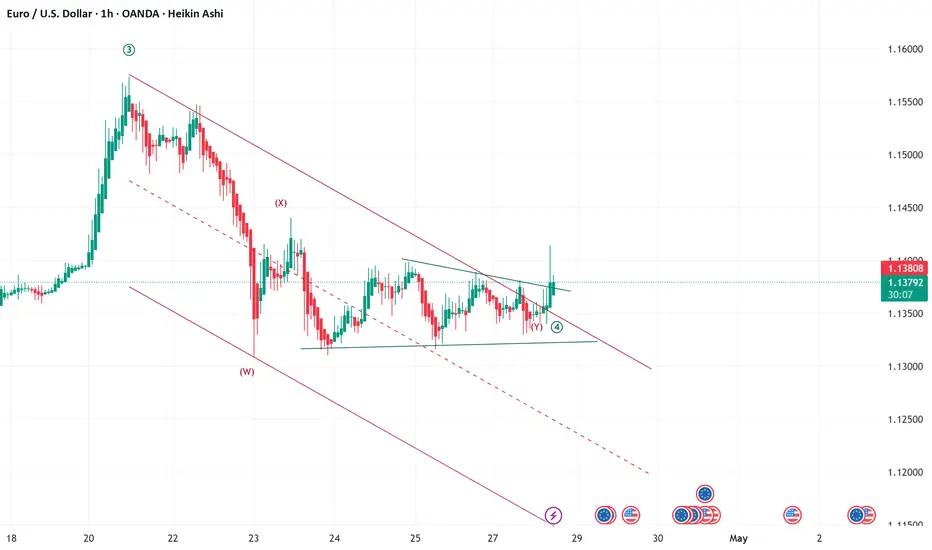
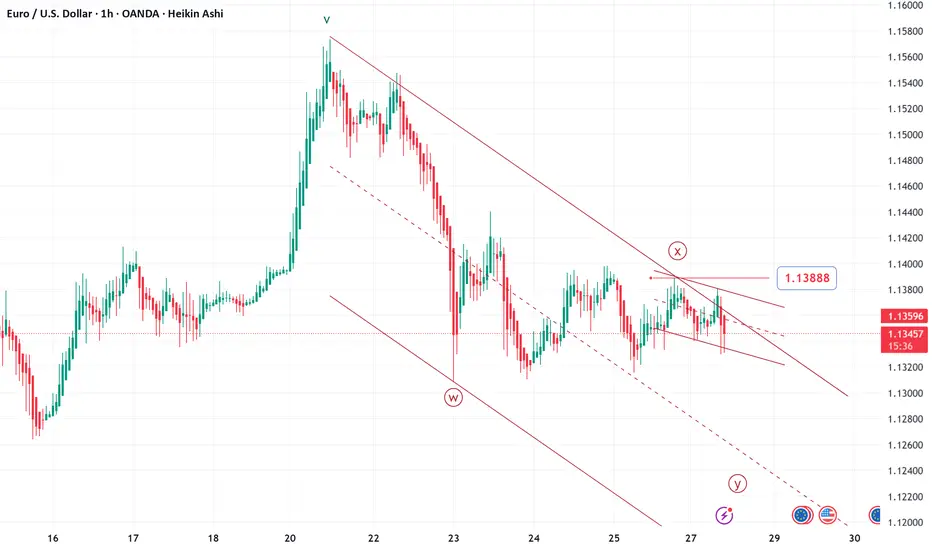
EWTSU eurousd H1 subminuette wave (y) update
EWTSU eurousd H1 update
The three-wave corrective move (w)(x)(y) appears to be over
micro wave ((5)) should follow in 5 waves
invalidation : area 1.1330
Oscillators
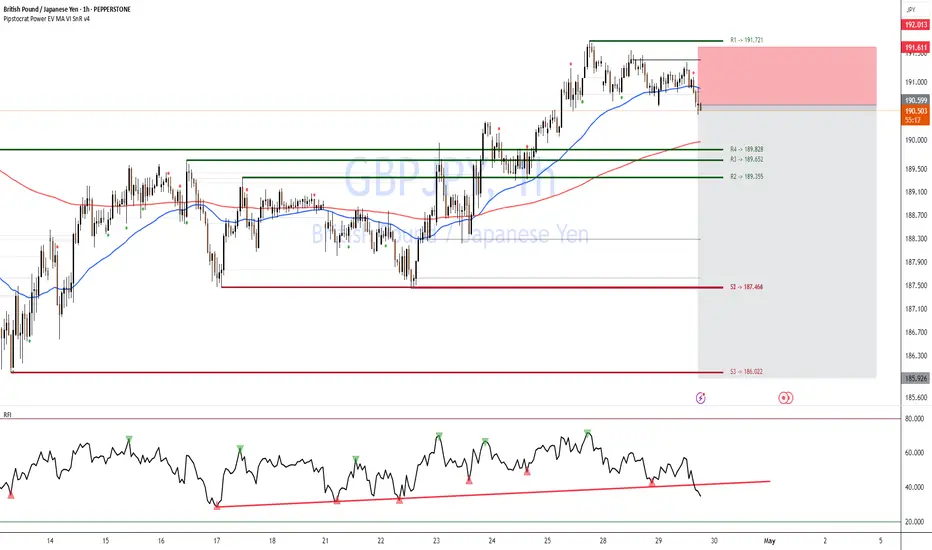
GBPJPY bearish move🔹 Pair / TF | GBP/JPY, 1 h → 15 m |
| 🔹 Bias | Bearish (selling the break of support) |
1. 📊 Key Levels
Level Price Role
R1 191.721 Major resistance (green)
Broken Support 190.65 (black line) Minor support → now resistance
R4 189.828 Next minor support
R2 189.355 Next major support
2. 🚨 Trigger
Price closes below the 190.65 support (black line) on 1 h, AND
200-hour MA (red) has just been rejected—sellers stepping in.
This decisive break flips 190.65 into new resistance.
3. ✅ Confirmation
RFI oscillator on 15 m dips below its rising trendline and fails to reclaim it.
Momentum is clearly bearish—no divergence or oversold reversal signal.
4. 🎯 Entry & Stops
| 🔶 Entry Zone | 0.19060–0.19050 (just below 190.65) | | 🔴 Stop-Loss | 0.19180 (above R1 at 191.72) ≈ 120 pips |
Place a Sell-Stop at 0.19055 (mid-zone).
Risk: 1–2% of account on ~120-pip SL.
5. 🎯 Profit Targets
Target Level Pips RRR
T1 R4 189.828 ~82 pips 1 : 0.7
T2 R2 189.355 ~125 pips 1 : 1
Scale out:
Exit ½ at T1.
Let the rest run to T2.
6. ⚙️ Trade Management
Move SL to breakeven once +40 pips in profit.
Monitor RFI on 15 m:
If RFI spikes above its trendline before T1, close remaining.
Adjust if you see large wicks or volume spikes into support zones.
7. 🔑 Rationale
Support→Resistance flip at 190.65 gives a logical entry & SL.
200-hour MA rejection confirms sellers overpowering buyers.
RFI confirms sustained bearish momentum.
High RRR (>1 : 1) ensures edge even with a moderate win-rate.
⚡ Highlight:
This is a bank-order-flow style fade—selling the break of minor support after a MA confluence test, riding momentum into larger support zones.
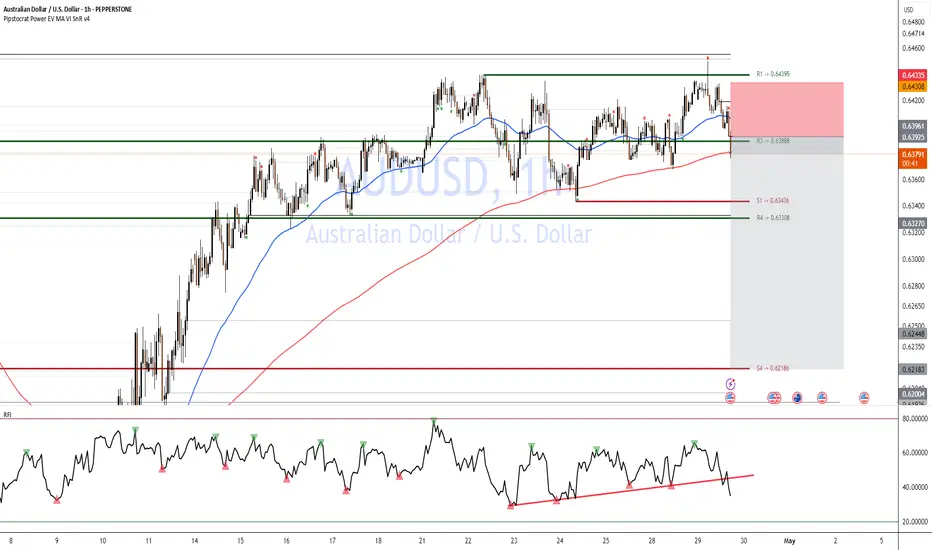
AUSSIE bearish move Short-setup: Breakdown of Support (AUD/USD)
Trigger: Price has decisively broken below R3 (0.63888) and the 200-hour MA (red) on the 1h chart.
Confirmation: RFI just dipped below its ascending trendline and failed to reclaim it—momentum is bearish.
Entry: Short at market 0.6385–0.6380 (just below R3).
Initial Stop: Above R1 (0.64395) ≈ 55 pips stop.
Targets:
T1: S1 (0.63436) (~40 pips → RRR ≈ 1 : 0.7)
T2: R4 (0.63308) (~55 pips → RRR ≈ 1 : 1)
⚡ Highlight: This is a bank-order-flow style fade—selling the break of minor support after a test of the 200-hour MA confluence.
🔑 Rationale
Support→Resistance flip at R3 gives logical entry & SL.
200-hour MA rejection confirms sellers overpowering buyers.
RFI confirms sustained bearish momentum.
High RRR (>1:1) ensures edge even with moderate win-rate.
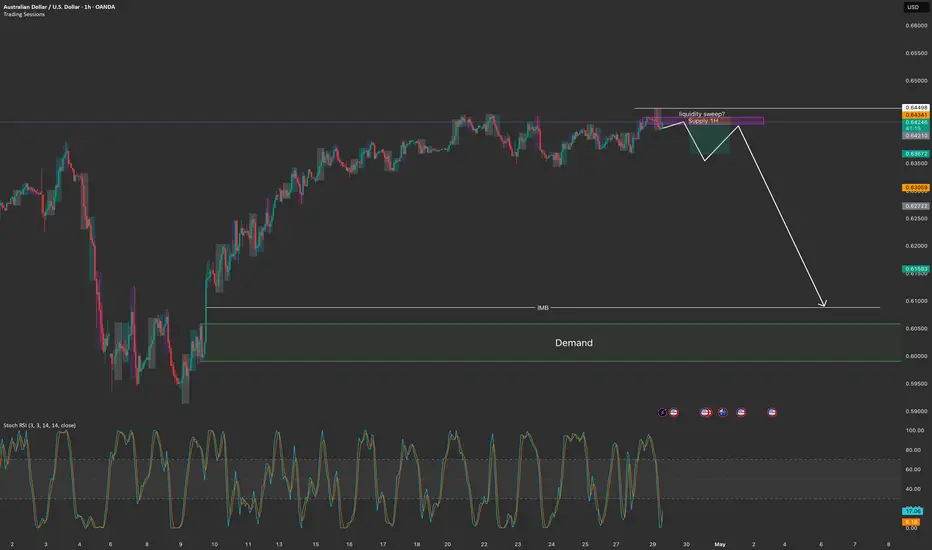
Bearish to fill demandAUDUSD current phase of consolidation ending soon. Will breakout one way or the other but I'm betting bearish.
Noteable supply one at top of consolidation, with massive liquidity grab above. Coming back into this supply after asia session 28th April.
Waiting for confirmation on the drop.
I will be looking for a break in structure to the downside on the 30min and then a retest up to supply before aiming for this demand zone over the long term at 0.60600
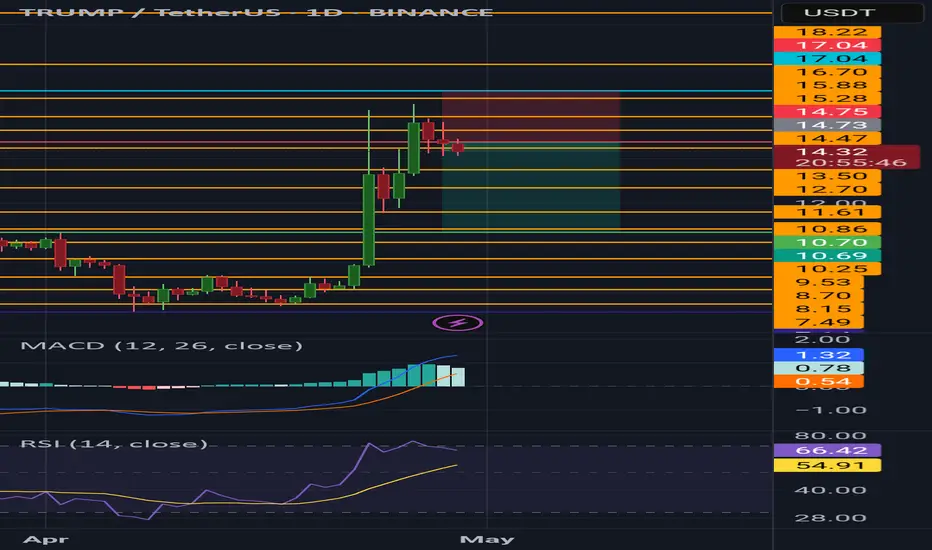
Now the market is over-extended: short to 10.70Based on Technical Indicators: MACD, RSI. And Trend Analysis: Fib Extension and Fib Retracement
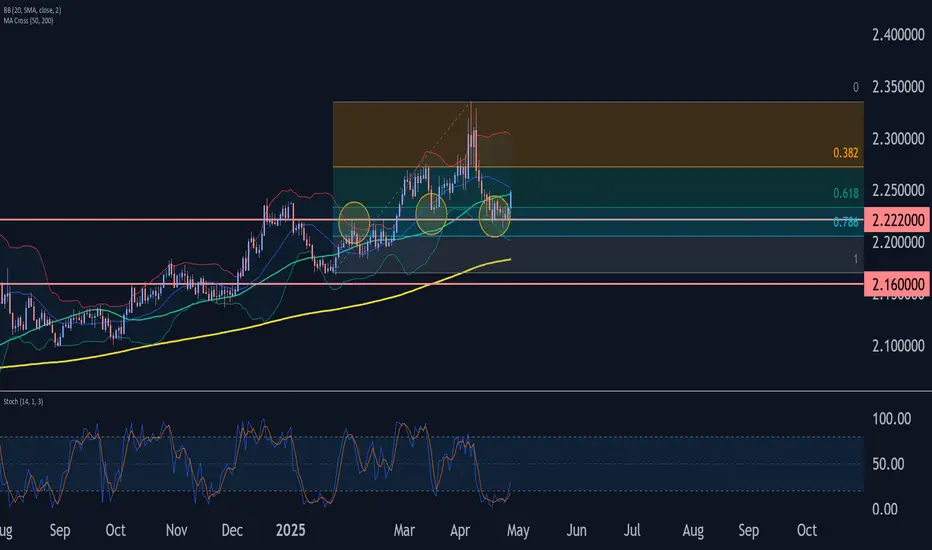
GBPNZD Wave Analysis – 28 April 2025
- GBPNZD reversed from the support area
- Likely to rise to resistance level 2.2600
GBPNZD currency pair recently reversed from the support area between the support level 2.2220, lower daily Bollinger Band and the 61.8% Fibonacci correction of the upward impulse from January.
The upward reversal from this support area stopped the previous short-term correction A – which belongs to wave (4) from the start of April.
Given the clear daily uptrend and the oversold daily Stochastic, GBPNZD currency pair can be expected to rise toward the next resistance level 2.2600.
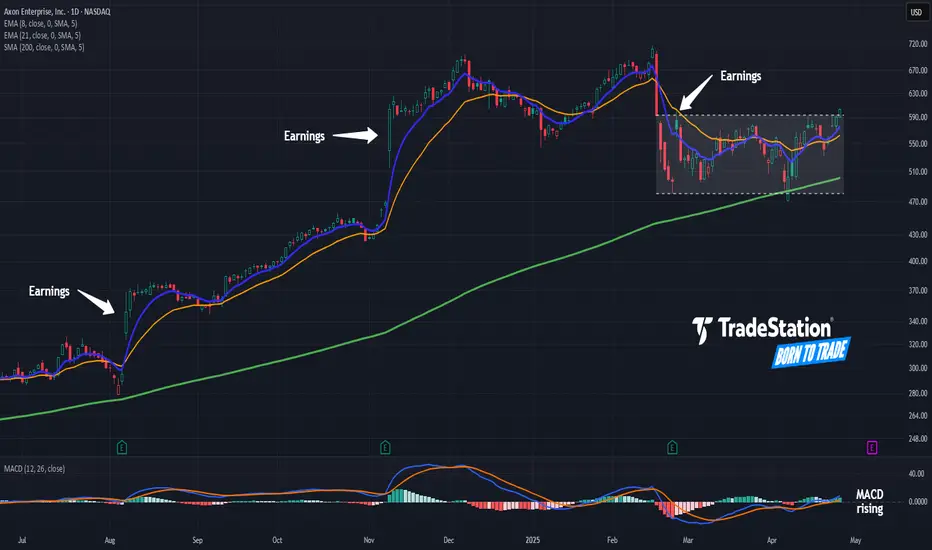
Axon’s Uptrend May Remain IntactAxon Enterprise has been climbing since last summer, and some traders may think its uptrend remains intact.
The first pattern on today’s chart is the tight consolidation pattern since February. The broader market revisited prices from a year prior, but the law-enforcement IT company never broke levels from just three months earlier. That shallower pullback may suggest buyers remain in control.
Second, AXON ended last week above the top of the range. Has a breakout begun?
Third, the stock tested and held its rising 200-day simple moving average on April 7. That may suggest the long-term uptrend remains in effect.
Next, MACD is rising. The 8-day exponential moving average (EMA) is also above the 21-day EMA. Those signals may indicate its short-term trend has gotten more bullish.
Finally, rallies after the last three earnings reports may reflect bullish sentiment towards AXON’s fundamentals.
TradeStation has, for decades, advanced the trading industry, providing access to stocks, options and futures. If you're born to trade, we could be for you. See our Overview for more.
Past performance, whether actual or indicated by historical tests of strategies, is no guarantee of future performance or success. There is a possibility that you may sustain a loss equal to or greater than your entire investment regardless of which asset class you trade (equities, options or futures); therefore, you should not invest or risk money that you cannot afford to lose. Online trading is not suitable for all investors. View the document titled Characteristics and Risks of Standardized Options at www.TradeStation.com . Before trading any asset class, customers must read the relevant risk disclosure statements on www.TradeStation.com . System access and trade placement and execution may be delayed or fail due to market volatility and volume, quote delays, system and software errors, Internet traffic, outages and other factors.
Securities and futures trading is offered to self-directed customers by TradeStation Securities, Inc., a broker-dealer registered with the Securities and Exchange Commission and a futures commission merchant licensed with the Commodity Futures Trading Commission). TradeStation Securities is a member of the Financial Industry Regulatory Authority, the National Futures Association, and a number of exchanges.
TradeStation Securities, Inc. and TradeStation Technologies, Inc. are each wholly owned subsidiaries of TradeStation Group, Inc., both operating, and providing products and services, under the TradeStation brand and trademark. When applying for, or purchasing, accounts, subscriptions, products and services, it is important that you know which company you will be dealing with. Visit www.TradeStation.com for further important information explaining what this means.
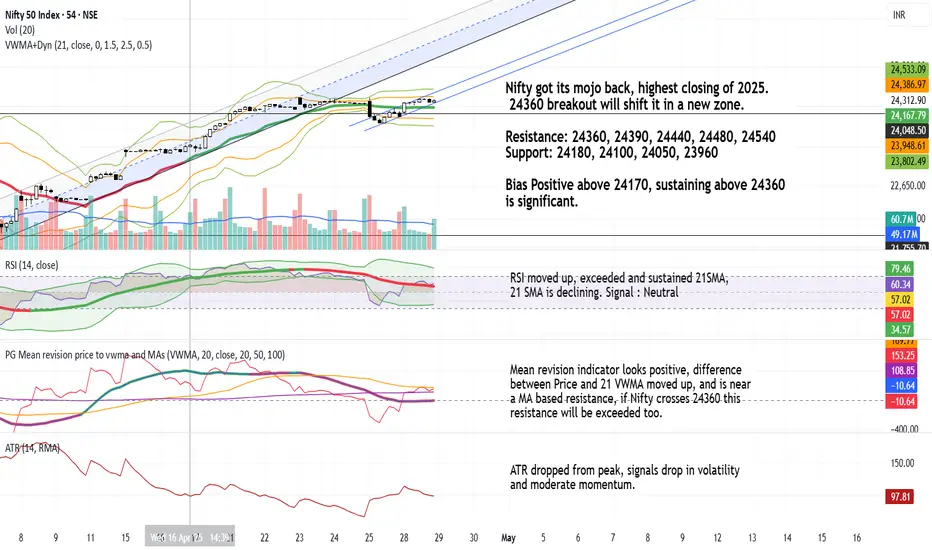
Nifty 24170-24360 range breakout to provide an directional move.Trend: Moderately bullish.
Trigger point: 24,360 breakout.
Above 24,360: Strong bullish breakout into a fresh zone.
Below 24,170: Caution advised — bias would weaken.
Volatility: Dropping — favoring smoother, more controlled moves rather than choppy swings.
Momentum: Building but needs further confirmation from RSI 21-SMA reversal.
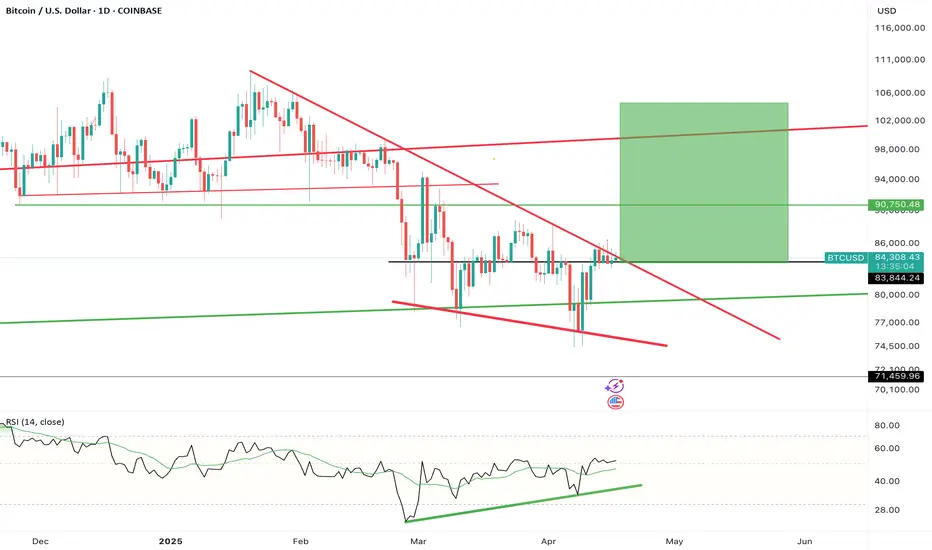
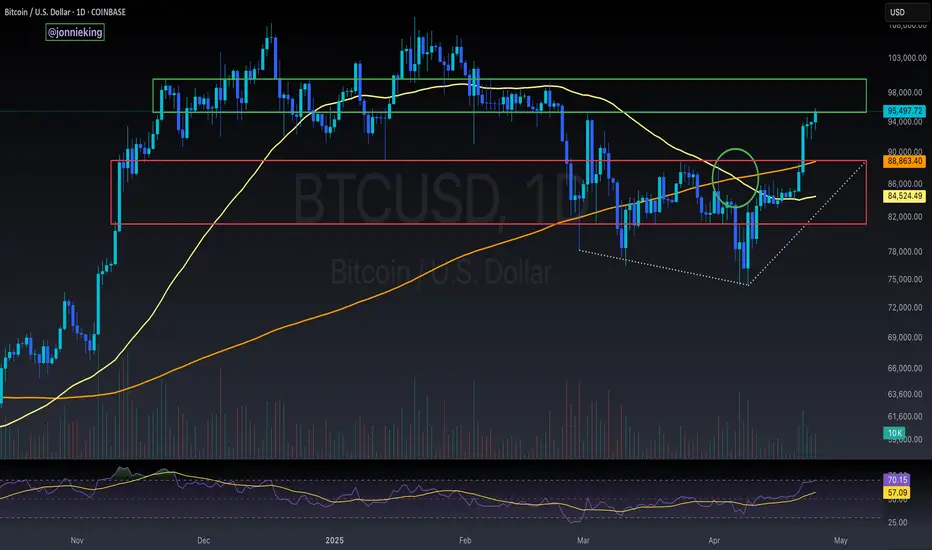
BTC Potential Breakout, Daily DivergenceBTC on the daily has the opportunity to expand way upwards over the next month - a divergence on the daily evidently takes longer to play out but RSI could easily reach 80 off the back of the structure.
I have been shorting, confidently, for a good few weeks now, with longs in between, but I'm starting to feel like I should flip long.
Solana is also trying to reclaim the daily/weekly range - things to think about for sure.
Good luck out there!
EWTSU eurousd H1 subminuette wave y starting
Elliott wave trade setup H1
subminuette wave y of a corrective wxy is going to start
5 waves motive downward movement should follow
invalidation: 1.1390 area
GT/USDT: Market Sentiment and Price DynamicsThe GT token's price dynamics are currently influenced by a mix of market sentiment and technical factors. The recent price action around $22.485 is crucial, as it could determine the next move. Positive news from Gate.io or a broader market uptrend could catalyze a break above the resistance at $22.560. Conversely, negative sentiment might push prices back to test the support at $21.940. Traders should stay informed and ready to act on these levels.

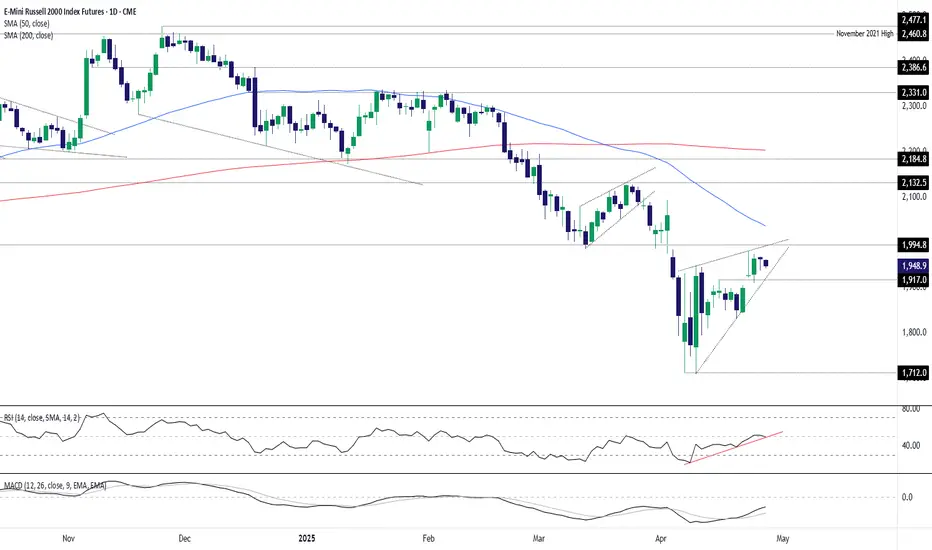
Russell 2000: Signs of Topping as Macro Risks LoomRussell 2000 futures look sluggish heading into a week laden with macro risk events. Given the cyclical characteristics of the underlying index, any hint of weakness may amplify U.S. recession fears, increasing the risk of renewed downside for stocks.
Sitting within what resembles a rising wedge and with a possible evening star pattern forming, the risk of a resumption of the broader bearish trend is arguably growing. While bearish momentum has weakened recently, the uptrend in RSI (14) and MACD also appears to be topping out.
A break and close beneath 1917 would generate a setup where bearish positions could be established with a stop above the level for protection. The April 21 low of 1831 screens as a potential target. A break of that would open the door for a run towards the double bottom of 1712 set in early April.
On the topside, a break and close above 1994.8 would invalidate the bearish bias.
Good luck!
DS
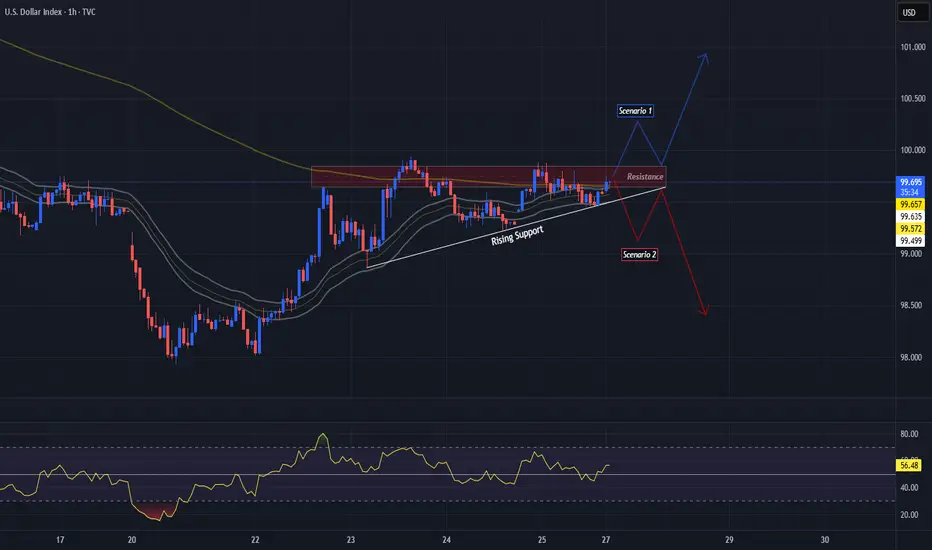
DXY Printing a Bullish Triangle??The DXY on the 1 Hr Chart is forming a potential continuation pattern, the Bullish Triangle!
Currently Price is testing the 99.6 - 99.8 Resistance Area and battling with the 200 EMA and 34 EMA Band. The reaction to this conjunction could be pivotal in who overcomes: Buyers or Sellers.
Now during the formation of the potential pattern, Price on the RSI has stayed relatively Above the 50 mark being Bullish Territory suggesting Buyers could win the Bull-Bear battle.
Until Price breaks either the Resistance Area or the Rising Support, we will not have a definitive direction in which USD will strengthen or weaken.
*Wait For The Break*
-If Price breaks the Resistance Area, USD will strength possibly heading to the 100.8 - 101 Area
-If Price breaks the Rising Support, USD will weaken possibly heading to the 98.5 - 98.3 Area
Fundamentally, it is said China and USA are possibly getting closer to potentially ending the Reciprocal Tariff War going on with both sides willing to negotiate.
With the USA being the #1 Consumer of Goods globally, other economies can not afford us to not buy their things so I continue to see the Tariff War more as a Strong-Arm for the USA to be able to negotiate better terms!
USD News:
JOLTS - Tuesday, Apr. 29th
GDP - Wednesday, Apr. 30th
Unemployment Claims / ISM Manu. PMI - Thursday, May 1st
Non-Farm Employment Change / Avg Hourly Earnings / Unemployment Rate - Friday, May 2nd
For all things Currency,
Keep it Current,
With Novi_Fibonacci
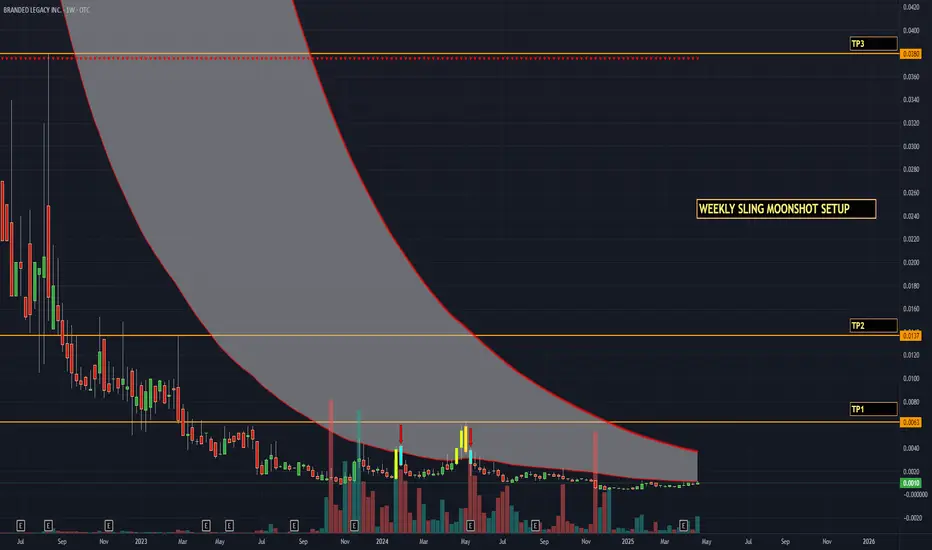
Weekly Moonshot Setup for $BLEGChecked all the boxes for this upcoming seasonal wave in the OTC. First one to set off my scanner(87% WR) since early 2021 - $BLEG. This is a low floater with under 900mm shares outstanding, transfer agent verified - pink current status (big green check on these two things).. quick snippet from the Dec 2024 report:
A. Summarize the issuer’s business operations (If the issuer does not have current operations, state “no operations”) Branded Legacy, Inc. is a diversified holdings company with a primary focus on biotechnology and wellness product development. Over the past year, the company has made significant strides in expanding its operations, acquiring new businesses, and enhancing its product offerings. Business Operations: Branded Legacy, Inc. specializes in the extraction, refinement, and synthesis of alkaloids, providing white/private label services, formulation, and co-packing solutions. The company’s main business activities revolve around the commercial development of alkaloid-infused products such as vapes, tinctures, topicals, and gummies. Additionally, Branded Legacy engages in brand development, marketing, and promoting sustainability practices. The company has expanded its portfolio through strategic acquisitions, including Sycamore BioPharma Inc. and MariJ Pharmaceuticals Inc. These acquisitions have significantly bolstered Branded Legacy's capabilities in botanical extractions and drug delivery systems, enhancing their product offerings and market reach. Product Development and Services: Branded Legacy, Inc. operates through its subsidiaries, Royal Biotek and The Alcannabist, which focus on advancing biotechnical research and development. Royal Biotek, in particular, conducts in-house pre-clinical trials to ensure product efficacy and safety, thereby building consumer trust. The company’s state-of-the-art facilities in Melbourne, FL, support the production and distribution of high-quality wellness products. Sycamore BioPharma, recently acquired by Branded Legacy, is renowned for developing plant-based pharmaceuticals and wellness solutions, including gummies, tinctures, compression sleeves, and pain-relieving topical creams. The acquisition of Sycamore BioPharma has brought over $500,000 in inventory of products and raw materials as well as key personnel for advancing clinical trials. Sycamore supports Branded Legacy's mission to deliver high-quality, innovative products. MariJ Pharmaceuticals, another significant acquisition, specializes in the development and distribution of cannabinoid-based products. This acquisition has added substantial value to Branded Legacy’s portfolio, with MariJ Pharmaceuticals valued at close to $2,000,000. The integration of MariJ Pharmaceuticals has enabled Branded Legacy to expand its product lines and leverage MariJ's expertise in cannabinoid extraction and formulation, further strengthening the company’s position in the biotech and wellness markets. Branded Legacy has also secured exclusive extraction partnerships and developed proprietary delivery systems for various health supplements, further solidifying its position in the wellness industry. The company's innovative approach is evident in its diverse product lines, which include not only traditional botanical extracts but also novel formulations aimed at improving bioavailability and therapeutic effectiveness. Growth and Market Strategy: Branded Legacy is committed to sustainable growth through continuous innovation and strategic partnerships. The company's recent moves include acquiring new facilities, enhancing production capabilities, and expanding its market reach. By integrating advanced biotechnology with robust branding and marketing strategies, Branded Legacy aims to set new benchmarks in the wellness and biotech sectors. The company's forward-thinking approach and strategic acquisitions have positioned it as a leader in the industry, with a focus on delivering high-quality, sustainable products that meet the evolving needs of consumers (Sources: Branded Legacy website, Business Insider). For further details and updates on Branded Legacy's operations, please visit their profile on OTC Markets or their official website. B. List any subsidiaries, parent company, or affiliated companies Total Refinement Solutions, LLC (DBA Royal Biotek) The Alcannabist, LLC MaryJ Pharmaceuticals, Inc. Sycamore Biopharma, Inc. (SBP) All Companies are included in this disclosure statement.
$BTC Bull Trap Clear As DayI’m probably the biggest 3-Year perma-bull on this app, and even I can tell this is most likely a bull trap.
This is either the beginning of the long awaited parabola, or else we’ll correct back down to at least the 200DMA in the next week, or the 50DMA within the next month.
Lack of volume on the move and RSI becoming overheated gives me feels for the latter
Remember, never trust a weekend pump 💯
Bookmark this.
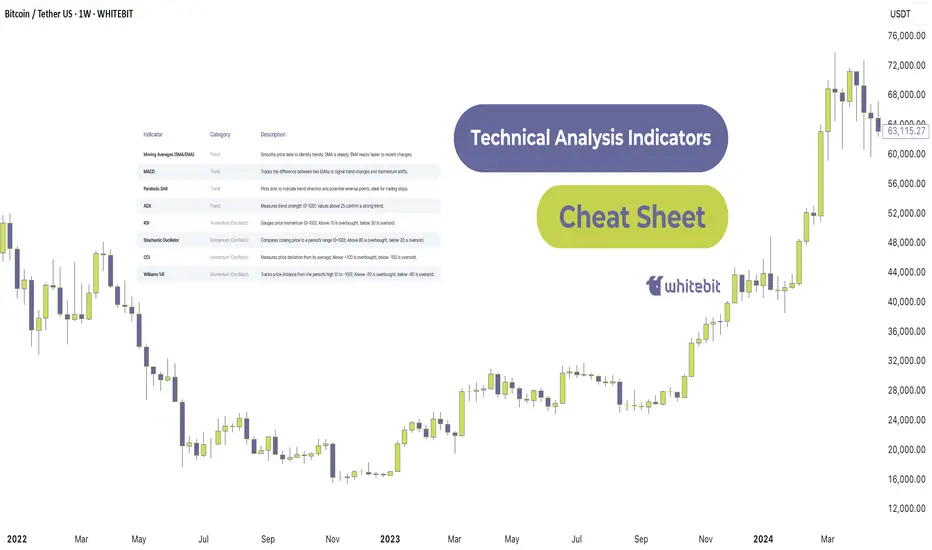
Technical Analysis Indicators Cheat SheetHello, traders! 🦾
This cheat sheet provides a comprehensive overview of the most widely used technical analysis indicators. It is designed to support traders in analyzing trends, momentum, volatility, and volume.
Below, you’ll find a handy screenshot of this Cheat Sheet that you can save and peek at whenever you need a quick, friendly refresher on your trading indicators. ;)
1. Trend Indicators
These tools identify the direction and strength of price movements, critical for trend-following strategies.
Moving Averages (MA)
Simple Moving Average (SMA) and Exponential Moving Average (EMA) smooth price data to highlight trends. Crossovers (e.g., 50-day vs. 200-day MA) signal potential trend shifts.
MACD (Moving Average Convergence Divergence) – Tracks the difference between two EMAs, paired with a signal line to generate trade signals. A bullish crossover occurs when MACD rises above the signal line.
Parabolic SAR. Places dots above or below the price to indicate trend direction. Dots below the price suggest an uptrend; above, a downtrend.
ADX (Average Directional Index)
Measures trend strength (0–100). Values above 25 confirm a robust trend; below 20 indicate consolidation.
2. Momentum Indicators (Oscillators)
These indicators assess price movement speed and highlight overbought or oversold conditions.
RSI (Relative Strength Index)
Ranges from 0 to 100, with values above 70 indicating overbought conditions and below 30 indicating oversold. The divergence between the RSI and price can signal impending reversals.
Stochastic Oscillator –Compares closing price to the price range over a period (0–100). Above 80 is overbought; below 20, oversold. %K and %D line crossovers provide precise trade signals.
CCI (Commodity Channel Index) – Measures price deviation from its average. Readings above +100 indicate overbought; below -100, oversold.
Williams %R – Similar to Stochastic, it measures distance from the period’s high (0 to 100). Above -20 is overbought; below -80, oversold.
3. Volatility Indicators
These tools quantify price fluctuation ranges to optimize trade timing.
Bollinger Bands – Comprises a 20-day SMA and two bands (±2 standard deviations). Narrow bands reflect low volatility; wide bands indicate high volatility. A price touching the outer bands may signal a reversal or trend continuation, depending on the context.
ATR (Average True Range) – Calculates the average price range over a period to gauge volatility. Higher ATR values denote greater market movement.
4. Volume Indicators
Volume-based indicators validate price movements and highlight market participation.
OBV (On-Balance Volume) – Cumulates volume to confirm price trends. The rising OBV, alongside rising prices, supports an uptrend. OBV divergence from price may foreshadow reversals.
Volume Oscillator – Compares two volume moving averages to evaluate buying or selling pressure. Positive values suggest stronger buying. It typically confirms breakouts or assesses the sustainability of a trend.
Chaikin Money Flow (CMF) – It analyzes money flow based on price and volume. Positive CMF indicates buying pressure; negative, selling pressure.
5. Other Key Indicators. Advanced Tools for Deeper Market Analysis.
Ichimoku Cloud – Combines five lines and a “cloud” to assess trend, momentum, and support/resistance. Price above the cloud signals an uptrend; below, a downtrend. Cloud thickness reflects the strength of support or resistance levels.
Fibonacci Retracement – Maps potential support and resistance using Fibonacci ratios (23.6%, 38.2%, 50%, 61.8%).
Pivot Points – Derives support (S1, S2) and resistance (R1, R2) levels from the prior period’s high, low, and close.
Skills to Sharpen for Smarter Trading
Successful traders often find that combining indicators from different categories yields better results. For instance, pairing a trend-based EMA with a momentum indicator like RSI can help confirm signals more reliably — much like crafting the perfect coffee blend, where balance is everything.
Many also realize that stacking similar tools, such as using both RSI and Stochastic, tends to clutter the picture rather than clarify it. A focused set of indicators usually proves more effective.
Another common practice is backtesting setups on historical data to understand how strategies perform in specific markets and timeframes. It’s a way to rehearse before stepping onto the stage.
Ultimately, those who see consistent results tend to integrate indicators into a coherent strategy rather than reacting to every signal. That clarity often makes all the difference
Many of these indicators, from MACD to Bollinger Bands, are readily available on platforms like TradingView, making it easy to apply them to your charts.
Subscribe and let us know which of these indicators intrigues you the most so we can explore it further in our next post!
Good luck! 👏
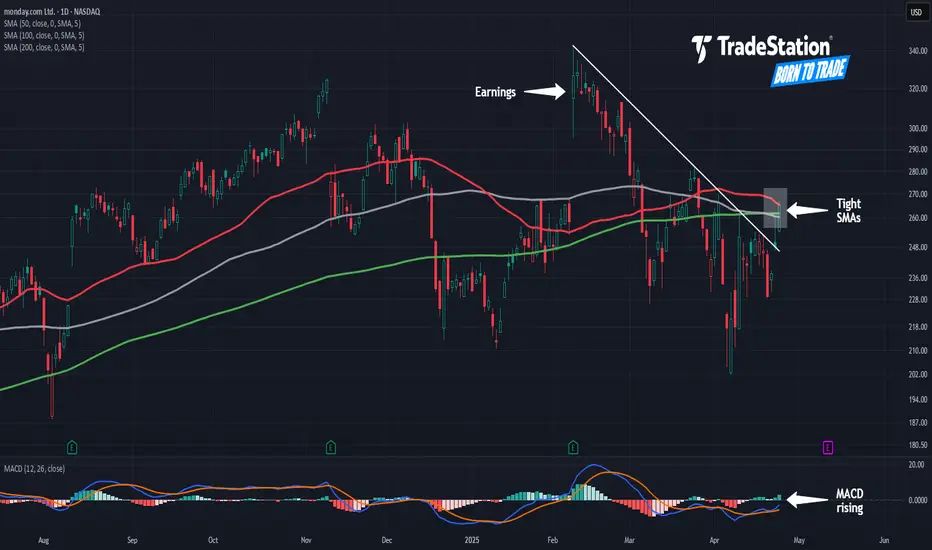
Monday.com May Start MovingMonday.com has drifted for the last year, but some traders may think the business-software company is ready to start moving.
The first pattern on today’s chart is the bullish price gap on February 10 after earnings, revenue and guidance beat estimates. The shares touched their highest level since late 2021, only to decline with the broader market.
However, the slide wasn’t significant and MNDY stabilized at lows from January. The shallowness of the pullback may reflect a lack of selling pressure.
Second, the 50-, 100- and 200-day simple moving averages are virtually on top of each other. Does that long-term neutrality create potential for price expansion?
Next, MNDY has pushed above a falling trendline.
Finally, MACD is rising.
TradeStation has, for decades, advanced the trading industry, providing access to stocks, options and futures. If you're born to trade, we could be for you. See our Overview for more.
Past performance, whether actual or indicated by historical tests of strategies, is no guarantee of future performance or success. There is a possibility that you may sustain a loss equal to or greater than your entire investment regardless of which asset class you trade (equities, options or futures); therefore, you should not invest or risk money that you cannot afford to lose. Online trading is not suitable for all investors. View the document titled Characteristics and Risks of Standardized Options at www.TradeStation.com . Before trading any asset class, customers must read the relevant risk disclosure statements on www.TradeStation.com . System access and trade placement and execution may be delayed or fail due to market volatility and volume, quote delays, system and software errors, Internet traffic, outages and other factors.
Securities and futures trading is offered to self-directed customers by TradeStation Securities, Inc., a broker-dealer registered with the Securities and Exchange Commission and a futures commission merchant licensed with the Commodity Futures Trading Commission). TradeStation Securities is a member of the Financial Industry Regulatory Authority, the National Futures Association, and a number of exchanges.
TradeStation Securities, Inc. and TradeStation Technologies, Inc. are each wholly owned subsidiaries of TradeStation Group, Inc., both operating, and providing products and services, under the TradeStation brand and trademark. When applying for, or purchasing, accounts, subscriptions, products and services, it is important that you know which company you will be dealing with. Visit www.TradeStation.com for further important information explaining what this means.
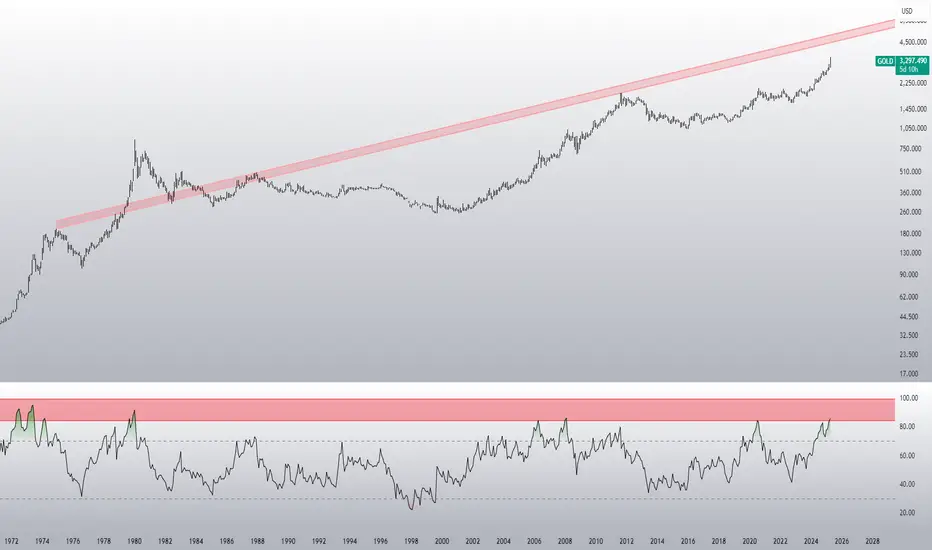
Golden times!Gold is not done yet, imo. 5k is in play. Hard assets like Gold and Bitcoin are becoming a safe haven.
Bitcoin Bulls Eye $95K as Upside Momentum BuildsAfter a bullish wedge break and having cleared the key 50-day moving average earlier this week, bitcoin bulls will now be eyeing a break above $95,000, especially with indicators such as RSI (14) and MACD signalling strengthening topside momentum.
A break and close above $95,000 would generate a bullish setup, allowing for longs to be established above with a stop beneath for protection. While some resistance may be encountered around $100,000, a move beyond that psychologically important level may encourage bulls to look for a run towards the record high above $108,000.
In the interim, bids have been noted at $91,750 with sellers emerging on pushes above $94,000.
Good luck!
DS

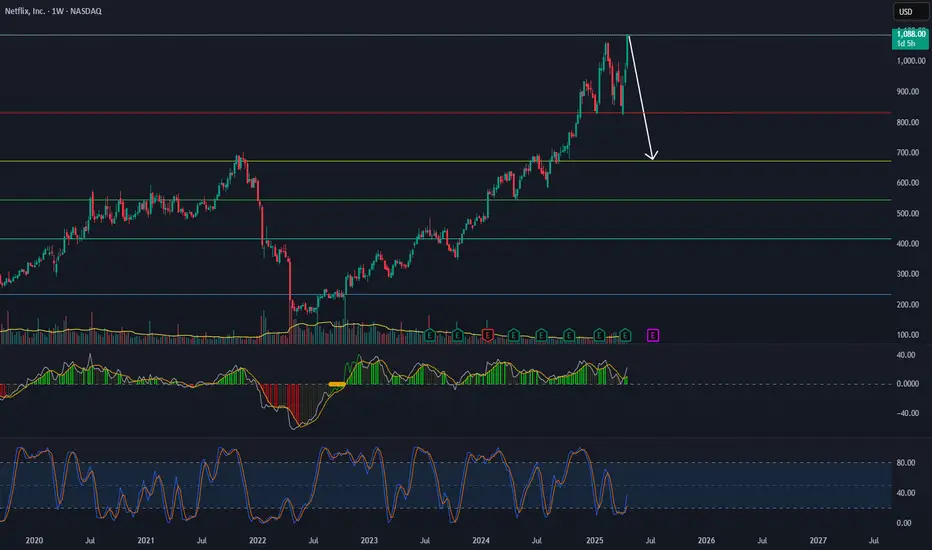
Short NFLXBearish divergences on momentum oscillators signaling impeding correction. Anticipating move down to the $672 level within a few weeks. Shorting here with stop loss at $1100.
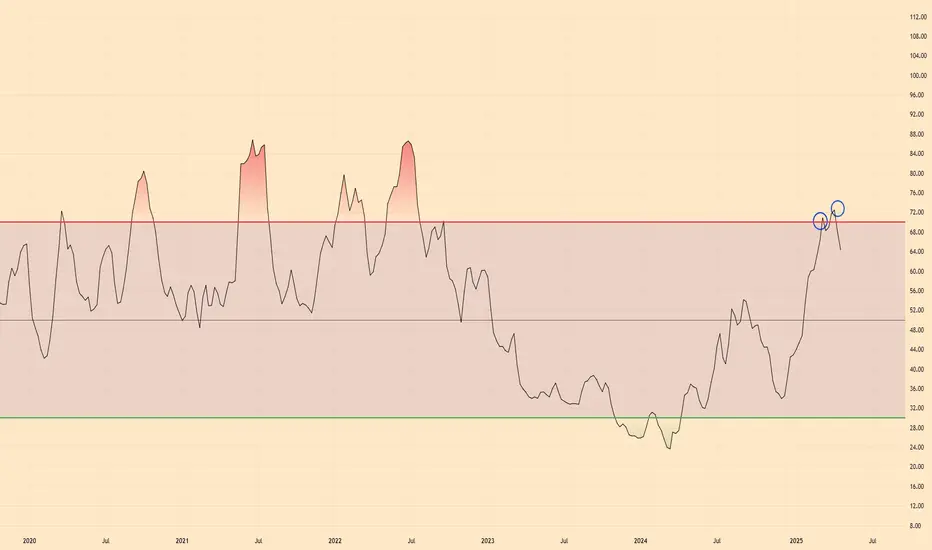
$USDC | Altseason Incoming.....FinallyCRYPTOCAP:USDC Dominance looks to be Double Topped on the RSI side and per historic movements, this looks promising for the market.
I say, BRING ON THE ALTCOINS.
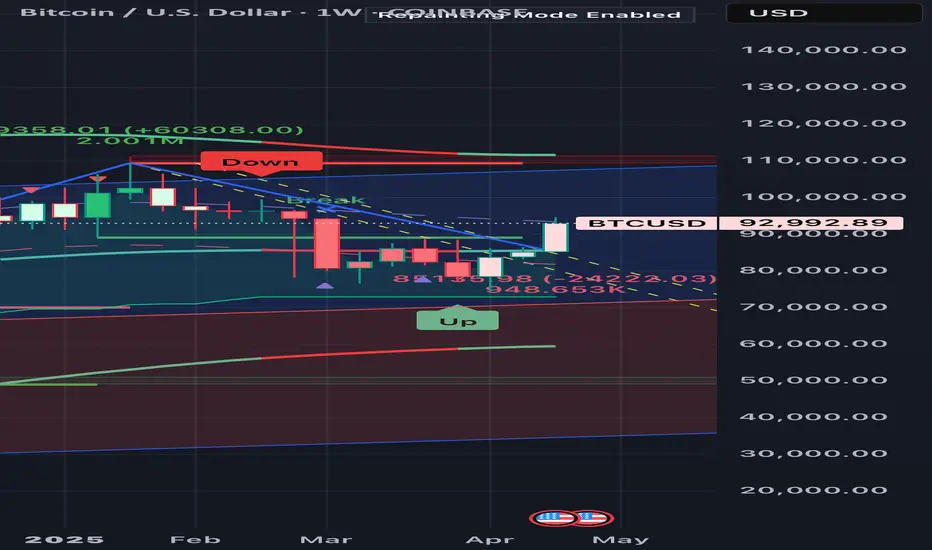
Technical Analysis Idea for BTC/USD (1W Chart - Coinbase) CurrenSuggested Strategy (just an idea):
• Speculative long entry: $93,000
• TP1: $98,000
• TP2: $103,000
• SL: $85,000
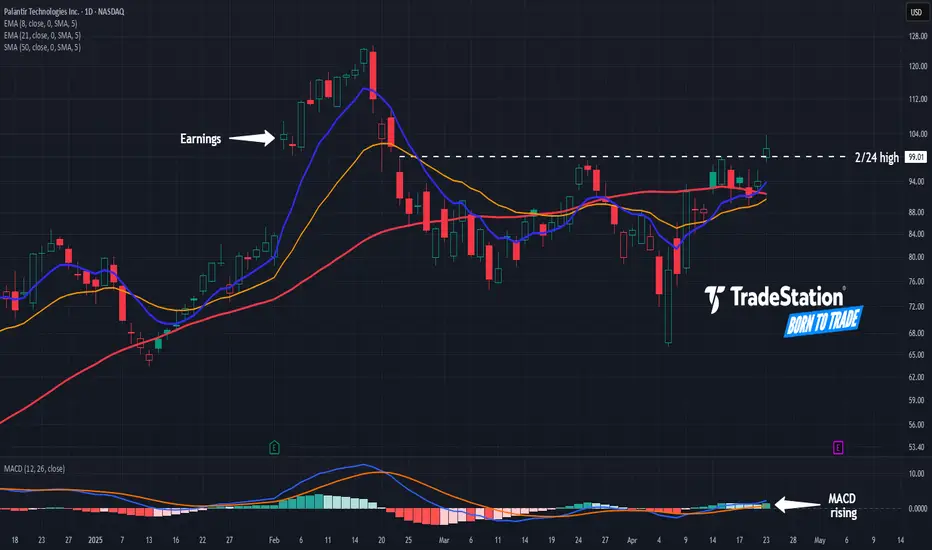
Potential Breakout in PalantirPalantir Technologies has been consolidating as the broader market struggled, and some traders may look for its uptrend to continue.
The first pattern on today’s chart is the February 24 high of $99.01. PLTR peaked near that level in late March and again last week. However the stock cleared the resistance yesterday, which may signal a breakout.
Second, prices consolidated at the 50-day simple moving average but have now escaped from it. Is the intermediate-term trend getting more bullish?
Third, the 8-day exponential moving average (EMA) is above the 21-day EMA. MACD is also rising. Those patterns may reflect bullish short-term momentum.
Finally, the software company is a highly active underlier in the options market, averaging more than 700,000 contracts per session in the last month. (It ranks in the top five of the S&P 500, according to TradeStation data.) That could help traders take positions with calls and puts.
TradeStation has, for decades, advanced the trading industry, providing access to stocks, options and futures. If you're born to trade, we could be for you. See our Overview for more.
Past performance, whether actual or indicated by historical tests of strategies, is no guarantee of future performance or success. There is a possibility that you may sustain a loss equal to or greater than your entire investment regardless of which asset class you trade (equities, options or futures); therefore, you should not invest or risk money that you cannot afford to lose. Online trading is not suitable for all investors. View the document titled Characteristics and Risks of Standardized Options at www.TradeStation.com . Before trading any asset class, customers must read the relevant risk disclosure statements on www.TradeStation.com . System access and trade placement and execution may be delayed or fail due to market volatility and volume, quote delays, system and software errors, Internet traffic, outages and other factors.
Securities and futures trading is offered to self-directed customers by TradeStation Securities, Inc., a broker-dealer registered with the Securities and Exchange Commission and a futures commission merchant licensed with the Commodity Futures Trading Commission). TradeStation Securities is a member of the Financial Industry Regulatory Authority, the National Futures Association, and a number of exchanges.
Options trading is not suitable for all investors. Your TradeStation Securities’ account application to trade options will be considered and approved or disapproved based on all relevant factors, including your trading experience. See www.TradeStation.com . Visit www.TradeStation.com for full details on the costs and fees associated with options.
Margin trading involves risks, and it is important that you fully understand those risks before trading on margin. The Margin Disclosure Statement outlines many of those risks, including that you can lose more funds than you deposit in your margin account; your brokerage firm can force the sale of securities in your account; your brokerage firm can sell your securities without contacting you; and you are not entitled to an extension of time on a margin call. Review the Margin Disclosure Statement at www.TradeStation.com .
TradeStation Securities, Inc. and TradeStation Technologies, Inc. are each wholly owned subsidiaries of TradeStation Group, Inc., both operating, and providing products and services, under the TradeStation brand and trademark. When applying for, or purchasing, accounts, subscriptions, products and services, it is important that you know which company you will be dealing with. Visit www.TradeStation.com for further important information explaining what this means.