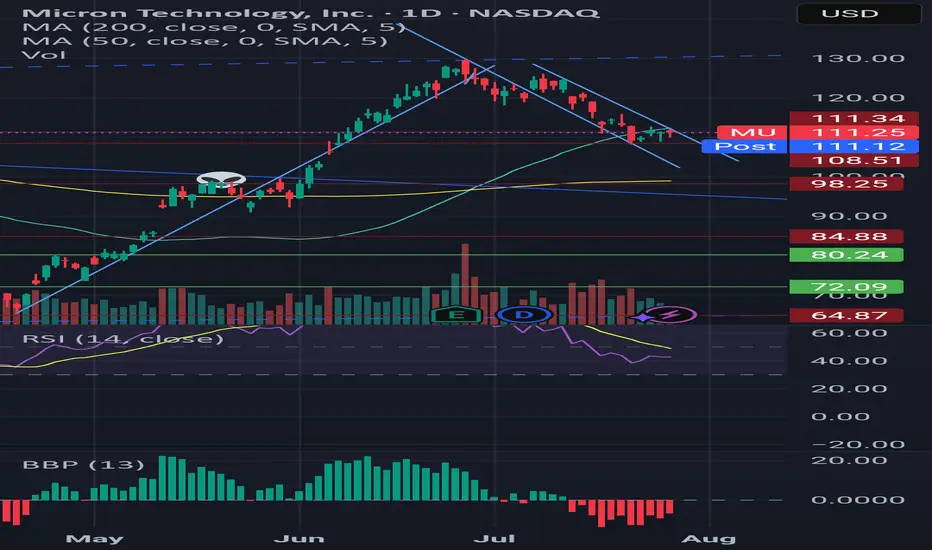
BearishI have a feeling that Micron's gonna retest $109 or blow through it and run for the 200 moving average. Waiting to see a bullish divergence in the RSI, or for it to get out of this little downtrend it's forming
Oscillators
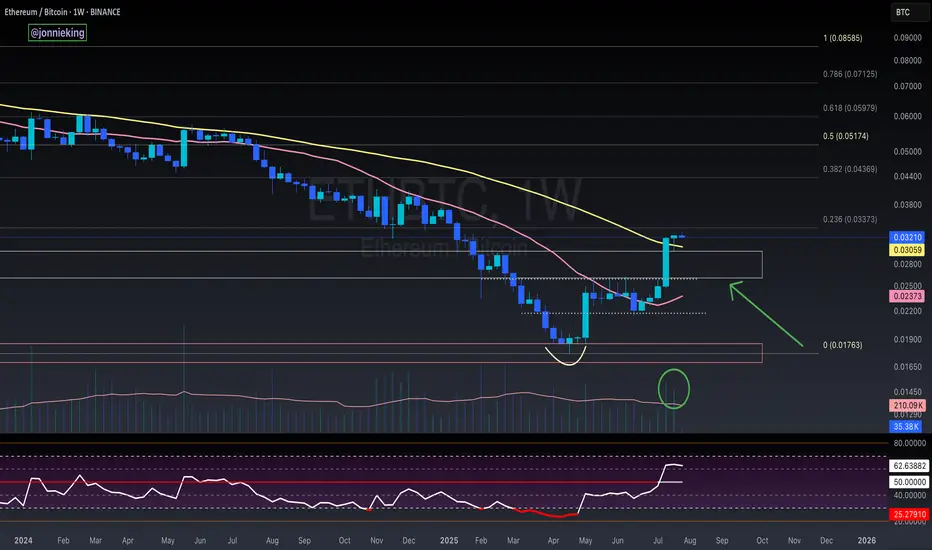
$ETH 2nd Weekly Close Above 50MA = Alt Season2nd Consecutive Weekly Close
above the 50MA for CRYPTOCAP:ETH
✅ Volume to confirm the breakout.
✅ RSI has bottomed.
WHAT TO WATCH 👀
┛Bullish Cross on the 20/50MA to confirm the next leg up.
┛Approaching some resistance ahead at the .236 Fib
┛Expect a small pullback in the next week or two so make sure to get your bids in.
Remember the rotation:
✅ BTC > ✅ ETH > Large Caps > Mid Caps > Micro Caps.
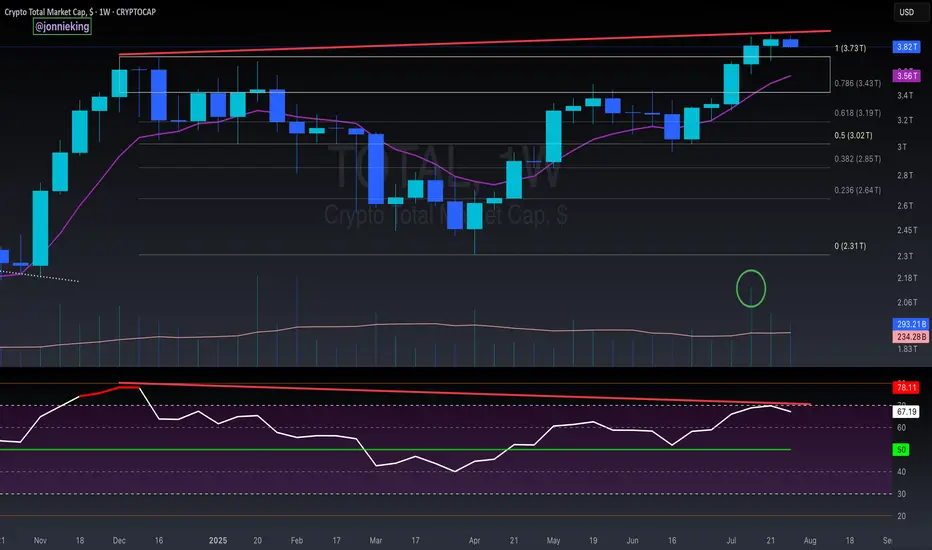
$TOTAL Market Cap Highest Weekly Close - Bearish Divergence?!Once again, highest Weekly Close on the Crypto CRYPTOCAP:TOTAL Market Cap ever.
PA continues to trend above the EMA9 and POI.
It’s worth noting Bearish Divergence on this local level.
I do not believe this is much to worry about however and have discussed this in prior analysis which I will post in the comments.
Strong Volume has shifted in the Bulls favor.
Bulls want to keep PA above $3.7T
the second confirmationThe modified RSI displayed in the SS indicates that the Nifty's downward trend should be halted for the time being, as it hit the lower ceiling of the Bollinger band today. This could cause the RSI oscillator to move sideways or undergo a correction, which would help it avoid breaking this bollinger band lower ceiling as showed in the SS.
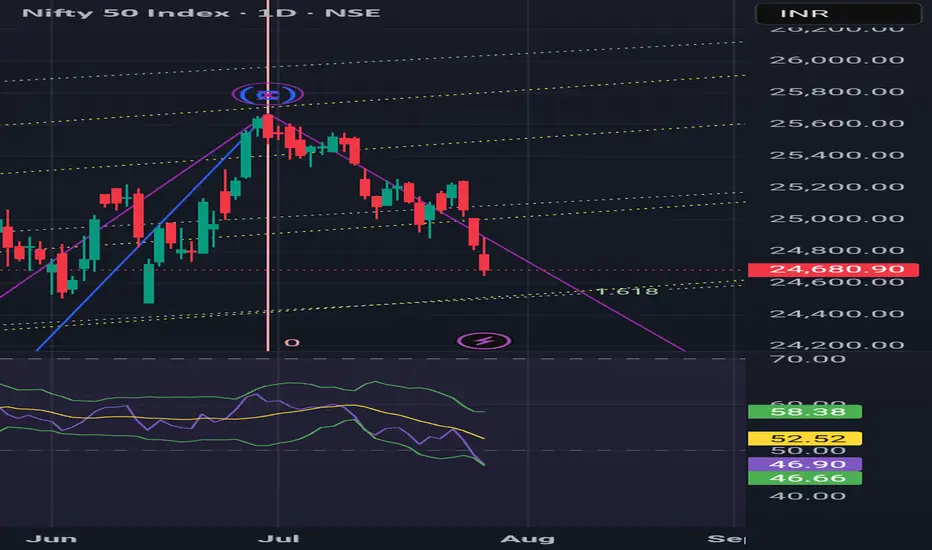
I think it's today.I admit that today's Nifty surpassed below yesterday's 24800 level, and my rash assumption that this level would act as a strong reversal support was wrong. But my overall opinion hasn't changed: there's a good chance the market will correct this whole wave 1 decline if the GIFT Nifty support level of 25620 isn't broken by tomorrow.
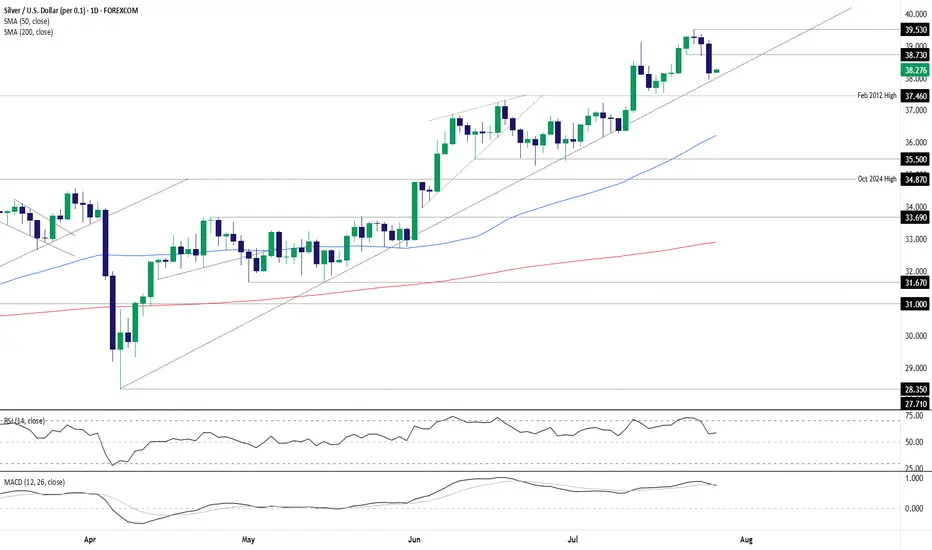
Silver dips to trendline, bulls eye bounceSilver’s latest pullback has seen it move back towards long-running uptrend support, creating a decent entry level for longs with price momentum favouring buying dips over selling rips.
Longs could be established above the trendline with a stop beneath for protection, targeting minor resistance at $38.73 initially and, if broken, the July 23 swing high of $39.53. If the latter were to be achieved, price and momentum signals at the time should dictate whether to hold for a potential test of the psychologically important $40 level.
The price has already bounced off the uptrend on numerous occasions since being established, enhancing the appeal of the setup. While RSI (14) and MACD are not screaming buy when it comes to market momentum, they’re tilted bullish rather than bearish, favouring upside.
If silver were to break and close beneath the uptrend, the bullish bias would be invalidated.
Good luck!
DS
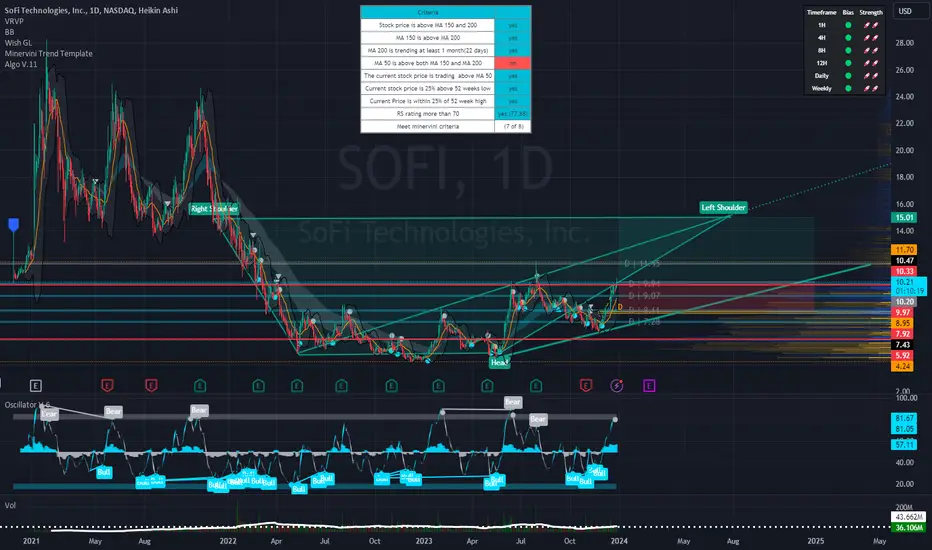
SoFi's Surge: Unveiling 2023 and What Lies Ahead in 2024Technical Analysis Overview
Current Price : $10.34, a 3.77% increase.
Weekly Trend : Showing a positive trend with a 5.35% increase over the last five days.
1-Month Trend : A significant increase of 51.96%, indicating strong bullish sentiment.
6-Month and Yearly Trends : A 17.04% increase over the last six months and a 124.51% increase year to date, highlighting a robust bullish trend.
Advanced Technical Indicators
Relative Strength Index (RSI) : 70.41 - Indicating that SOFI is nearing overbought territory, which could lead to a potential reversal or consolidation in the short term.
Moving Average Convergence Divergence (MACD) : 0.63 - Suggesting bullish momentum, indicating a strong buying trend.
Other Indicators : STOCH (83.28), STOCHRSI (84.02), ADX (37.09), Williams %R (-8.57), CCI (104.63), ATR (0.46), Ultimate Oscillator (54.76), and ROC (24.66) all contribute to a picture of current bullish momentum but with potential for short-term volatility or pullback.
Market Sentiment and External Factors
Market Capitalization : $9.904B USD.
Trading Volume Analysis : A high trading volume of 35,199,288, suggesting active market participation and interest in the stock.
Recent News Coverage Impacting SOFI
Bullish Outlook for 2024 : Analysts predict SOFI stock could continue its rally in the new year, benefiting from expected interest-rate cuts. A notable analyst has set a high price target of $14 for SOFI stock, implying significant upside potential ( InvestorPlace ).
Focus on Non-Lending Businesses : Analysts appreciate SoFi's shift towards non-lending businesses, improving earnings quality despite a higher-for-longer interest-rate policy.
Central Bank Policy Changes : Potential interest rate cuts in 2024 could benefit SoFi's lending business, as lower rates tend to spur borrowing and lending activity.
Conclusion
SOFI's stock shows strong bullish signs in the medium to long term, but the current overbought condition warrants caution for short-term traders.
The recent news and analyst predictions provide a positive outlook for 2024, making SOFI an interesting stock for both traders and long-term investors.
DaxPrime: BlackRock Exec Move Signals SharpLink’s $1.3B ETH ShifIn a development that is drawing attention across both institutional finance and the crypto ecosystem, a senior executive from BlackRock’s digital assets division has transitioned to SharpLink Gaming — a rising Ethereum whale and sports betting infrastructure player now managing over $1.3 billion in ETH-based assets. At DaxPrime, we see this move not as an isolated career shift but as a strategic signal of deepening convergence between traditional asset management and Web3-native businesses.
The Move: From Wall Street to Web3 Execution
According to sources familiar with the matter, BlackRock’s former Head of Digital Asset Strategy, Daniel Wexler, is joining SharpLink Gaming as its Chief Digital Officer. Wexler played a critical role in shaping BlackRock's crypto ETF initiatives and oversaw early-stage partnerships with Ethereum ecosystem projects.
His transition comes at a time when SharpLink — originally focused on B2B sports betting technologies — has evolved into a key player in decentralized infrastructure, integrating smart contracts, Layer-2 analytics, and tokenized in-game markets. The company currently holds over $1.3 billion in Ethereum, making it one of the largest corporate ETH holders in the entertainment-tech sector.
DaxPrime’s View: Strategic Talent Realignment
At DaxPrime, we interpret this as more than just a personnel update. It reflects a broader realignment where institutional talent is gravitating toward firms that offer speed, flexibility, and a native role in the decentralized economy.
“The move illustrates a trend we’ve tracked since early 2024: legacy finance professionals are increasingly pivoting toward operational roles in Web3-native companies, particularly those with real assets and strong ETH exposure,” says Michaela Strobel, Senior Analyst at DaxPrime.
SharpLink’s use of Ethereum spans beyond treasury holdings. The firm is building proprietary smart contract infrastructure for real-time sports data feeds, NFT-linked fantasy games, and decentralized betting protocols — signaling a broader use-case than speculative ETH storage.
Ethereum as a Strategic Asset
Wexler’s decision also underscores Ethereum’s growing importance as a corporate strategic asset, not merely an investment vehicle. Ethereum’s programmable layer and widespread developer adoption make it the backbone of emerging digital business models — including SharpLink’s.
DaxPrime’s July 2025 ETH Treasury Index reveals that more than 18 publicly listed firms now hold over $500 million in Ethereum each, compared to just five a year ago. This uptick is particularly concentrated in sectors like digital media, AI-gaming convergence, and decentralized finance tooling.
“Ethereum’s shift from an investment to infrastructure asset is well underway,” Strobel notes. “Wexler’s move brings boardroom-grade credibility to a company operating deep within that transformation.”
What It Means for Investors
For investors, this move signals two critical developments:
Institutional Validation of Web3 Business Models: Wexler’s transition lends credence to firms building around Ethereum-based infrastructure, rather than just speculating on token prices.
New Pathways for ETH Utility: SharpLink’s planned integration of ETH staking, yield strategies, and decentralized oracles into its sports gaming vertical could set new standards for how consumer-facing platforms leverage blockchain.
DaxPrime’s Conclusion
The decision by a senior BlackRock executive to join an Ethereum-native company like SharpLink Gaming is not a one-off anomaly. It reflects a rapidly maturing industry where the center of gravity is shifting from financial speculation to operational integration.
At DaxPrime, we continue to monitor executive movements as a leading indicator of sector confidence and capital rotation. As Ethereum evolves from “store of value” to “platform for value,” such strategic appointments signal where the smart money is going — and what the next phase of crypto utility will look like.

A slight pullback to around 112,000 is expected before a bullishThere is a double top on the daily timeframe. It could pull back to the previous support level that I mentioned in the chart. Moreover, there is a healthy trendline support that can help BTC price bounce.

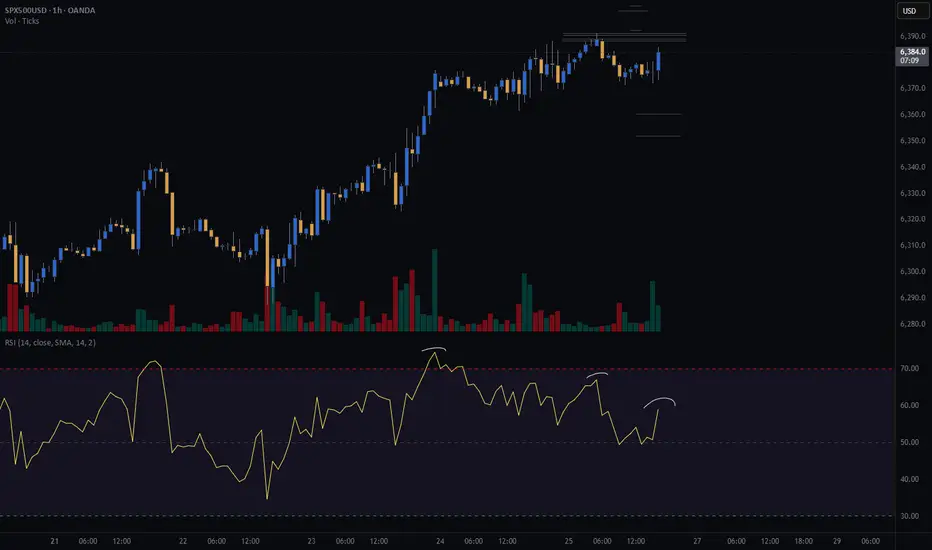
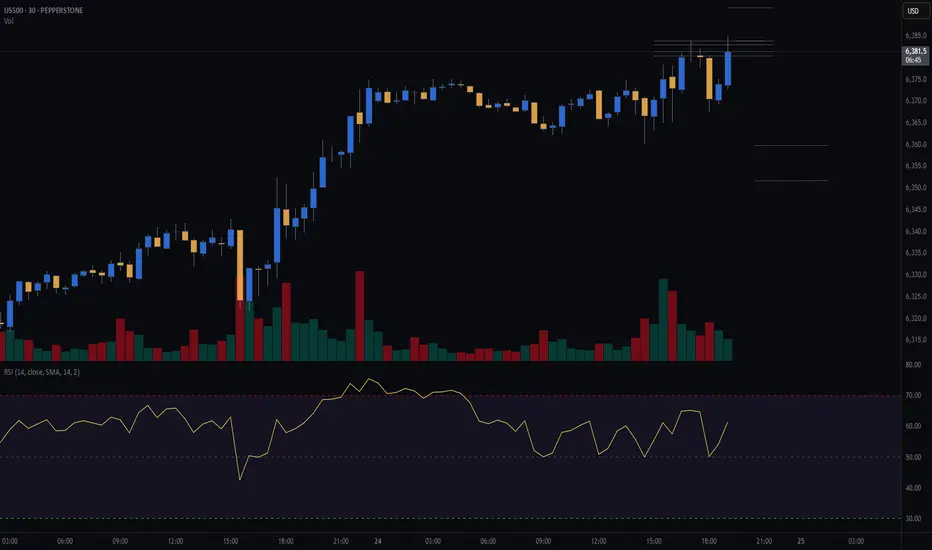
S&P 500 (CASH500) - Double Top H1Risk/reward = 2.7
Entry price = 6388.4
Stop loss price = 6399.7
Take profit level 1 (50%) = 6360.4
Take profit level 2 (50%) = 6352
Also, waiting on confirmation on some variables
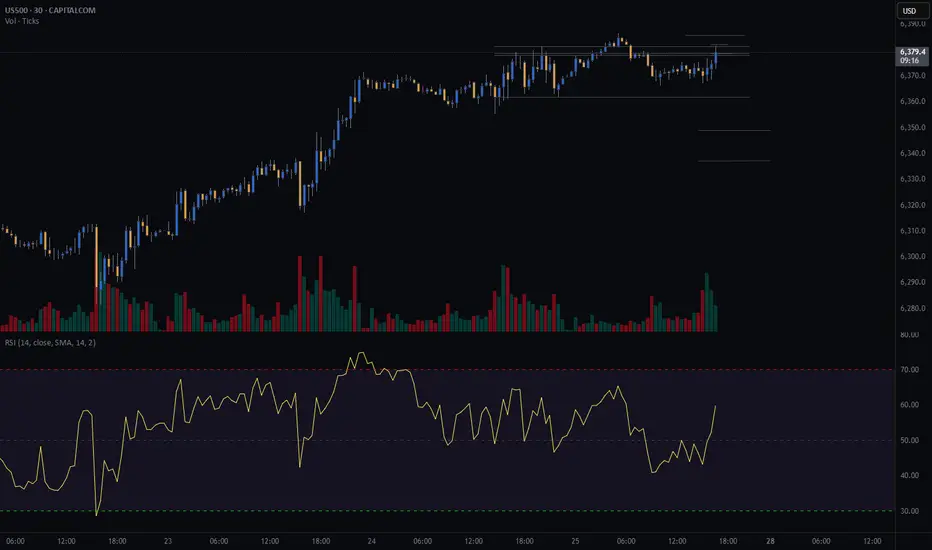
S&P500 (CASH500) SHORT - head and shoulders 30minRisk/reward = 4.1
Entry price = 6378
Stop loss price = 6385.9
Take profit level 1 (50%) = 6349.2
Take profit level 2 (50%) = 6337.2
Still waiting on confirmation of a few variables at close of this 30min candle at 17.00
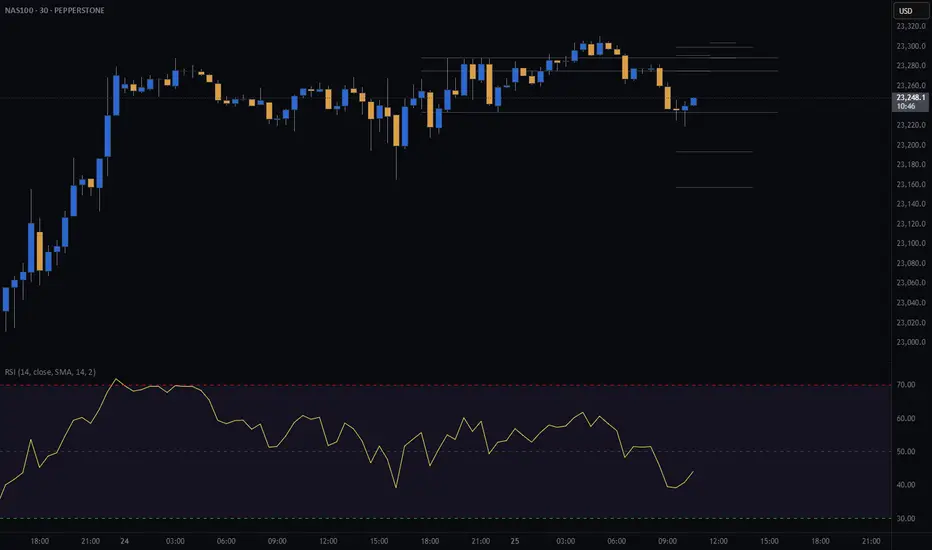
NDX (NASDAQ) CASH500 SHORT - Head and shoulders 30minRisk/reward = 3.2
Entry price = 23 275.7
Stop loss price = 23 303.9
Take profit level 1 (50%) = 23 193
Take profit level 2 (50%) = 23 157
Waiting on confirmation on a number of variables before entering the trade.
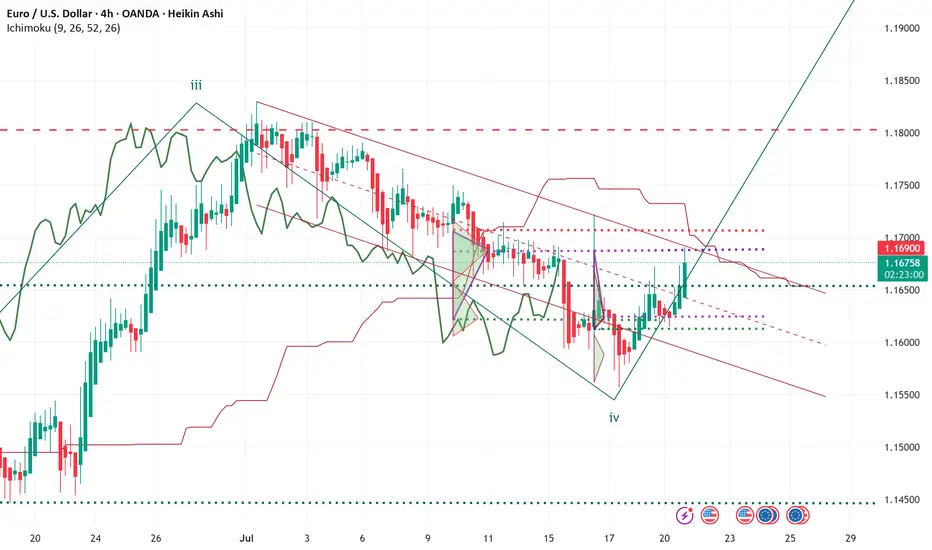
ELLIOTT WAVE EURUSD H4 update
EW Trade Set Up H4
subminuette W4 seems finished
monitor the breakout of the descending channel that appears to contain wave IV
The bullish movement that started on July 17th must assume a 5-wave pattern
key levels (area)
1.1705
1.1684 POC
1.1654
note :
the breakout upwards of the leading span B (red line) by the lagging span (green line) will confirm the start of a bullish movement in the subminuette wave v.
Failure to break above price levels 1.1684 and 1.1705 will result in a recalculation of the waves count
NASDAQ (CASH100) SHORT - double top H6Risk/reward = 4.3
Entry price = 23 282
Stop loss price = 23 398
Take profit level 1 (50%) = 22 871
Take profit level 2 (50%) = 22 663
If current H6 goes back into range, I will open short position.
All variables on checklist have been met.
I was out last night so I missed my initial entry. Hoping for a second chance.
Hopefully this short works because the last few higher time frame short setups have failed, although because of exit plan I have made very little losses.

S&P (CASH500) SHORT - Double top 30minRisk/reward = 2.7
Entry price = 6384
Stop loss price = 6393.8
Take profit level 1 (50%) = 6359.8
Take profit level 2 (50%) = 6351.8
Will get confirmation of remaining variables at close of this 30min candle at 19.30.
Why a USD Bounce Could Trigger a Stock PullbackThe US Dollar has faced brutal selling during the first half of 2025. Some are even questioning whether the Dollar’s global hegemony is at risk. Early in the year the US stock market AMEX:SPY sold off aggressively, falling 19% from mid‑March to early April. Since then stocks have more than regained their losses and the Dollar is still in the tank. So where does that leave us for the rest of the year?
The Dollar Inverse Correlation
The US Dollar has an inverse correlation to most everything. Stocks, bonds, crypto, commodities, real estate — all are measured in Dollars. Therefore when the Dollar loses value, all things equal it takes more of them to reach the same value those assets were denominated at before. Conversely when the Dollar rises, other assets lose value in Dollar terms. Here we can see a long standing inverse correlation to stocks AMEX:SPY
Dollar in oversold territory
The Relative Strength Index (RSI) is a momentum oscillator that measures the magnitude of recent price changes on a scale from 0 to 100 to help identify overbought (above 70) or oversold (below 30) conditions. The Dollar has hit oversold several times so far this year, but not yet staged a material recovery.
Stocks in overbought territory
Meanwhile stocks have staged a blistering rebound off the "Liberation Day" driven selloff earlier this year. The S&P 500 now sits at an all‑time high, and you guessed it, has tapped overbought twice this month.
USD is fundamentally attractive
Because investors seek to earn the highest available yield on their capital, they tend to move funds into currencies offering higher interest rates (and away from those with lower rates), so differences in policy rates across countries create incentives for cross‑border borrowing and lending that drive FX flows. For example the Fed ( ECONOMICS:USINTR ) is at 4.5%, and the ECB ( ECONOMICS:EUINTR ) is at 2.15%. Moreover the Dollar is down significantly against major trading pairs that have lower yields. In our prior example the Dollar is down 11.98% against the Euro YTD (1- FX:EURUSD ), leaving substantial room for capital gains. Gravity could lure FX traders back in the second half of 2025.
Tariff calculus
Tariffs tend to bolster the imposing country’s currency in two main ways: by making imports more expensive they reduce import volumes, improving the trade balance (i.e. fewer foreign‑currency outflows), and by collecting duties in domestic currency the government effectively withdraws that currency from circulation, increasing its relative scarcity. Both effects lift demand for—and support the value of—the home currency.
Putting it all together
Despite the TVC:DXY ’s ~10.8% YTD slide and repeated oversold conditions, the compelling carry trade sets the stage for a USD bounce that, in turn, could pressure overextended equities. With stocks stretched and the Dollar oversold, the carry‑driven rebound in USD could well presage a pullback in equities. Stocks are expensive, Dollars are cheap 🤑

Can ChatGPT Predict Bitcoin’s Next Move? BITDPS’s AdvantageIn a digital world increasingly shaped by AI, the question arises: Can ChatGPT predict Bitcoin’s next move? Traders and investors alike are turning to AI-powered tools in search of an edge in the notoriously volatile crypto market. While ChatGPT and similar language models can offer valuable insights, the answer lies not in prediction, but in interpretation — and that’s where expert systems like BITDPS make the difference.
What Can ChatGPT Actually Do?
ChatGPT is a powerful language model capable of processing large volumes of historical data, technical indicators, and news sentiment. It can:
Analyze chart patterns and market signals
Interpret macroeconomic events and crypto news
Explain the logic behind price movements
Simulate different market scenarios
However, ChatGPT cannot "see the future." It does not have real-time data feeds or live market access. Its strength lies in context-based analysis and scenario building — tools that help human or automated decision-makers make more informed choices.
Why Bitcoin Prediction Is So Complex
Bitcoin’s price is influenced by a wide array of factors:
Global macroeconomic conditions (interest rates, inflation, dollar strength)
Crypto-specific events (ETF approvals, exchange hacks, regulatory crackdowns)
Investor sentiment and technical setups
Whale behavior and on-chain movements
This complexity means that no single model — not even ChatGPT — can consistently predict exact price points or timing. But combining ChatGPT’s pattern recognition with quantitative strategies, like those used by BITDPS, creates a powerful hybrid approach.
How BITDPS Profits in This Environment
At BITDPS, we don’t rely on “crystal ball” predictions. Instead, we use AI—including models like ChatGPT—for market interpretation, paired with our proprietary:
Quantitative trading algorithms
High-frequency execution models
Sentiment-driven strategy modules
These systems allow us to react in milliseconds to changes in volatility, liquidity, and trend direction. ChatGPT may offer insight, but BITDPS executes — fast, efficiently, and profitably.
Whether Bitcoin goes up or down, our AI-enhanced infrastructure identifies and acts on profitable opportunities, including arbitrage, momentum trades, and volatility spreads.
The Bottom Line
ChatGPT can’t predict the future — but it can help understand it. At BITDPS, we leverage that understanding, combine it with live data and automation, and turn it into profit. For traders and institutional clients looking to bridge AI insights with real market action, BITDPS delivers where theory meets execution.

S&P 500 (CASH 500) SHORT - Double top H8Risk/reward = 4.1
Entry price = 6343.3
Stop loss price = 6365.3
Take profit level 1 (50%) = 6268.1
Take profit level 2 (50%) = 6232.1
Still waiting on some variables on checklist to be confirmed before I enter the trade.

NASDAQ (CASH100) SHORT - Head and shoulders H1Risk/reward = 3.8
Entry price = 23 167.9
Stop loss price = 23 232.8
Take profit level 1 (50%) = 22 943
Take profit level 2 (50%) = 22 878
Still waiting on confirmation on some variables in checklist

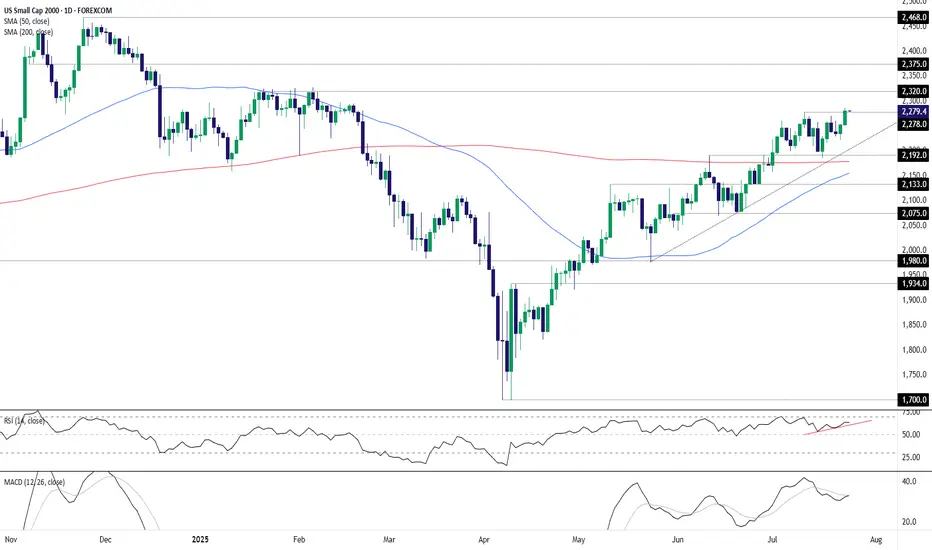
U.S. Small Caps Break Out: Dash for Trash Gathers SteamSitting in an obvious uptrend with momentum indicators skewing increasingly bullish, it looks like the U.S. small cap 2000 contract wants to go higher. The dash for trash is on!
Having just cleared the July 10 high of 2278, it’s provided a decent setup to initiate fresh longs, allowing for a stop beneath that level for protection against a reversal.
2320 screens as an initial target given the contract consistently struggled to break above it earlier this year. Beyond that, 2375 and the record high of 2468 are the levels to watch.
Good luck!
DS
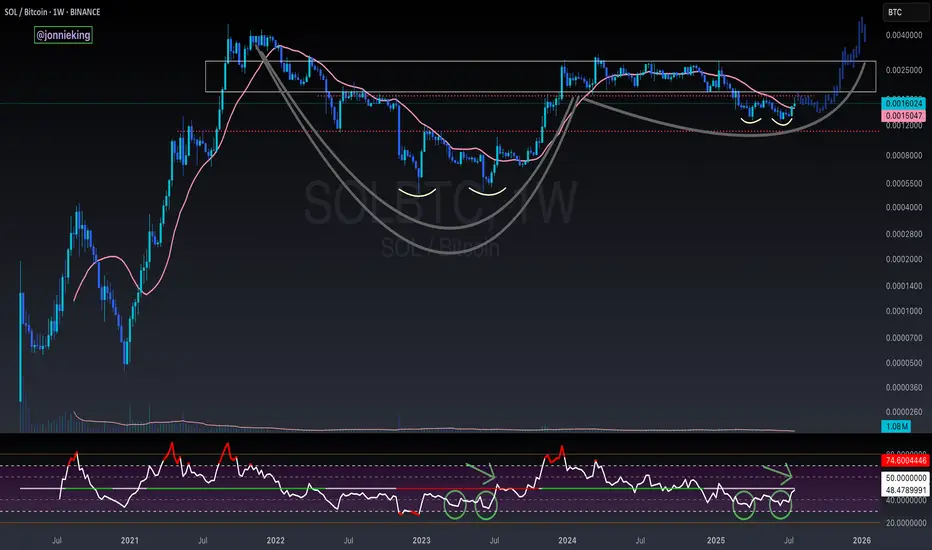
SOL / BTC Cup and Handle Weekly ChartBeautiful cup and handle on the SOL / BTC Weekly chart.
Need to break above the neckline and reclaim the POI.
Double bottom on the RSI matches just before the rip in July 2023.
Potential 9% move in DEGENUSDAs can be seen with the Dual TF strategy, there is a potential for a 9% move in DEGEN for the following reasons:
1. Long term (5HR) and short term (1HR) charts are showing that DEGEN is overextended to the downside (yellow dots using custom Data Distribution indicator), which means that there is a potential for the price to reverse back up. The fact that there is confluence between the two charts is a good sign.
2. Custom indicator Zero-Lag USI is showing that the background has changed from red to black, meaning that there is a potential change in momentum here and that the price can potentially reverse back up.
3. Long-term chart is showing a reversal candle which is another sign that there is a potential reversal here.

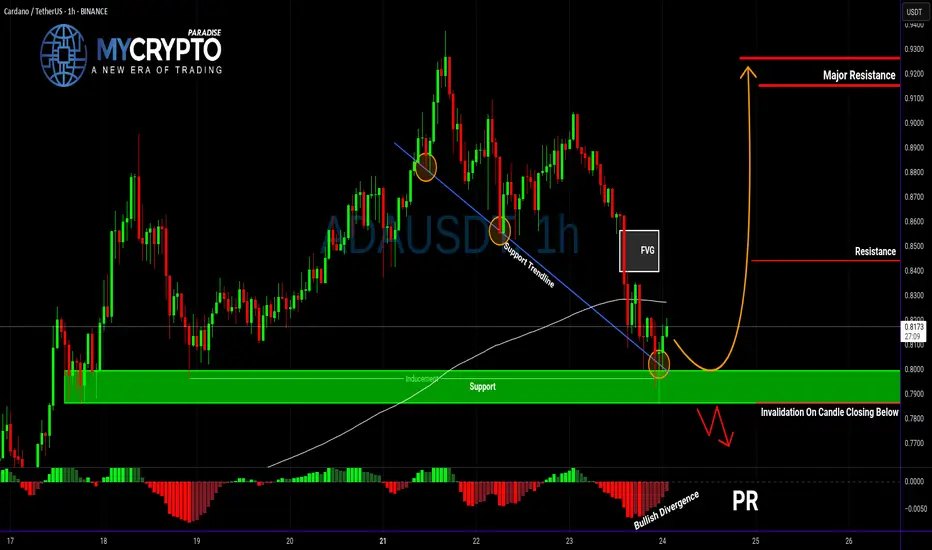
ADA About to Explode or Collapse?Yello Paradisers — is ADA gearing up for a breakout, or are we walking straight into a bull trap? After the recent pullback, the market is throwing mixed signals, but this setup is becoming too important to ignore. Here’s what we’re seeing right now on ADAUSDT.
💎ADA is currently showing positive signs of strength after a solid retracement. Current support zone is not only a historical price pivot, but it's also aligned with a supportive trendline, the 200 EMA, and a developing bullish divergence on the chart. All these factors combined are increasing the probability of a short-term bounce — but that doesn't mean we go in blind.
💎For aggressive traders, entering at the current price might make sense, especially if you’re targeting the first resistance level. However, it’s important to note that this entry offers a relatively limited reward compared to the risk — roughly a 1:1 risk-reward ratio — so it’s crucial to size your position accordingly and keep tight control over your stop loss.
💎If you're looking for a cleaner setup with a better risk-to-reward profile, patience is key. A more favorable scenario would be waiting for a proper pullback and a confirmed retest of the support zone. Ideally, you want to see a strong bullish candle at the support level to signal continuation — that’s when the setup shifts from average to high-probability.
💎But be cautious. If the price breaks down and closes a candle below our support zone, the entire bullish idea becomes invalid. In that case, it’s much wiser to step back and allow the market to develop more structure before re-engaging. Forcing trades in uncertain conditions is where most traders lose, and we don’t want to be part of that crowd.
🎖Strive for consistency, not quick profits. Treat the market as a businessman, not as a gambler. Be patient, Paradisers — only those who follow structured strategies and risk management will thrive in the long run.
MyCryptoParadise
iFeel the success🌴