"These 3 power signals boost the 3-step rocket booster strategy"Am lubosi forex and i would like to welcome you.This is where i share with you technical analysis strategies.
I started trading in 2017 and learning about it has not been easy.My hope for you is that this channel will shape your trading journey and help you
Find a path to making money on your own terms.
In this video am showing you the rocket booster strategy
using 3 indicators and catalysts as follows:
1-Volume Oscillator
2-MACD Indicator
3-Earnings Report Catalyst
These 3 power signals boost
the 3-step rocket booster strategy
Watch this video
to learn more
Disclaimer:Trading is risky please use a simulation trading account before you trade with real money
also learn risk management and profit taking strategies.
Oscillators

USDT.D — 1W FVG Test & RSI Bull Div | Caution for RiskUSDT Dominance is testing a major 1W FVG support area while developing bullish divergences on the 4H RSI. Although a short-term bounce and market correction are likely, the overall bullish trend in BTC means a sharp reversal is not guaranteed. Risk management is a priority here — no high-risk positions until the RSI resets and market context is clearer.
1W FVG support + 4H RSI bull div
Bounce likely = correction on risk assets
RSI needs reset to 50 before reassessing
If lost — risk-off, possible slice down
Reasoning: Support + momentum, but trend is bullish — not risking gains here

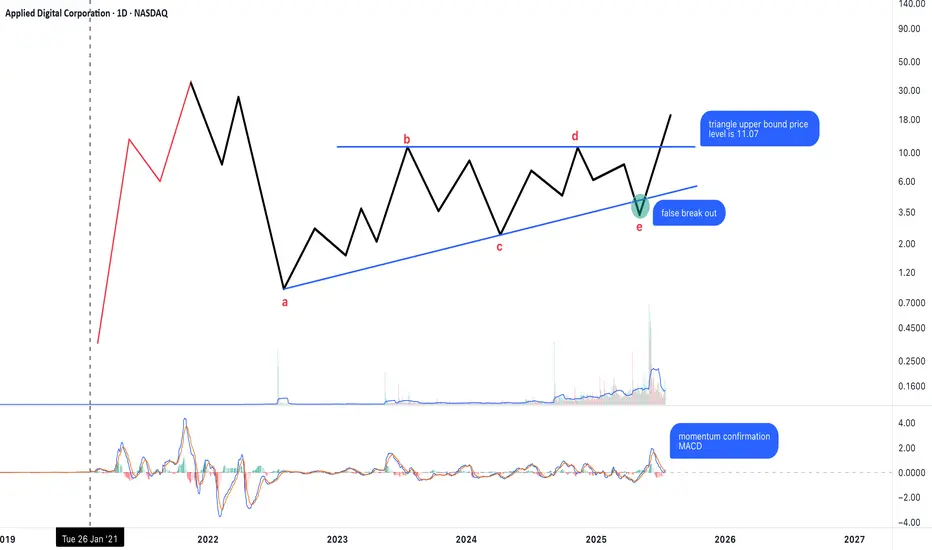
Possible Neutral Triangle Breakout – Key Level at 11.07The chart appears to show a completed neutral triangle (a–b–c–d–e), with a breakout emerging above the upper boundary at 11.07.
Wave a looks like a complex structure (possibly elongated flat or flat + zigzag).
The rest of the legs are mostly zigzag forms, consistent with triangle rules.
False breakdown below wave e followed by a strong reversal.
MACD is confirming momentum during the breakout attempt.
As long as price stays above 11.07, this breakout may be sustained. If confirmed, the next target zone could align with the height of the triangle projected upward.
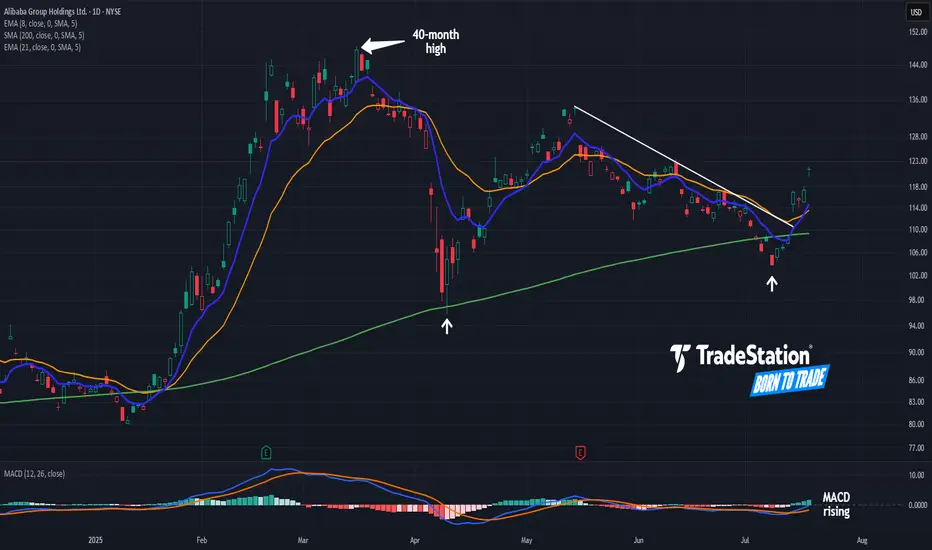
Alibaba Breaks a TrendlineAlibaba began 2025 with a big rally. Now, after a long pullback, some traders may see further upside in the Chinese tech giant.
The first pattern on today’s chart is the pair of higher lows (marked with white arrows) along the rising 200-day simple moving average. Those may reflect the development of a longer-term uptrend.
Second, BABA peaked above $148 in March. It was the highest price since November 2021. That may suggest a long-term downtrend is fading.
Third is the series of lower highs in May and June. The stock broke that falling trendline this week, a potential sign of improving price action in the short term.
Next, MACD is rising and the 8-day exponential moving average is nearing a potential cross above the 21-day EMA. Those could be viewed as further positive short-term signals.
Finally, BABA is an active underlier in the options market. (Volumes have averaged more than 200,000 contracts per session in the last month, according to TradeStation data.) That may help traders take positions with calls and puts.
TradeStation has, for decades, advanced the trading industry, providing access to stocks, options and futures. If you're born to trade, we could be for you. See our Overview for more.
Past performance, whether actual or indicated by historical tests of strategies, is no guarantee of future performance or success. There is a possibility that you may sustain a loss equal to or greater than your entire investment regardless of which asset class you trade (equities, options or futures); therefore, you should not invest or risk money that you cannot afford to lose. Online trading is not suitable for all investors. View the document titled Characteristics and Risks of Standardized Options at www.TradeStation.com . Before trading any asset class, customers must read the relevant risk disclosure statements on www.TradeStation.com . System access and trade placement and execution may be delayed or fail due to market volatility and volume, quote delays, system and software errors, Internet traffic, outages and other factors.
Securities and futures trading is offered to self-directed customers by TradeStation Securities, Inc., a broker-dealer registered with the Securities and Exchange Commission and a futures commission merchant licensed with the Commodity Futures Trading Commission). TradeStation Securities is a member of the Financial Industry Regulatory Authority, the National Futures Association, and a number of exchanges.
Options trading is not suitable for all investors. Your TradeStation Securities’ account application to trade options will be considered and approved or disapproved based on all relevant factors, including your trading experience. See www.TradeStation.com . Visit www.TradeStation.com for full details on the costs and fees associated with options.
Margin trading involves risks, and it is important that you fully understand those risks before trading on margin. The Margin Disclosure Statement outlines many of those risks, including that you can lose more funds than you deposit in your margin account; your brokerage firm can force the sale of securities in your account; your brokerage firm can sell your securities without contacting you; and you are not entitled to an extension of time on a margin call. Review the Margin Disclosure Statement at www.TradeStation.com .
TradeStation Securities, Inc. and TradeStation Technologies, Inc. are each wholly owned subsidiaries of TradeStation Group, Inc., both operating, and providing products and services, under the TradeStation brand and trademark. When applying for, or purchasing, accounts, subscriptions, products and services, it is important that you know which company you will be dealing with. Visit www.TradeStation.com for further important information explaining what this means.
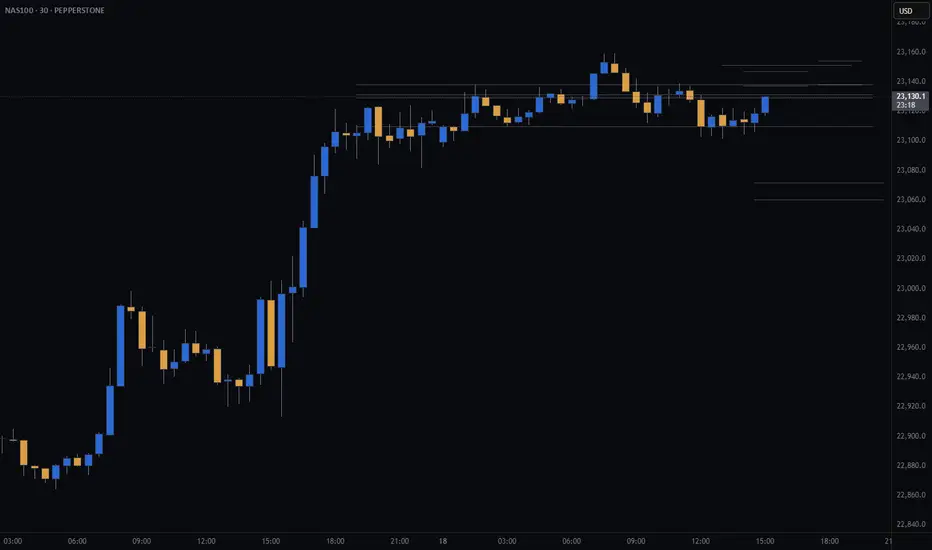
NAS100 (CASH100) SHORT - head and shoulders 30minRisk/reward = 3.9
Entry price = 23 137.9
Stop loss price = 23 153.9
Take profit level 1 (50%) = 23 071
Take profit level 2 (50%) = 23 060
Still need to validate a few variables.
Lets goooooo
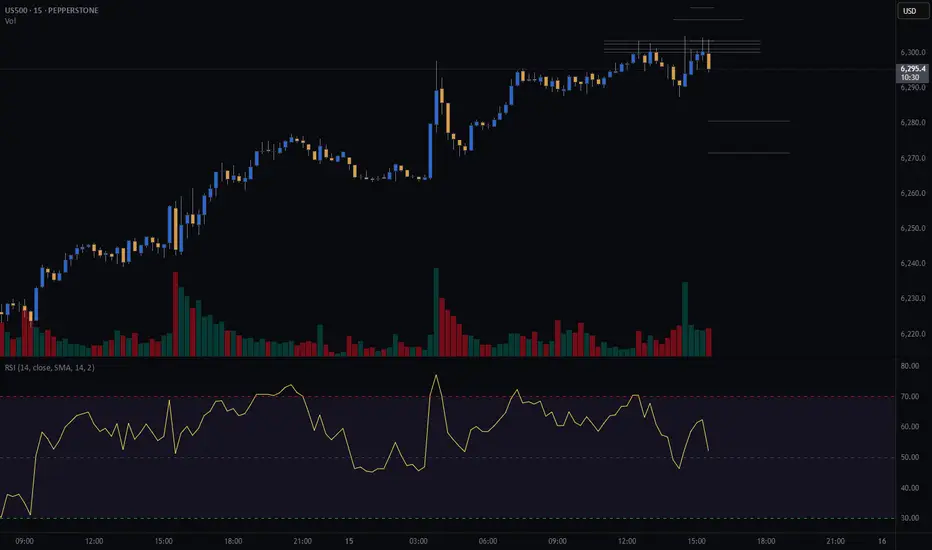
S&P500 (CASH500) (SPX500) SHORT - Head and shoulders 30minRisk/reward = 3.3
Entry price = 6314.8
Stop loss price = 6318.4
Take profit level 1 (50%) = 6301.3
Take profit level 2 (50%) = 6297.5
Waiting on validation from a few other variables.
For example, waiting for the current 30min candle to close in range.
Letssss goooooo

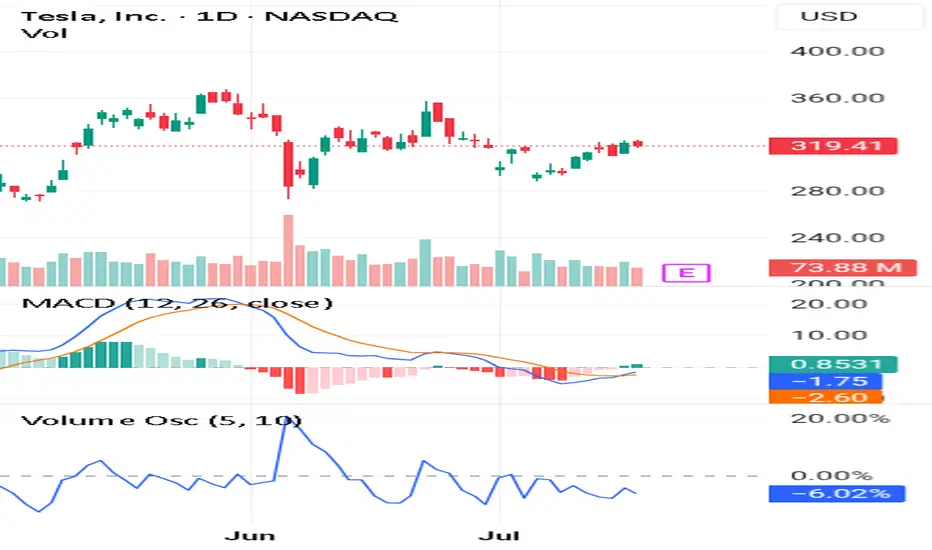
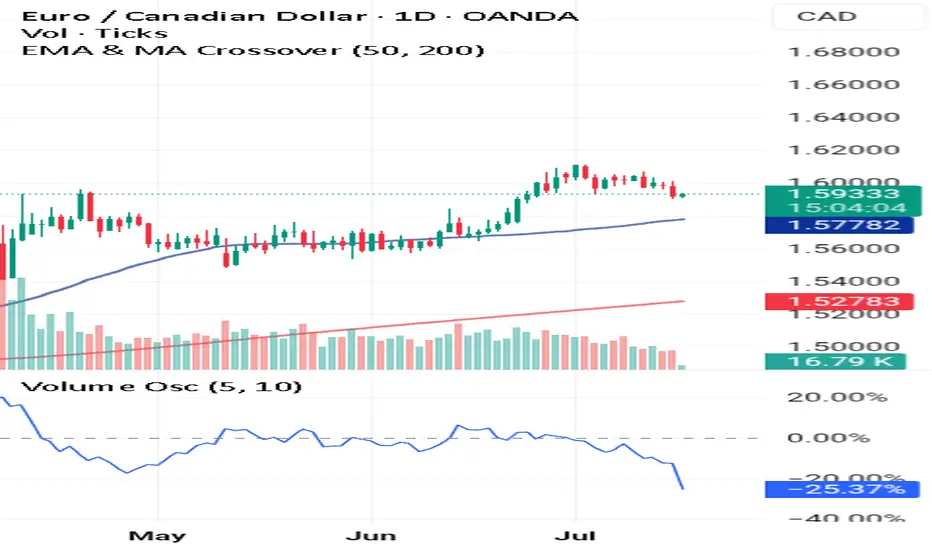
(Learn More)Use These 3 Steps To Spot Long-Lasting Trends👉Trade before the earnings report
👉Make sure the volume oscillator is below zero
👉Make sure the MACD lines give you a Bullish signal
If you look at this chart you can see all the steps alignment.
This is very important because you want to catch a long term trend.
Also it has to follow the 3step rocket booster strategy.
In order for you to learn more about this strategy 🚀 Rocket Boost This Content.
Disclaimer ⚠️ Trading is risky please learn how to use Risk Management And Profit Taking Strategies. Also feel free to use a simulation trading account before you use real money.
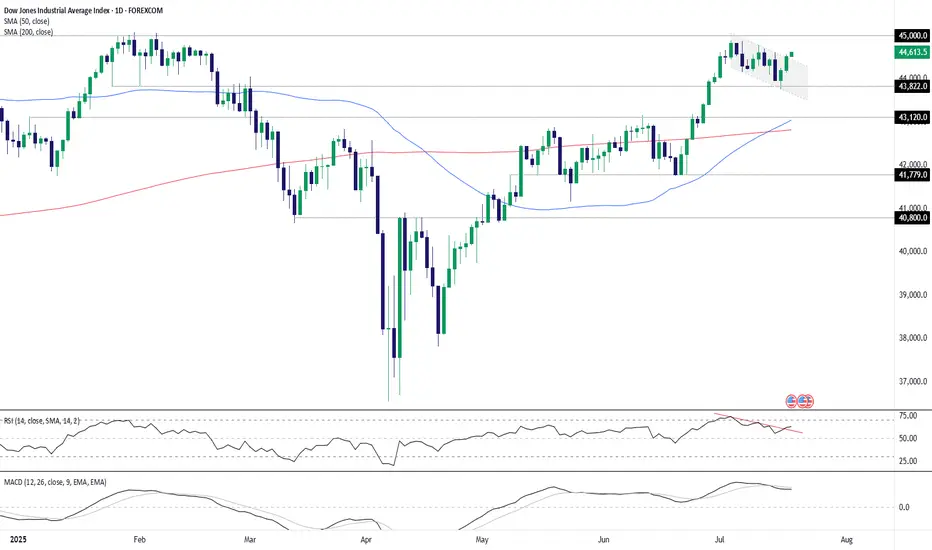
Dow Eyes 45000 After Bullish BreakoutThe U.S. 30 contract has broken topside from a short-term bull flag, reinforcing the broader uptrend and putting 45000 resistance back in focus.
Traders looking to play a continuation can consider longs with a tight stop beneath for protection. A break of 45000 may trigger a fresh burst of upside momentum, putting big figures above in play.
Bullish price momentum is also building again, adding to the case for upside.
Good luck!
DS
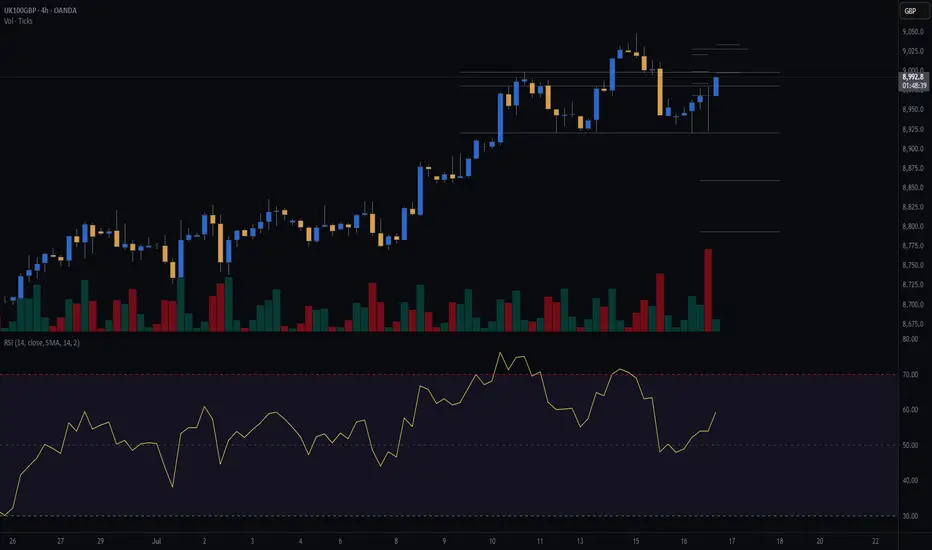
UK100 short - head and shoulders H4Risk/ reward = 4.6
Entry = 8 998.5
Stop loss = 9 034.2
Take profit level 1 = 8 859.8
Take profit level 2 = 8 794
Still need confirmation,
Waiting for H4 candle to close at 23.00 and will need to validate volume.
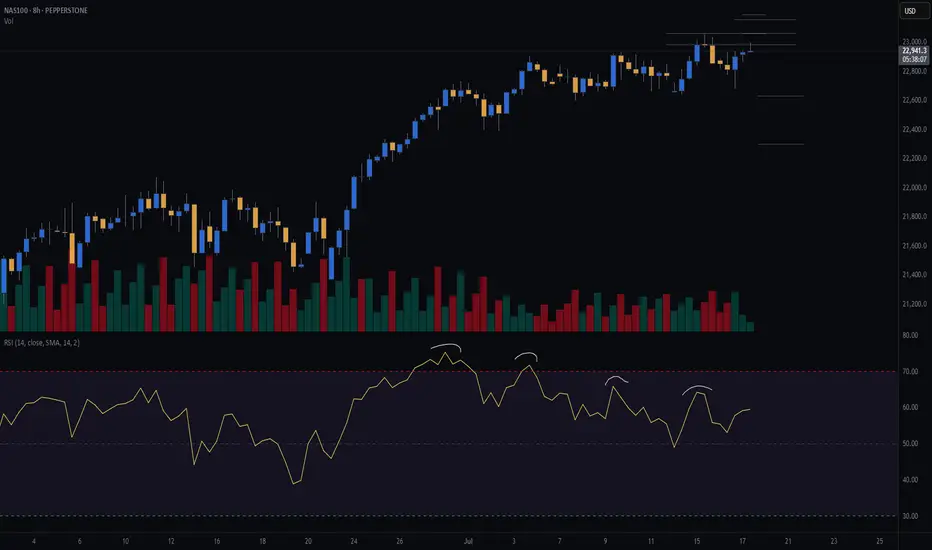
NAS100 (CASH100) SHORT - Double Top H8Risk/reward = 4.6
Entry price = 23 063
Stop loss price = 23 190
Take profit level 1 (50%) = 22 635
Take profit level 2 (50%) = 22 303
Still waiting for confirmation on some variables.
For example, need H8 candle to close in range and volume to validate, amongst other variables.
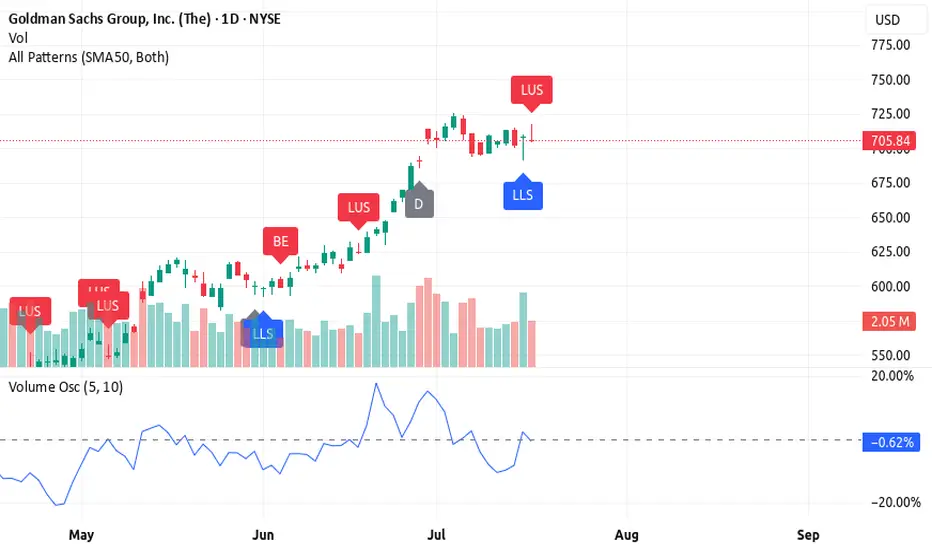
3 Reasons Why Goldman Sachs (GS) Still Looks Bullish🚀 3 Reasons Why Goldman Sachs (GS) Still Looks Bullish (Despite a Bearish Candle)
Goldman Sachs is in a bullish trend, but the latest candlestick is flashing a warning. Here's why GS still looks strong — and what to watch for next 📈
1️⃣ Candlestick pattern – long upper shadow
The long upper shadow shows sellers pushed the price down from the highs, signaling resistance. While bearish short-term, it often happens during strong trends as the market breathes before pushing higher.
2️⃣ High volume on a bearish candle
The negative volume shows resistance, but it may actually represent bear exhaustion. High volume without a breakdown
suggests bears tried to push it down — and failed. Classic fake-out.
3️⃣ Volume oscillator still rising
Despite the pullback candle, the volume oscillator is holding above zero and trending up, showing momentum is still on the bulls' side.
🔥 Rocket Booster Strategy still intact
✅ Price above 50 EMA
✅ Price above 200 EMA
⚠️ Just a temporary shakeout? If the next candle confirms support, GS may continue the bullish push.
⚠️ Disclaimer: Always use a simulation (demo) account before trading with real money. Learn proper risk management and profit-taking strategies to protect your capital.
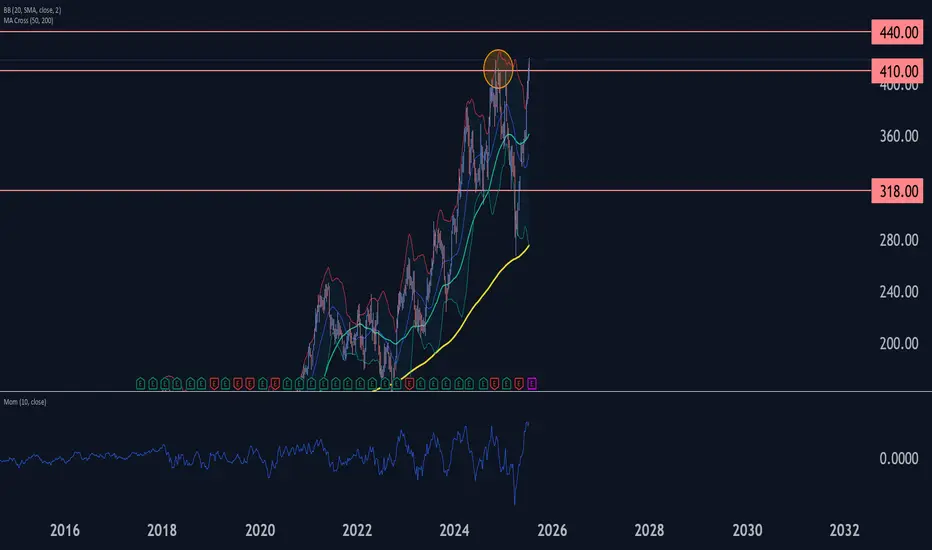
Caterpillar Wave Analysis – 17 July 2025
- Caterpillar broke long-term resistance level 410.00
- Likely to rise to resistance level 440.00
Caterpillar recently broke above the major long-term resistance level 410.00, which has been reversing the price from the end of 2024, as can be seen from the weekly Caterpillar chart below.
The breakout of the resistance level 410.00 accelerated the active intermediate impulse wave (C) from the middle of 2025.
Given the overriding weekly uptrend and the accelerating weekly Momentum, Caterpillar can be expected to rise to the next resistance level 440.00 (target for the completion of the active intermediate impulse wave (C)).
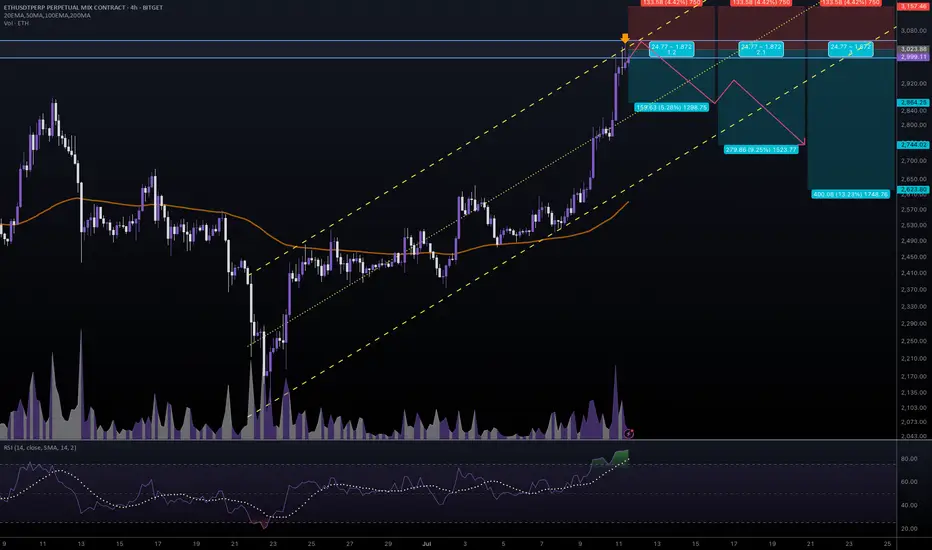
#ETHUSDT #4h (Bitget Futures) Ascending channel on resistanceEthereum printed a gravestone doji followed by a shooting star, RSI is overbought, local top seems in.
⚡️⚡️ #ETH/USDT ⚡️⚡️
Exchanges: Bitget Futures
Signal Type: Regular (Short)
Leverage: Isolated (9.0X)
Amount: 5.0%
Entry Zone:
2996.99 - 3050.49
Take-Profit Targets:
1) 2864.25
2) 2744.02
3) 2623.80
Stop Targets:
1) 3157.46
Published By: @Zblaba
CRYPTOCAP:ETH BITGET:ETHUSDT.P #4h #Ethereum #PoS ethereum.org
Risk/Reward= 1:1.2 | 1:2.1 | 1:3.0
Expected Profit= +47.5% | +83.3% | +119.0%
Possible Loss= -39.8%
Estimated Gaintime= 1-2 weeks
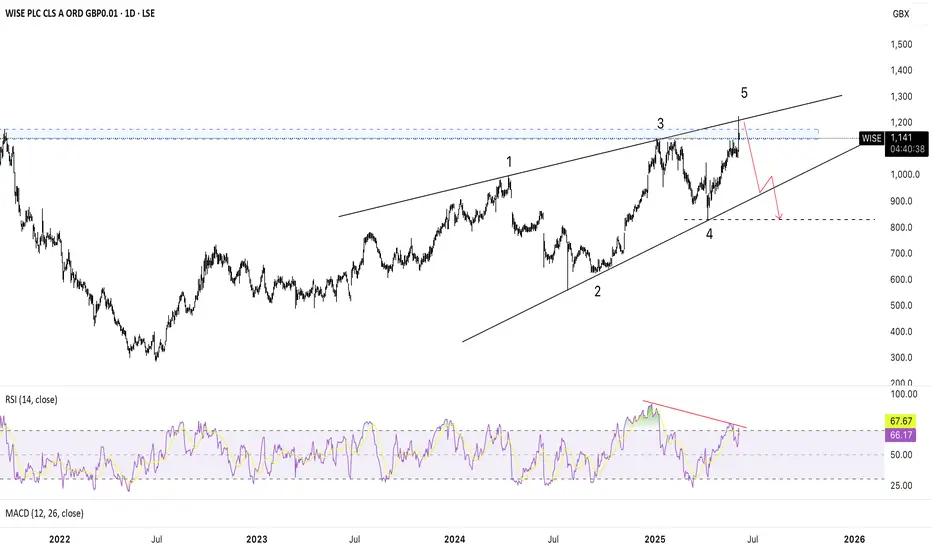
Short WISE as leading diagonal has been completedWISE can be shorted with the first target at the lower edge of the diagonal and then, at around 800 pence (start of wave 5), if move lower confirmed.
Clear RSI divergence shows trend reversal in the short-term at least (until touching lower band of the diagonal). So the lowest upside is around 14-16% here.
SL can be set to 1230 pence.
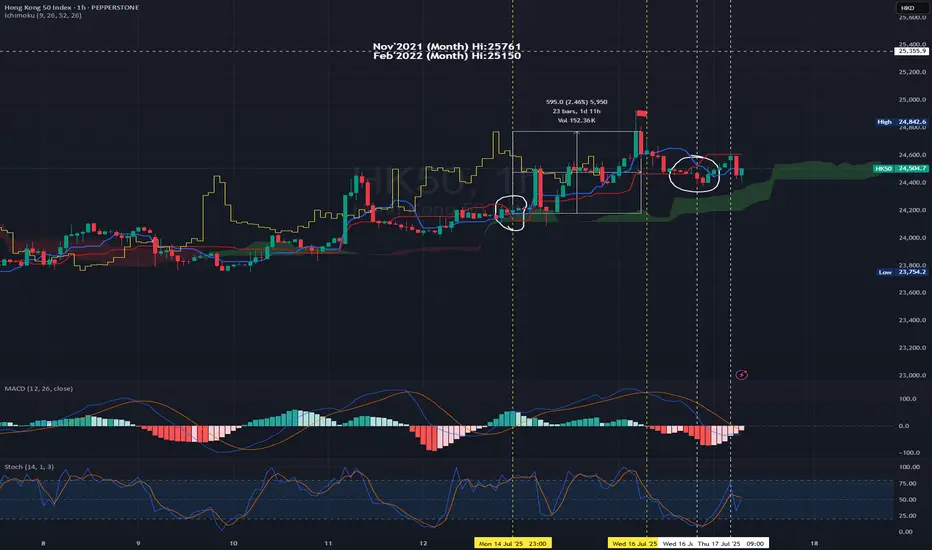
Dont predict&anticipate the market - ask indicators for hints! Hello everyone! how was the HSI trade so far?
Apologies for not updating as I was allowing myself to take a pause journaling my trade also to pay attention on my own personal growth journey. However, am continue to trade HSI in sustainable and profitable way and have had trying and test using different combination of indicators that bring quite positive results since.
Sharing this with anyone that reading this.
Please note that this is just for my own experiences and please DYODD.
For Swing Trade Test: (some steps to consider for entry set up - setting your time frame)
E.g using 1H Chart - 14Jul2025 23:00
MACD - entering the above zero line - it breaks above zero level on the next candle. Turned bullish confirmation.
Using Ichimoku Cloud for trend confirmation.
Once the MA9>MA26 the blue line crosses above red line (circled in white). This is a bullish confirmation and it is trading above green cloud.
You may pay attention to set your entry point.
Set Up : on the next candle open - you may open Long position - 24204.90 Set SL with R/R Ratio 1:1 or 1:1.1-1.25 (or in accordance to your risk appetite or carry out backtest and to be realistic)
Taking Profit : You may pay attention to be more aggressive to TP only when the MACD is forming DeadCross i.e 16Jul2025 11:00 (using the same timeframe chart).
For the reversed side it's the same methodology. But it's recommended to Short if and only if when the candles are closed below cloud + MACD is on the bearish zone.
So, in this case, I will not open short position as it's not the normal underlying HSI trading hour, so we wait till the underlying normal trading hour commence.
Today HK50 PEPPERSTONE:HK50 open at 24567, you may decide if you would to short and setting SL and TP.
From chart, you may open short position with R/R : 1.1.1 (TP : 24:400; SL : 24772) Entry: 24596 (the next hour candle at 10:00, of course you may cross check with shorter time frame to 'catch the high' 😂)
Trade for profit requires persistency and consistence.
There is quite a wide range to trade in between the movement.
Buy into Support Sell at resistance.
Set your TP/SL & protect your capital.
at point of writing ✍️: the Index uptrend mode is on track.
currently on D Chart -
🗝️ Resistance Level : 24600-24700
🗝️ Support Level : 24370-24400
🗝️ Strong Support Level : 24030-24300
Higher Hi🚩point marked in Chart
21May2025 -23909
11June2025 -24430
25June2025 -24531
16Jul2025 - 24842
?? ??2025 - 25907 Target
Opinion: continue Bullish and shall breaks the recent Hi of 24900 and target could break 25200-25750 pretty soon (the Gravity Line upper band).
The Index is now on the intermediate bullish trend (not far off from Gravity line and not yet touch the Gravity Upper band or beyond for D chart) - Shall publish this indicator.
From previous posts:-
W Chart:- HSI continues its Bullish mode with strong pullback! Recovery could expected to see in end Jun - early Jul'25.
14Jul2025 -
at point of writing ✍️:
Perhaps it shouldn't been said as recovery but continue the uptrend.
As we can notice from the latest chart it seems to continue its uptrend momentum even MACD have had curving down after deadcross formed 12May25.
The MACD signal line staying above zero level.
Continue the Long call for HSI with the forecast and repetitive of history the next 4-6 weeks might be a good profit to hold Long position.
🚨However, please take note that the index is moving beyond the Gravity upper brand on W chart which we should monitor closely to TP and enter again for healthy retracement.
🎯 Reminder: For long term (6-18 months) continue to accumulate China & HKG for the potential upside for the year! All retracement is a good entry point. Again, everything is impermanence. Manage your risk, position sizing. Take only the risk that you can afford.
For HSI HSI:HSI
Recent Hi : 16Jul2025 - 24867.81 (trying to test the resistance at 19March2025@24874)- this ¬6.58pts seems took quite a while to break. Let's be patience.
🔎 DYODD and don't listen to anyone.
Invest in yourself, do some study and learn along the way while you trying to verify or finding the answer if to start invest in CHN/HKG markets.
If you don't know how or where, you may ask Deepseek/Chatgpt for most reputable Trading courses nearest to you.
Let's follow your own zentradingstrategy , continue to trade; a strategy is a raft—cross the river, but do not carry it on your back forever — Stay flexible. No method is permanent. Adapt, let go, grow.
** Please Boost 🚀, FOLLOW ✅, SHARE 🙌 and COMMENT ✍ if you enjoy this idea!
Share your trading journey here to encourage the community and friends who pursing the same journey.
CHF/JPY Reversal brewing?Is the high-flying CHF/JPY cross about to hit an air pocket? Having printed a bearish engulfing candle on Wednesday, and with bearish divergence between RSI (14) and price while still in overbought territory, the risk of a pullback appears to be growing. MACD is also curling over towards the signal line, hinting that bullish momentum is waning.
Should the price break and hold beneath 184.50, shorts could be established with a tight stop above the level for protection. 183.39 screens as an initial target, coinciding with the low struck on July 11. If it gives way, it could open the door to a deeper unwind towards 181.85, a level that acted as both support and resistance in recent months.
If the price resumes its uptrend and takes out the current record high above 186.00, it would invalidate the near-term bearish bias.
Good luck!
DS

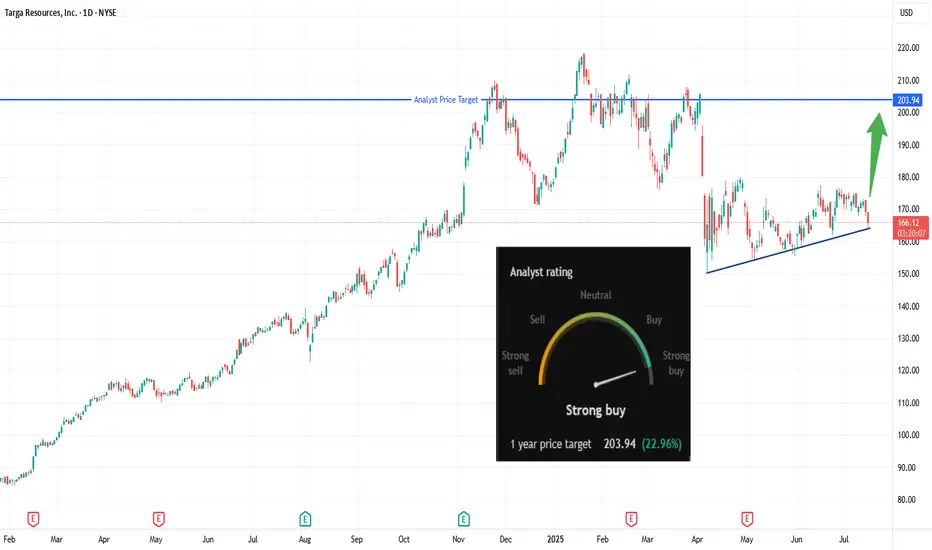
Breakout Brewing: Is TRGP About to Explode?🔹 Trade Summary
Setup:
Ascending triangle forming over several months
Price consolidating near major resistance
Strong analyst buy rating with 1-year target at $203.94
Entry:
Buy on daily close above $169.42 (breakout trigger)
Stop-loss:
Below $159 (invalidate the setup)
Targets:
$203.94 (analyst target / recent highs)
Risk/Reward:
Approx. 1:3.5 (risking ~$10 for ~$34 gain)
🔹 Technical Rationale
🔹 Ascending triangle pattern suggests bullish continuation
🔹 Flat resistance at $169.42 now being challenged
🔹 Daily timeframe, recent higher lows showing building pressure
🔹 Catalysts & Context
🚦 Analyst “Strong Buy” rating with 1-year upside potential of +22.96%
🛢️ Energy sector momentum, especially in midstream & LNG plays
📰 Potential earnings/corporate updates could drive breakout
🔹 Trade Management Plan
Entry: Buy only on daily close above $169.42
Stop-loss: Below $159 — trail up if price closes above $180
Scaling: Take partial profits at $185, remainder at $203.94 (target)
What’s your view? Are you watching NYSE:TRGP ? Comment below or vote:
🔼 Bullish
🔽 Bearish
🔄 Waiting for confirmation
🔹 Disclaimer
Not financial advice. Trade at your own risk.
*** Don't forget to follow us for more trade setups ***
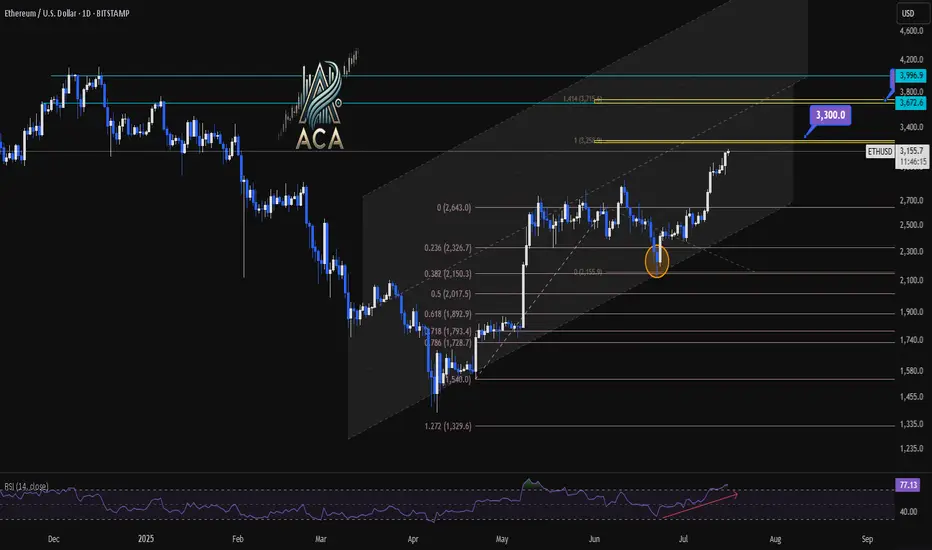
ETHUSDT 1D Chart Analysis | RSI Strength & Fibonacci TargetsETHUSDT 4H Chart Analysis | RSI Strength & Fibonacci Targets in Play
🔍 Let’s break down the latest ETH/USDT setup — bullish momentum is building with confluences pointing toward key upside targets.
⏳ 4-Hour Overview
Ether continues climbing within a well-defined ascending channel, with recent candles holding above mid-level support. Price is pressing higher from a clean bounce at the 0.5 and 0.618 Fibonacci retracement zone ($2,017–$1,899), signaling the correction has likely ended.
📉 Fibonacci Levels & RSI Confirmation
- The strong recovery aligns with rising volume and a bullish structure.
- RSI is pushing into overbought territory (above 73), often a sign of strength during trends—not exhaustion.
- ETH is now positioned for a breakout continuation move if momentum holds.
🎯 Bullish Targets Ahead
- Immediate resistance: $3,300 (1.414 Fib extension + historical supply)
- Next major target: $3,700 (1.618 extension + upper channel confluence)
- Pullback zones: $2,950 (mid-channel) and $2,017 (Fib support base)
📊 Key Highlights:
- Price is respecting the rising channel structure — higher lows, higher highs in play.
- Volume supports the breakout narrative, rising on green candles.
- RSI breakout supports trend continuation, not exhaustion.
- Targets at $3,300 and $3,700 remain actionable on a confirmed breakout.
🚨 Conclusion:
ETH is showing a multi-variable bullish setup with clear continuation potential. A strong move above $3,300 could quickly send price toward $3,700. Pullbacks to $2,950–$2,017 could offer high-risk/reward re-entry zones. Momentum favors bulls — stay alert.
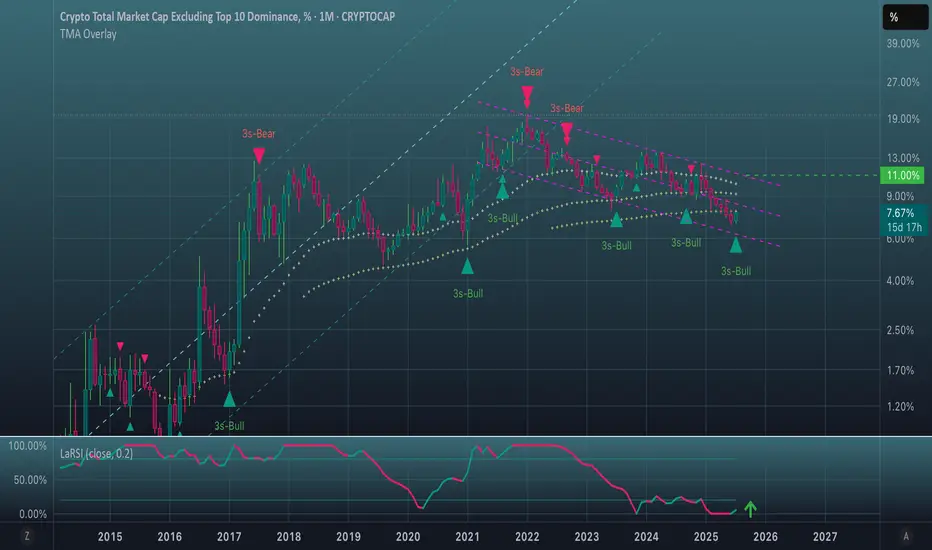
It's high time to make the header optional.Maybe there's a good chance.
OK, LaRSI on the monthly chart shows that the share of alts could rise significantly.
But there is a bullish correlation with bullish sentiment in the stock market.
However, the candle has gone below the 100 SMMA for the first time.
But at the same time a bullish momentum is forming at this point.
I suggest waiting for the end of the month.
*******************************************************************
But real strength can only be demonstrated
if the candles break out of this channel. Where they are now.
The 10.7%-11% level will be critical.
As usual, no need to call anyone on anything.
Trends Report#1:Learn How To See Bullish Chart Patterns It's been a wild week.As I am strategy building.
So far I have about 3 solid trading strategies.
Then I have two more pending to learn more.
My dream as a man has always been to learn how to make money.
Staying in the financial markets because I went to college to study information and technology.
In my academic studies there was nothing close to what I learned on trading.
Financial technology software development is what I have decided to study as an academic pursue.
The education system is broken.
Look at this chart.
☝️The price is above the 50 EMA
☝️The price is above the 200 EMA
☝️The price has reversed on a Bullish Harami Candlestick pattern .
This reversal is confirmed by both the positive volume + volume oscillating tool.
To learn more 🚀 Boost This Content
Disclaimer ⚠️ Trading is risky please learn Risk Management And Profit Taking Strategies.Also feel free to use a simulation trading account before you use real money.
USD/JPY: 148.70 cleared as yields and momentum alignAided by the latest leg higher for U.S. Treasury yields following the June U.S. inflation report, USD/JPY closed at the highest level since April on Tuesday, taking out the important 148.70 level in the process. If the pair manages to consolidate the break on Wednesday ahead of separate U.S. PPI data for June, the level may revert to offering support, providing a platform for new long positions to be established with a stop below for protection.
The 200-day moving average is the first major hurdle for bulls to overcome, sitting today at 149.63. If it were to be taken out, it would only add to the bullish price action seen recently. Above, 150 will naturally receive some attention given it’s a major big figure, although there’s little visible resistance until 151.00.
If USD/JPY were to reverse back below 148.70 and close there, it would provide bulls with some food for thought, opening the door for a potential retest of the uptrend the pair has been sitting in since the start of July. However, the message from momentum indicators like RSI (14) and MACD is firmly bullish. With the 50-day moving average also starting to curl higher, near-term price momentum is definitely with the bulls, favouring buying dips in this environment.

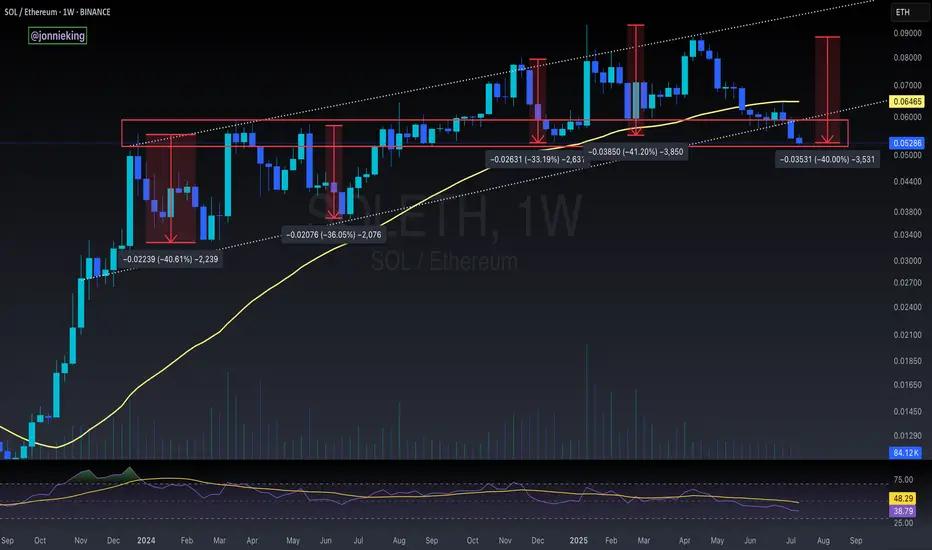
SOL / ETH at Critical Inflection PointSOL / ETH loses the 50WMA.
Has been trading below it for the past 7 weeks, something we haven't seen since 2021.
Has also broken down from the 8 month bull flag / parallel channel. Retesting the key POI I've been eyeing.
HOPIUM: We've seen great rallies after CRYPTOCAP:SOL goes down ~40% vs CRYPTOCAP:ETH , which it is at now. We SHOULD see a turnaround here soon.
And I still believe SOL will greatly outperform ETH this cycle, especially when the ETF launches and Alt Season kickstarts.
Right now we're seeing a typical market cycle BTC > ETH > Large Caps > Mid Caps > Micro Caps
S&P500 (CASh500) Short - double top 15minEntry = 6303.4
SL = 6312.8
Take profit level 1 = 6280.7
Take profit level 2 = 6271.6