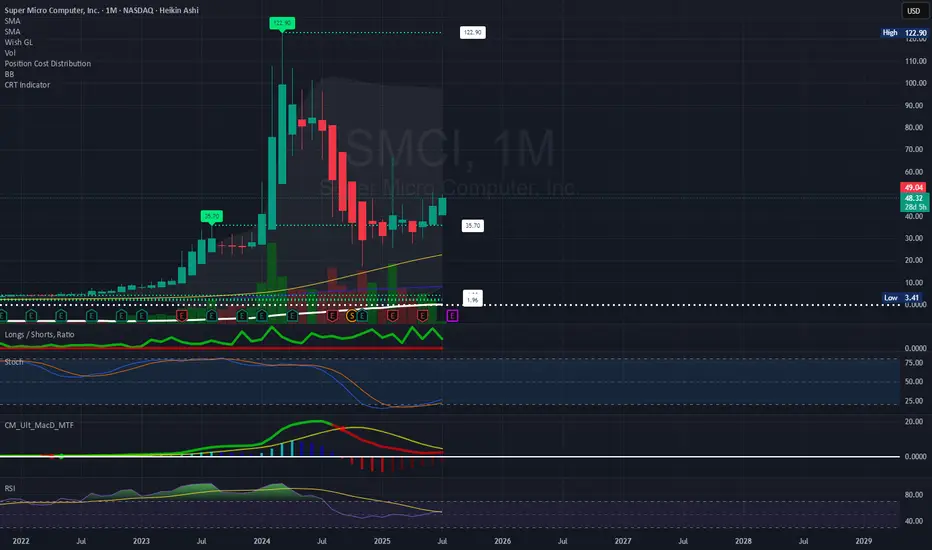
SMCI: The Monthly Chart says it ALL
Stochastic is way oversold.
MACD is converging.
RSI is converging back up.
Would not be surprised to see this soar back towards the CRT value of $65, then take on new challenges back towards it previous ATH of $122.90 in March, 2024.
Regards,
Terrapins
Oscillators
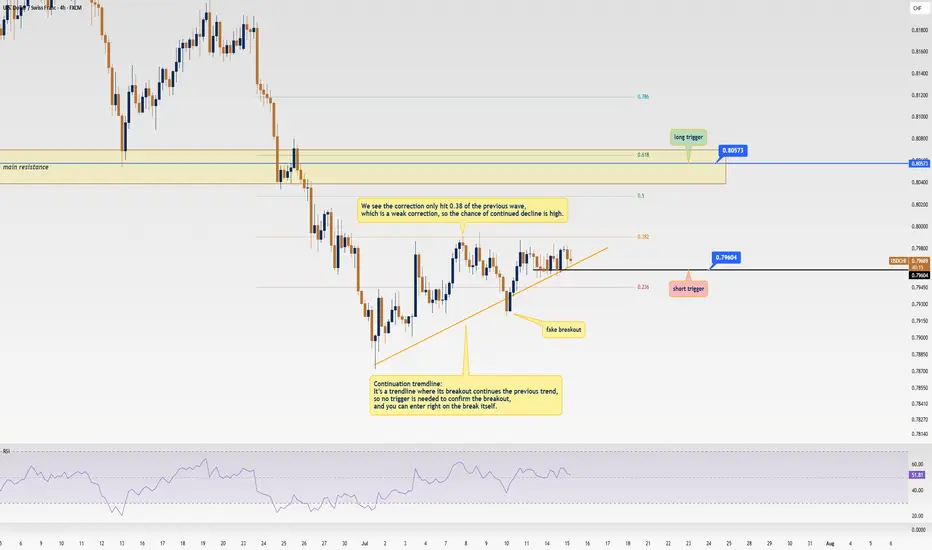
USD/CHF Update: Killer Short Trigger Ready to Pop!Welcome back, traders, it’s Skeptic from Skeptic Lab! 😎 We’ve got a juicy short trigger on USD/CHF that could deliver serious profits if it fires. Stay with me till the end to nail this trade! Let’s dive into the Daily and 4-hour timeframes for the full picture. Currently at $0.79671, here’s the play:
✔️ Daily Timeframe:
We’re in a rock-solid bearish major trend . After hitting a high of $ 0.84649 , we broke the key support at $ 0.80573 , resuming the bearish trend. A pullback to the broken $ 0.80573 level is likely, as it aligns with the 0.6 Fibonacci retracement from the prior 4-hour wave. Trading with the trend is smartest, so shorts are the focus. If you want to long, go with lower risk and close positions faster.
📊 4-Hour Timeframe (Futures Triggers):
Short Trigger: Two options here. Either enter on a trendline break (no extra trigger needed, as continuation trendlines mean the prior trend resumes on a break), or, for a safer play, short on a break of support at $ 0.79604 —this needs minimal confirmation.
Long Trigger: Wait for a break of the resistance zone at $ 0.80573 . Confirm with RSI entering overbought. Check my RSI guide ( link ) for how I use it differently—game-changing stuff!
📉 Key Insight: Stick to the bearish trend for higher-probability trades. Shorts at $0.79604 or on a trendline break are your best bet.
🔔Risk management is your lifeline—cap risk at max 1%–2% per trade to stay in the game.
I’ll catch you in the next analysis—good luck, fam! <3
💬 Let’s Talk!
Which USD/CHF trigger are you locked on? Hit the comments, and let’s crush it together! 😊 If this update lit your fire, smash that boost—it fuels my mission! ✌️
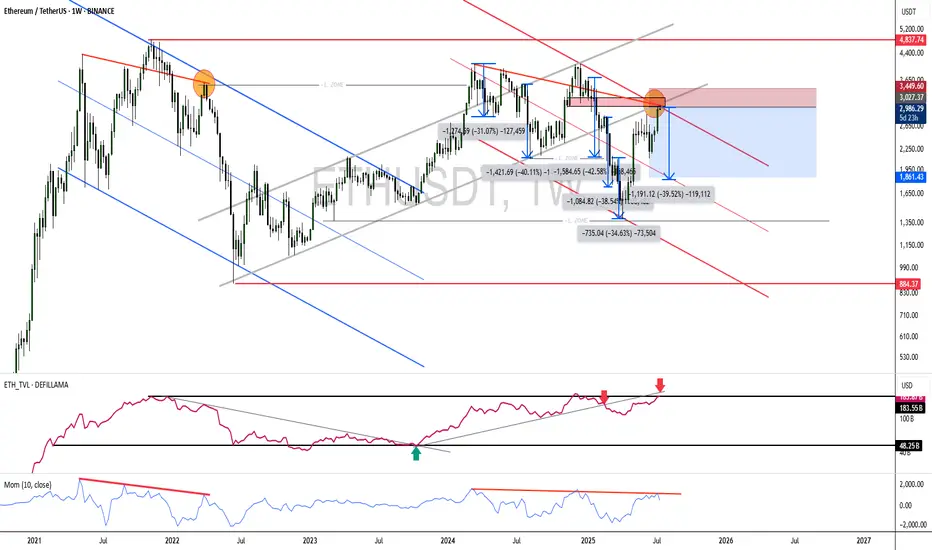
Is ETH overextended and due for a correction?For those holding ETH, this is a good point to set up a hedge using derivatives.
If the price keeps going up (which I think is unlikely at this moment—perhaps it will move sideways), buying at these levels is crazy.
In fact, there’s been a recent rally, full of people on X and YouTube saying this is the big moment to buy… That immediately raises a red flag for me!
And what about the FEDFUNDS? Have you taken a look? Haha, just something to think about.
--
After a long time away from TradingView and the community, I’m back to breathe some life into it!
Missed you all — let’s enjoy life and make the most of what it has to offer!
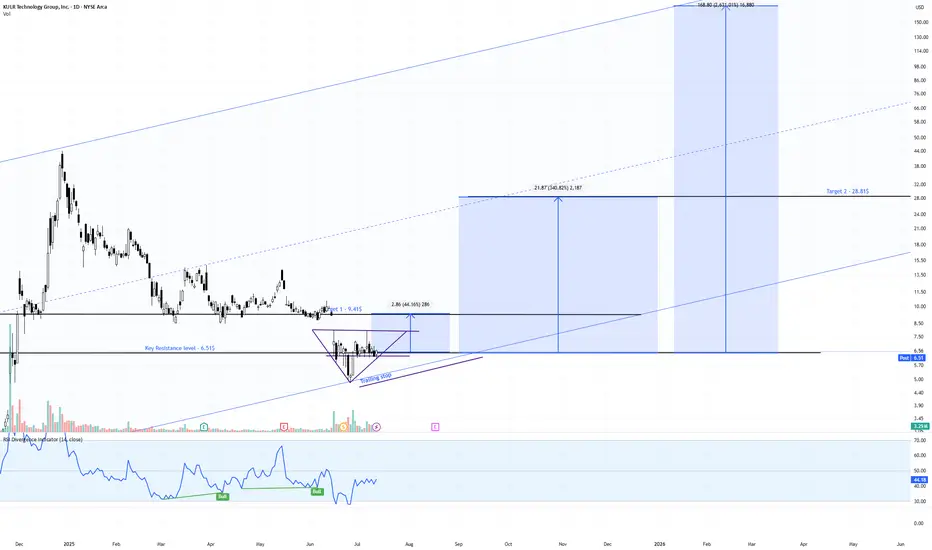
KULR Daily Watch – Triangle Squeeze Loading📍 Price Action:
Sitting tight at $6.50, coiling inside a clean symmetrical triangle. Last fake-out under support didn’t confirm → bulls still holding the line.
📊 Pattern Probabilities (Bulkowski):
Symmetrical triangles break ~54–60% in trend direction. Post-breakout moves hit ~60–75% of measured height → decent odds for upside here.
✅ Volume contracting = typical pre-breakout behavior
✅ RSI divergence still bullish
✅ Channel since 2023 intact, macro structure supports trend-following
🎯 Targets & RR Setup:
Trigger zone: $7.20–$7.50
Target 1: $9.45 (+31% | RR ~2.5:1)
Target 2: $28.81 (+298% | RR ~12:1)
Target 3 (channel top): $168.12 (+2,368% | moonshot 🌙)
⏳ Next Step:
Break over $7.50 = green light for Target 1. We’re trailing stops below the rising trendline to lock in gains without killing the move early.
#KULR #TrianglePattern #BreakoutWatch #TargetTraders #StockMarket
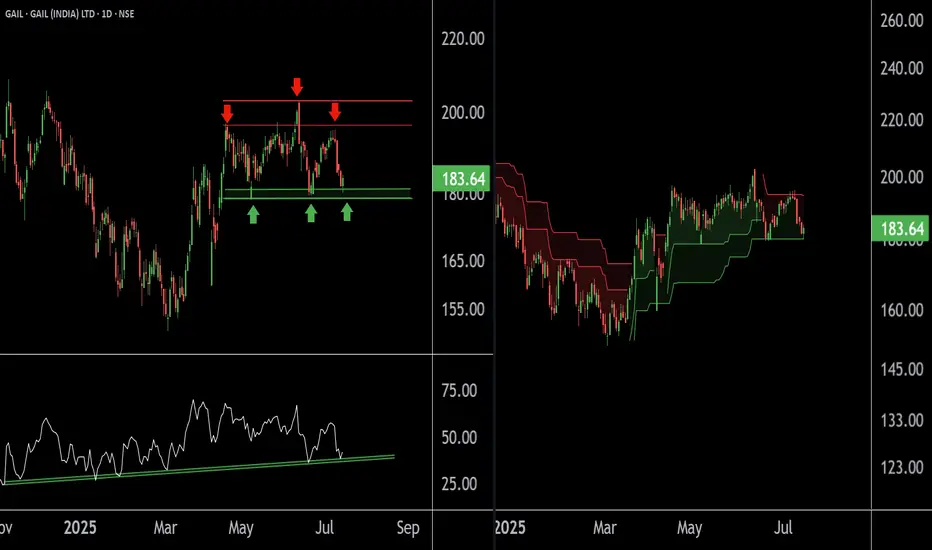
GAIL at Best Support zone !! There are two chart of Gail on Daily timeframe.
On the first chart Gail is moving in well defined parallel channel with support near at 178-180 zone.
Daily RSI is also taking support and bouncing back, indicating a revival in short-term momentum and strengthening the overall bullish setup.
On the second chart , the stock is bouncing from the supertrend support around ₹180, reinforcing bullish sentiment. However, on the shorter timeframe, the supertrend indicator is acting as resistance near ₹192, which needs to be breached for further upside continuation.
Thank You !!
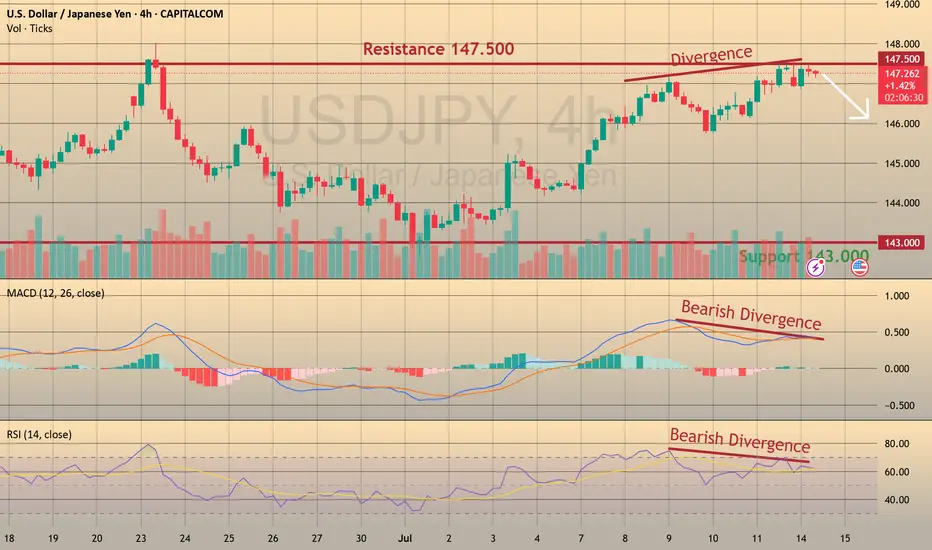
USDJPY: Bearish Divergence – Eyeing Shorts to 143 CAPITALCOM:USDJPY
We’re seeing strong bearish divergence in USDJPY near the 148 resistance zone, shifting our focus to short opportunities with a medium-term target at 142.
📈 Trading Plan:
🔻 SELL Stop: 147.040
❌ Stop Loss: 149.220
✅ Take Profit: 143.000
(Click 👉 Trade Now 👈 on your mobile to copy SL & TP easily)
🔍 Why am I short here?
✅ Technical: Clear bearish divergence on the H4 (RSI & MACD), indicating potential reversal signals.
✅ Resistance Zone: Price is testing the key 148 resistance, providing an ideal risk-reward location for shorts.
✅ Macro Event: Ahead of tomorrow’s US CPI release, a conservative trade structure is maintained to manage volatility risks.
📰 Fundamental Snapshot:
Japan’s economy shows signs of stabilization:
Core machinery orders fell only 0.6% MoM in May to ¥913.5B, much better than April’s -9.1% and forecasts of -1.5%.
Despite the headline decline, it indicates resilience in Japan’s capital spending, supporting the JPY’s medium-term outlook amid global trade and growth risks.
Trade cautiously!
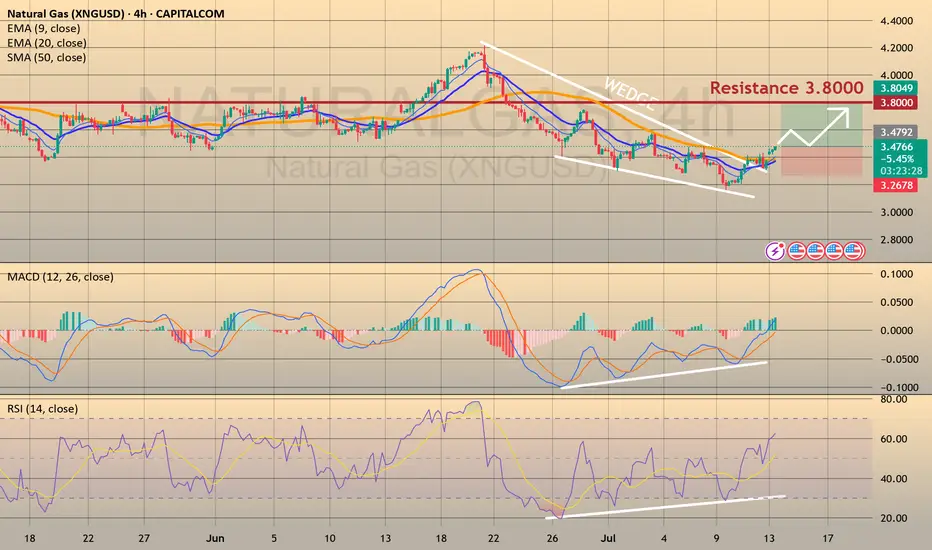
NATURAL GAS - REBOUND FROM THE MAJOR TRENDLINE AND ANOTHER LONG CAPITALCOM:NATURALGAS
Last week on Wednesday and Thursday we observed the false breakout of the major trendline. Eventually, Thursday ended up bullish, gaining 4.8% day-to-day. On Friday the asset has been trading majorly sideways, retesting the major trendline (pic 1). Technically, looks like the divergence on RSI, MACD and Momentum works out as well as the bullish wedge (pic 2). Fundamentally, we still have warm temperature weather forecasts in the U.S. and bullish Thursday's EIA report. Additionally, today the market opened with a bullish gap and continues to grow, which is a good signal for the buyers.
Considering major levels here, I decided to open long positions:
🔼 a market buy order at 3.4556 with
❌a stop loss at 3.2995 and
🤑a take profit at 3.7927
At 3.6000 would be reasonable to reduce long position on a half. Thank you for the attention!
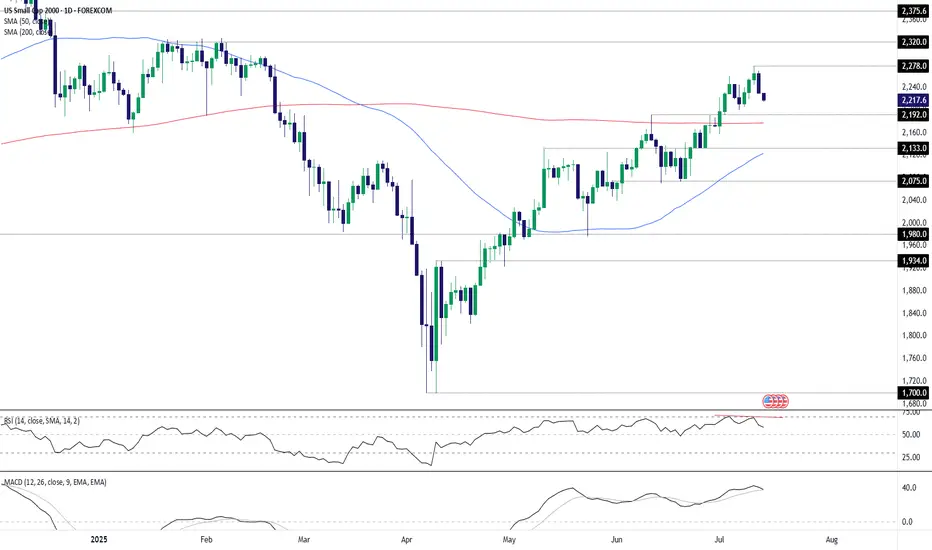
US Small Caps: Evening star pattern flags reversal riskThe U.S. Small Cap contract often generates reliable reversal signals, meaning the three-candle evening star pattern completed Friday should be of interest to traders, especially with bullish price momentum also showing signs of rolling over.
Should the price push back towards Monday’s opening level, shorts could be established beneath the level with a stop above for protection. 2192 looms as an initial target, having acted as both support and resistance in the recent past, although the 200-day moving average found at 2176.7 screens as a more appealing target given its importance for longer-term directional moves in the past.
If the price were to close beneath the 200DMA, it may act as a catalyst to spark a deeper unwind towards 2133 or 2075.
Good luck!
DS
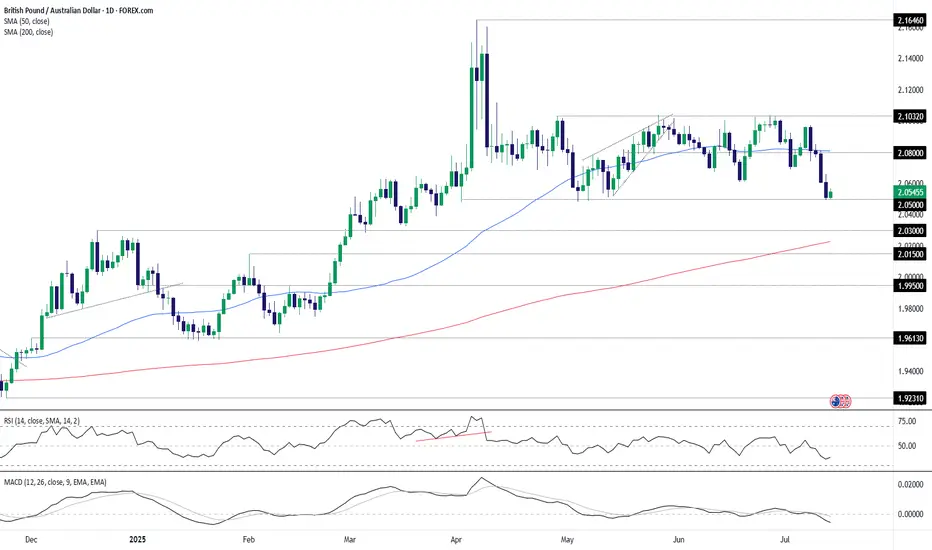
GBP/AUD: Familiar support holds as global growth fears biteThe bearish unwind in GBP/AUD stalled in familiar territory, bouncing from 2.0500 in Asian trade, continuing the pattern seen since April when Donald Trump first unveiled reciprocal tariff rates on U.S. trading partners. Now, like then, the bounce likely reflects concern about the outlook for the global economy following the unveiling of 30% tariff rates on E.U. imports entering the United States from August 1. The headline-driven nature of the move overrides the deeply bearish message coming from momentum indicators like RSI (14) and MACD.
If the pair were to move towards 2.0500 again, it would create a decent long setup where positions could be established above the level with a stop beneath for protection. 2.0600 and 2.0700 screen as possible targets, although the most appealing target would be 2.0800 from a risk-reward perspective—that level has seen plenty of work either side of it over recent months and has the 50-day moving average located just above.
If the pair were to reverse back through 2.0500 and close there, the bullish setup would be invalidated, opening the door for bearish trades to be set targeting support at 2.0300.
Good luck!
DS
TRBUSDT: Massive Bullish Setup or a Fakeout Trap?Yello Paradisers — is TRBUSDT gearing up for a major breakout, or is this just another fakeout before a deeper drop? Our previous calls have been consistently accurate, and now this chart is flashing multiple signals that deserve your full attention.
💎Currently, TRBUSDT has formed a textbook falling wedge pattern, a well-known bullish reversal signal. What's adding strength to this setup is a clear bullish divergence, suggesting that momentum may be shifting in favor of the bulls. Even more compelling, the price is now holding firmly inside a bullish Order Block (OB) zone, which is aligned with the 200 EMA — a powerful confluence that increases the probability of a bullish move significantly.
💎For aggressive traders, this could be a valid spot to enter immediately, capitalizing on the current structure and zone. However, for those looking for a more calculated entry with improved risk-to-reward, waiting for a pullback could provide a much better setup — with the potential to offer over 4.5 RR, making it a high-probability trade idea.
💎That said, it’s important to manage risk carefully. If TRBUSDT breaks down and closes candle below the bullish OB zone, this would invalidate the bullish setup entirely. In that case, the smart move would be to wait patiently for new price action to form before making any decisions. Reacting emotionally here could lead to unnecessary losses, so discipline is key.
🎖Strive for consistency, not quick profits. Treat the market as a businessman, not as a gambler. If you want to be consistently profitable, you need to be extremely patient and always wait only for the best, highest probability trading opportunities.
MyCryptoParadise
iFeel the success🌴

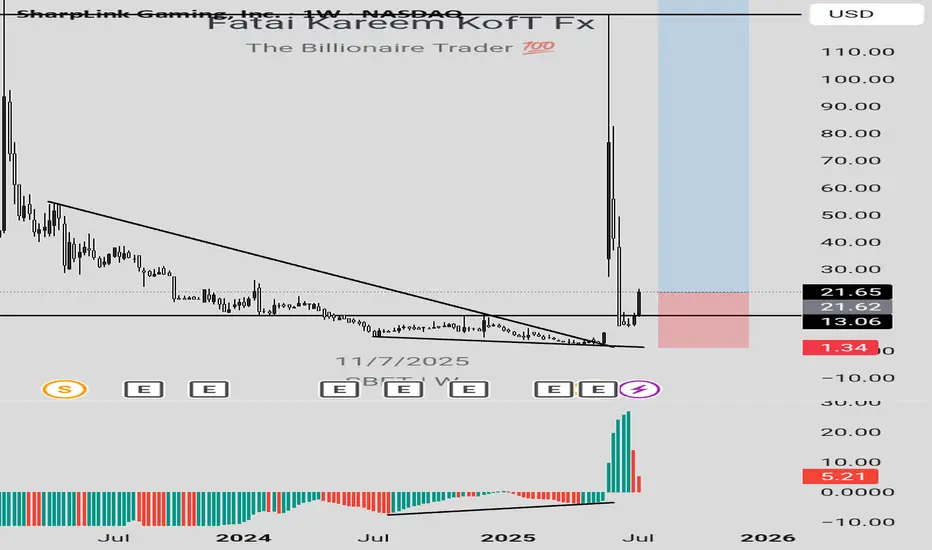
A life-changing SBET long ideaSBET stock presents an amazing long opportunity that has a potential to do over 100x. After the break out of a down trend line, price retraced to the support, with price closing above this support level.
To advantage of this long opportunity, you can buy from the current market price while the exit can be at $1.34 and the targets can be at $123.70, $178.48, $541.22, $1041.90 and the final target at $2155.20.
Confluences for the long opportunity are as follows:
1. Break out of down trendline
2. Retest of the down trendline and support level.
3. Bullish divergence signal from awesome oscillator.
Disclaimer: This is not a financial advice. The outcome maybe different from the projection. Don't take the signal if you're not willing to accept the risk.
Netflix is going to fall sharply soonNetflix is in the huge 5th wave extension. I expect it to complete wave (v) of 5 very soon, probably within the next week.
RSI divergence on 3-days, weekly frames is quite visible and supports the upcoming trend reversal.
When wave 5 is extended, retracement typically goes to the bottom of wave (ii) of this 5th wave. This would mean 1180-1195 USD to end the wave 5. Also, at this price wave 5 will be 2.168 times bigger than waves 1 and 3 together.

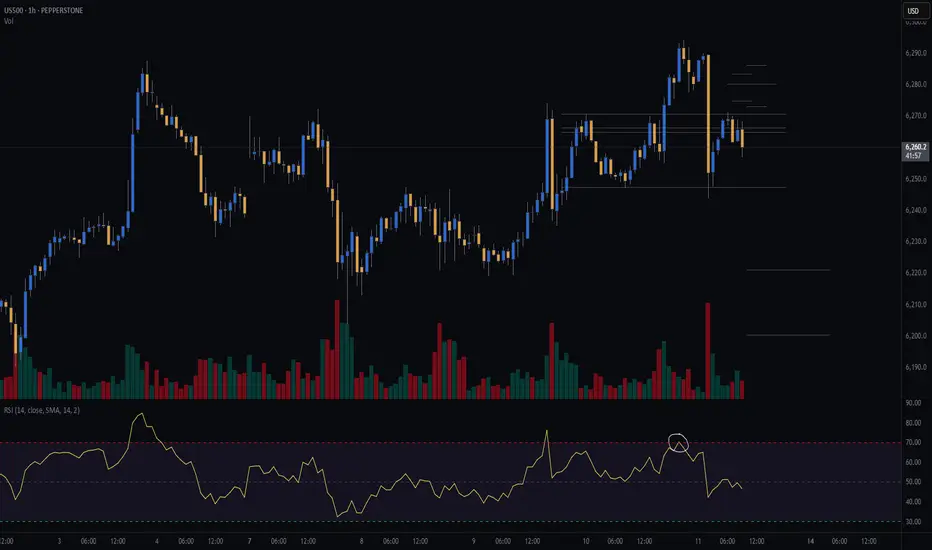
S&P 500 (CASH500) Short - Head and shoulders H1Potential short on S&P 500.
Risk/reward = 3.4
Entry = 6264.9
Stop loss = 6280.3
TP level 1 = 6221.7 (50%)
TP level 2 = 6200.5 (50%)
Need current candle to close back in range at 10.00 for all variables to be met.
Volume exception applied since current candle is the open of European markets.
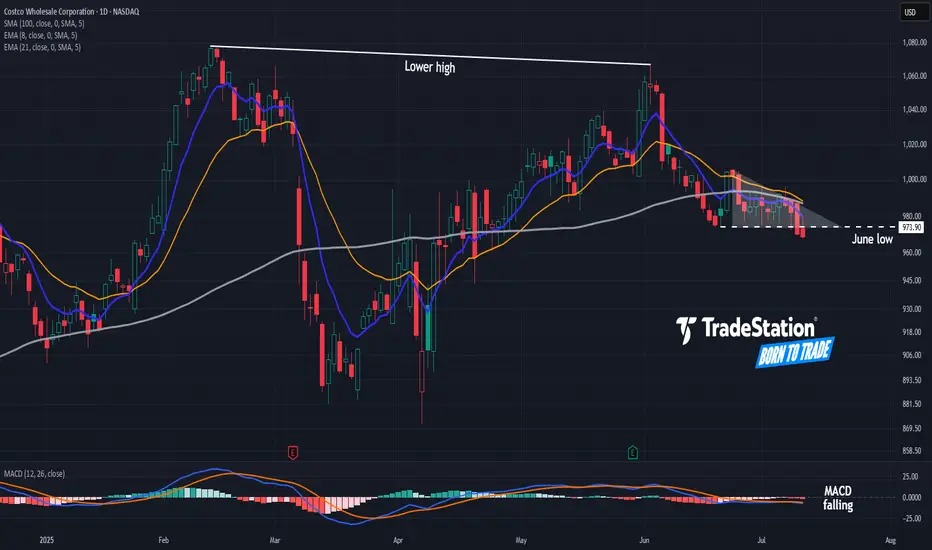
Potential Top in CostcoCostco Wholesale has been quietly limping, and some traders may see downside risk in the big-box retailer.
The first pattern on today’s chart is the June low of $973.90. COST made lower highs while trying to hold that level but is now sliding below it. That may be viewed as a potentially bearish triangle breakdown.
Second, the 8-day exponential moving average (EMA) is under the 21-day EMA. MACD is also falling. Both of those signals may be consistent with short-term downtrends.
Third, COST made a lower high in June compared with February. Compared with the broader market’s breakout, such price action may reflect a lack of buying interest.
Finally, the 100-day simple moving average has turned meaningfully lower for the first time in over two years. That may suggest a weakening longer-term trend.
TradeStation has, for decades, advanced the trading industry, providing access to stocks, options and futures. If you're born to trade, we could be for you. See our Overview for more.
Past performance, whether actual or indicated by historical tests of strategies, is no guarantee of future performance or success. There is a possibility that you may sustain a loss equal to or greater than your entire investment regardless of which asset class you trade (equities, options or futures); therefore, you should not invest or risk money that you cannot afford to lose. Online trading is not suitable for all investors. View the document titled Characteristics and Risks of Standardized Options at www.TradeStation.com . Before trading any asset class, customers must read the relevant risk disclosure statements on www.TradeStation.com . System access and trade placement and execution may be delayed or fail due to market volatility and volume, quote delays, system and software errors, Internet traffic, outages and other factors.
Securities and futures trading is offered to self-directed customers by TradeStation Securities, Inc., a broker-dealer registered with the Securities and Exchange Commission and a futures commission merchant licensed with the Commodity Futures Trading Commission). TradeStation Securities is a member of the Financial Industry Regulatory Authority, the National Futures Association, and a number of exchanges.
TradeStation Securities, Inc. and TradeStation Technologies, Inc. are each wholly owned subsidiaries of TradeStation Group, Inc., both operating, and providing products and services, under the TradeStation brand and trademark. When applying for, or purchasing, accounts, subscriptions, products and services, it is important that you know which company you will be dealing with. Visit www.TradeStation.com for further important information explaining what this means.
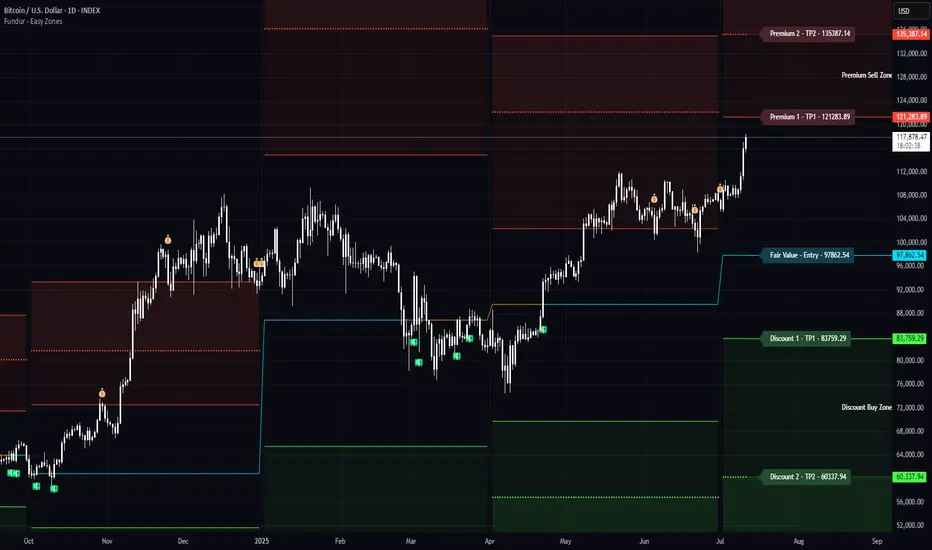
Bitcoin Breaks Above Prior Highs - What to ExpectFollow-Up Context:
As published previously, long positions were initiated around the $100,000–$102,000 support zone (green fair-value band & 200 DMA).
Current Outlook & Targets:
Quarterly Premium 1 (Q-P1) at $121,283 – first profit-taking objective.
Quarterly Premium 2 (Q-P2) at $135,387 – secondary bullish target if Q-P1 flips to support.
Key Levels Recap:
Support Held: $100 k–$102 k (fair-value confluence)
Liquidity Sweep: brief wick below to capture shorts before rapid reclaim.
No new entry is suggested here – we’re tracking progress toward the listed premium zones.
Its A Prime Set Up Guys, May 13th May 13th there will be a press conference with the CEO I think.
All techinals show a sharp fall will occur soon and I bet its the 13th.
Reached the top of the trend line and we are very over extended. Ying and a yang, time for the yang.
See my price path for a rough guess.

Zillow May Be Coming to LifeZillow has been in a tight range for months, but now it may be coming to life.
The first pattern on today’s chart is the April 2 close of $71.29. Z closed above it last week and is extending the move, which may confirm a breakout.
Second, prices pushed above the rising 200-day simple moving average. That may reflect a bullish long-term trend in the housing tech stock.
Third, the 8-day exponential moving average (EMA) is above the 21-day EMA. MACD is also rising. Those signals may be consistent with short-term bullishness.
Finally, Bollinger Band Width hit a two-year low last week. Could that price compression give rise to expansion?
Check out TradingView's The Leap competition sponsored by TradeStation.
TradeStation has, for decades, advanced the trading industry, providing access to stocks, options and futures. If you're born to trade, we could be for you. See our Overview for more.
Past performance, whether actual or indicated by historical tests of strategies, is no guarantee of future performance or success. There is a possibility that you may sustain a loss equal to or greater than your entire investment regardless of which asset class you trade (equities, options or futures); therefore, you should not invest or risk money that you cannot afford to lose. Online trading is not suitable for all investors. View the document titled Characteristics and Risks of Standardized Options at www.TradeStation.com . Before trading any asset class, customers must read the relevant risk disclosure statements on www.TradeStation.com . System access and trade placement and execution may be delayed or fail due to market volatility and volume, quote delays, system and software errors, Internet traffic, outages and other factors.
Securities and futures trading is offered to self-directed customers by TradeStation Securities, Inc., a broker-dealer registered with the Securities and Exchange Commission and a futures commission merchant licensed with the Commodity Futures Trading Commission). TradeStation Securities is a member of the Financial Industry Regulatory Authority, the National Futures Association, and a number of exchanges.
Options trading is not suitable for all investors. Your TradeStation Securities’ account application to trade options will be considered and approved or disapproved based on all relevant factors, including your trading experience. See www.TradeStation.com . Visit www.TradeStation.com for full details on the costs and fees associated with options.
Margin trading involves risks, and it is important that you fully understand those risks before trading on margin. The Margin Disclosure Statement outlines many of those risks, including that you can lose more funds than you deposit in your margin account; your brokerage firm can force the sale of securities in your account; your brokerage firm can sell your securities without contacting you; and you are not entitled to an extension of time on a margin call. Review the Margin Disclosure Statement at www.TradeStation.com .
TradeStation Securities, Inc. and TradeStation Technologies, Inc. are each wholly owned subsidiaries of TradeStation Group, Inc., both operating, and providing products and services, under the TradeStation brand and trademark. When applying for, or purchasing, accounts, subscriptions, products and services, it is important that you know which company you will be dealing with. Visit www.TradeStation.com for further important information explaining what this means.

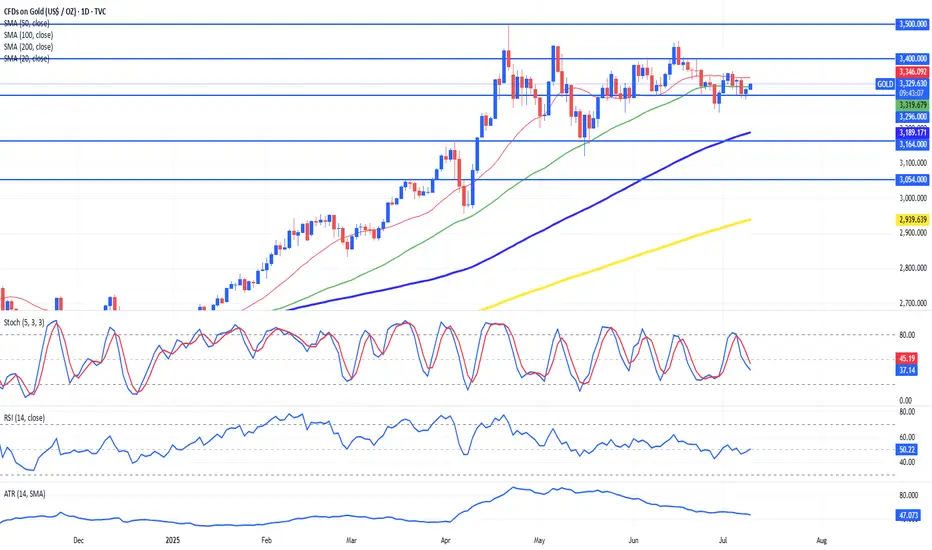
Gold Stuck in Neutral: Range Trading PersistsSince its impressive rally towards $3,500 earlier this year, Gold (XAUUSD) has settled into a consolidation phase, oscillating steadily between $3,250 and $3,400. Prices have consistently gravitated towards the 20-period SMA, reflecting a neutral sentiment among traders. Despite staying above key trend supports (50- and 200-period SMAs), gold has lacked sustained directional momentum.
Technically, indicators confirm this balanced outlook. RSI remains neutral around 49, indicating evenly matched bulls and bears, while the stochastic oscillator similarly shows neither oversold nor overbought conditions. A declining ATR highlights reduced volatility, signaling cautious market participation. Critical near-term support lies at $3,164 and $3,054, while resistance holds firm at $3,296 and $3,400. Traders should anticipate continued mean reversion and look to fade extremes within this established range.
Fundamentally, Gold faces competing drivers. Geopolitical uncertainties and central bank diversification away from the U.S. dollar provide bullish tailwinds. Conversely, resilient U.S. economic data periodically boosts the dollar, restricting gold’s upside potential. Traders should monitor this week's Fed minutes closely, as surprises here could trigger volatility or even a breakout scenario toward $3,500 or a deeper correction below $3,164. For now, expect gold to remain range-bound, reacting sensitively to headlines and macroeconomic cues.
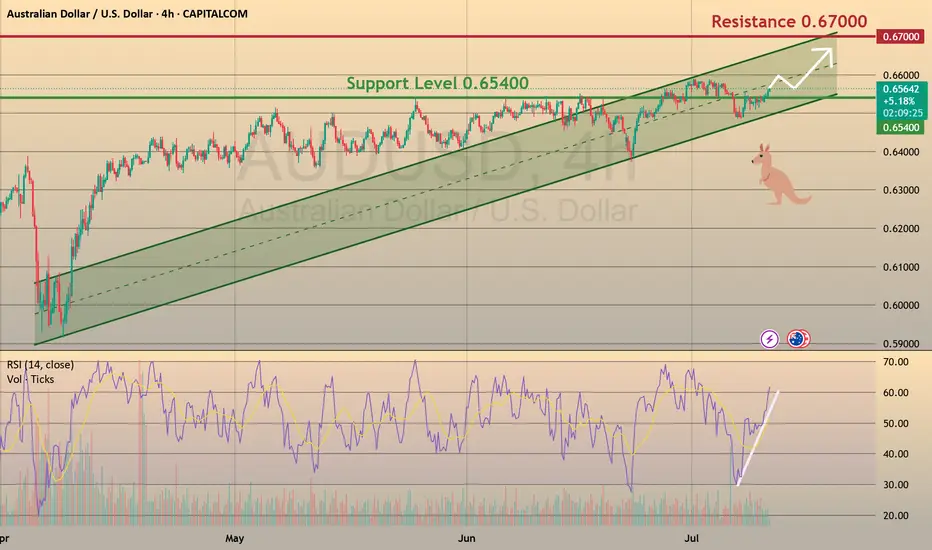
Aussie: Still Growing!
CAPITALCOM:AUDUSD
The bullish momentum continues after our last successful AUDUSD setup, and a move toward the 0.65900 resistance area looks probable now.
🪙 My Trading Plan:
🔼 BUY Stop: 0.65648
❌ Stop Loss: 0.65320
✅ Take Profit: 0.65965
💡 Why am I buying here?
✅ Price broke recent resistance at 0.65500, activating buy trades.
✅ RSI confirm ongoing bullish momentum 📊.
📰 Fundamental Situation:
🏦 RBA Rate Decision Supports AUD
The Reserve Bank of Australia (RBA) surprised markets by holding rates steady at 3.85% 🏛️, diverging from expectations of a cut. This cautious stance reflects the RBA’s preference to wait for clearer signs of slowing inflation 📉 before adjusting policy further.
Governor Michele Bullock emphasized that inflation risks remain persistent ⚠️, driven by high labor costs and weak productivity, possibly requiring a longer period of restrictive policy ⏳. Deputy Governor Andrew Hauser noted the bank is closely monitoring global risks 🌐, especially US tariff developments, underscoring sensitivity to global headwinds that could impact trade and growth 📦.
🌎 Trade Tensions in Focus:
President Trump ruled out extending tariff deadlines beyond August 1 ⛔, announcing new duties:
🔹 50% on copper 🪙
🔹 Potential 200% on pharmaceuticals 💊
🔹 10% on goods from BRICS 🌐
These moves are likely to intensify global trade tensions ⚔️, potentially impacting commodity flows and inflation, which the RBA and markets will continue to monitor closely.
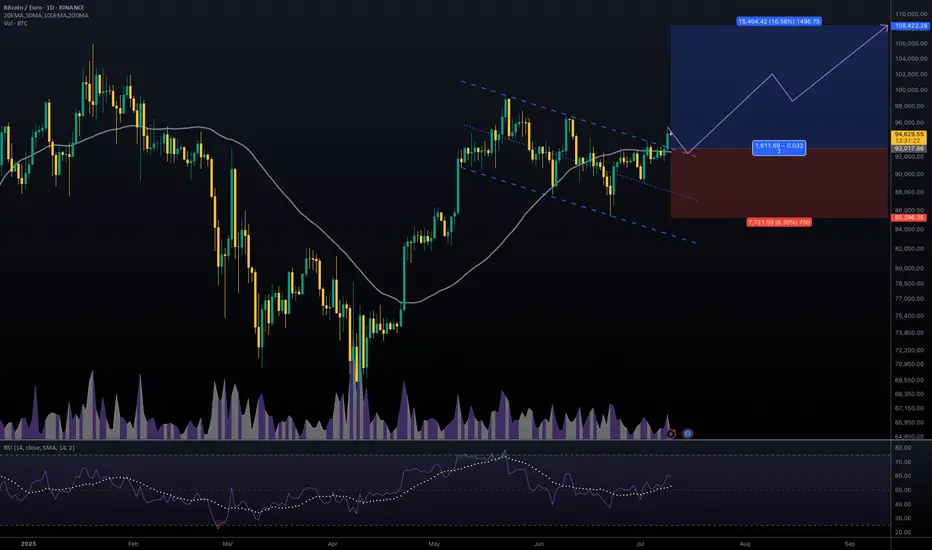
#BTCEUR #1D (Binance) Bull-flag breakout and retestBitcoin looks very good for bullish continuation after regaining 50MA support on daily, against the Euro.
⚡️⚡️ #BTC/EUR ⚡️⚡️
Exchanges: Binance
Signal Type: Regular (Long)
Amount: 12.0%
Entry Targets:
1) 93017.86
Take-Profit Targets:
1) 108422.28
Stop Targets:
1) 85296.36
Published By: @Zblaba
CRYPTOCAP:BTC BINANCE:BTCEUR #Bitcoin #PoW bitcoin.org
Risk/Reward= 1:2.0
Expected Profit= +16.6%
Possible Loss= -8.3%
Estimated Gaintime= 1-2 months
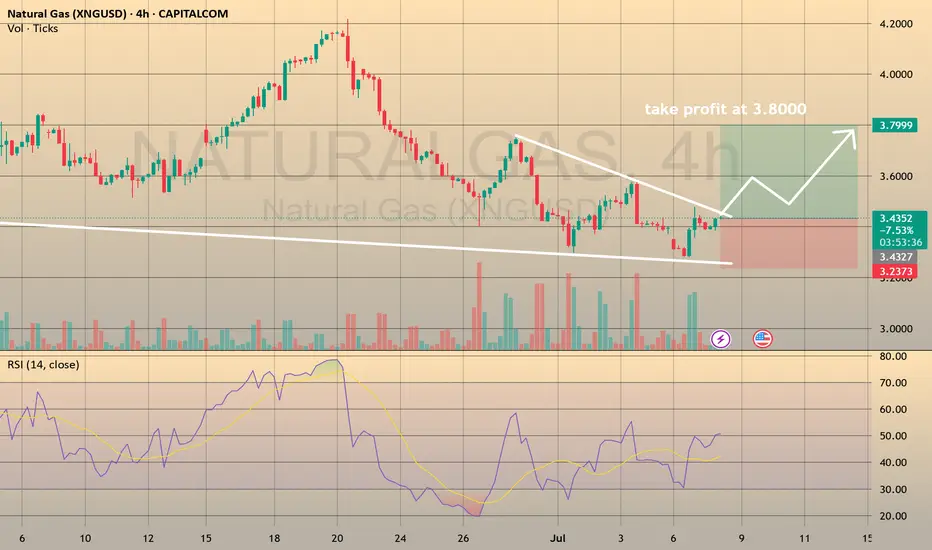
XNGUSD POSSIBLE LONG OPPORTUNITY
Us natural gas has been falling since June 20th and stopped a decline nearby the 3.3900 level with minor false breakouts of it. Currently we observe the reversal bullish wedge pattern, which is supported by a divergency on rsi on 4-h timeframe. Yesterday natural gas trading session opened with a gap downside, however, later, closer to the American session we observed buying volumes and the asset managed to hold above the 3.3900, which makes it interesting to go long.
If the price breaks above the MA50 at 3.4824, would be nice to set a
🔼buy stop order at 3.5144 with a
💰take profit at 3.8000 and a
❌stop loss at 3.2494, below the trendline.
The risk-reward ratio is 1:1.08.
Trend linesStraight forward idea. The green line represents this cycle's sellers. The blue line has been this cycle's buyers. The red line has formed across multiple cycles and has yet to break. If the blue line breaks, the cycle is likely over. The white line is just an approximate mid-point between the green and blue. Also, seeing RSI bearish divergences is certainly less than ideal.
My longer term bags wants this red line break, but the price action could certainly look better. It could be that bitcoin dominance should be much lower for there to be a cyclical top. You could argue speculative alts rising in parabolic fashion creating a bubble is what causes the cycles to be over, but that could be a false assumption.

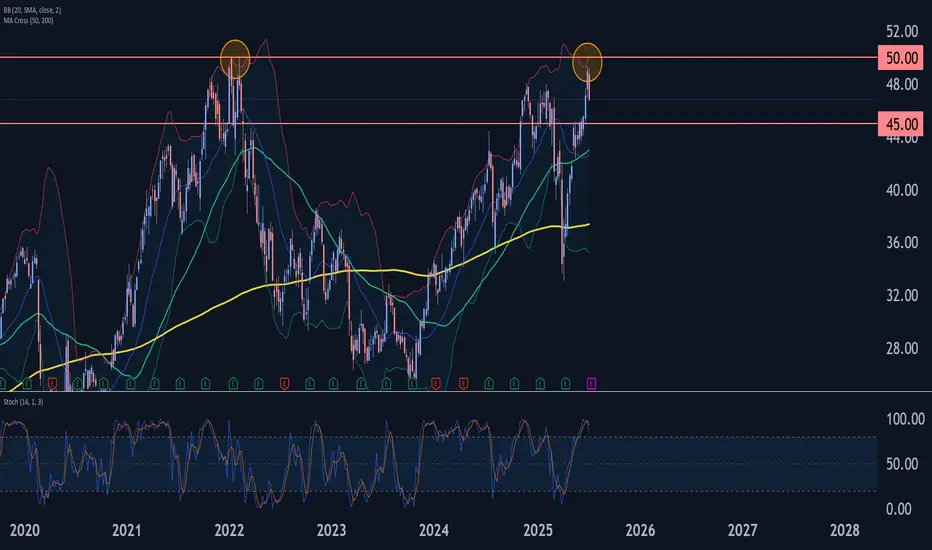
Bank of America Wave Analysis – 9 July 2025
- Bank of America reversed from resistance area
- Likely to fall to support level 45.00
Bank of America recently reversed down from the resistance area located between the long-term resistance level 50.00 (which started the weekly downtrend at the start of 2022) and the upper weekly Bollinger Band.
The downward reversal from this resistance area stopped the previous intermediate impulse wave (3) from the start of 2025.
Given the strength of the resistance level 50.00 and the overbought weekly Stochastic Bank of America can be expected to fall to the next support level 45.00.