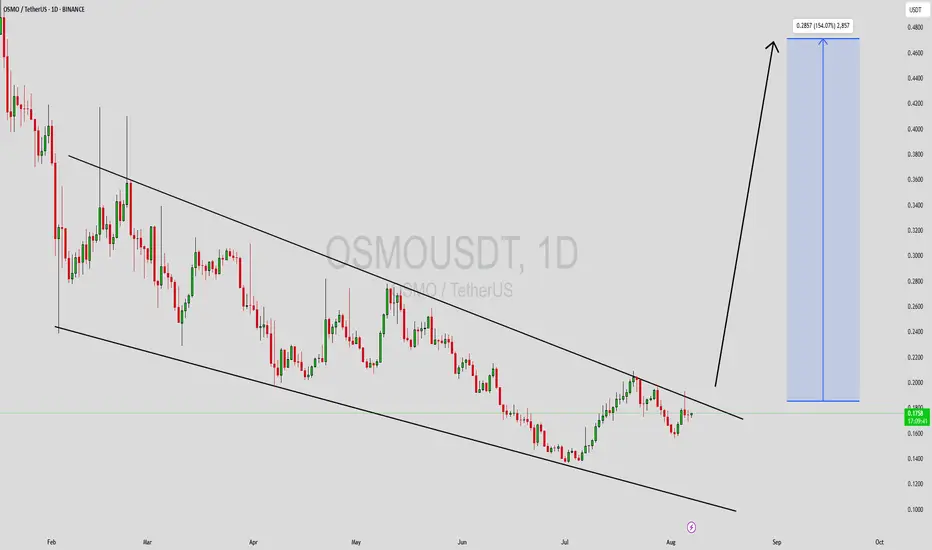
OSMOUSDT Forming Falling WedgeOSMOUSDT is currently displaying a well-formed falling wedge pattern, a classic bullish reversal signal that often precedes strong upward momentum. This pattern is characterized by a narrowing price range, which reflects decreasing selling pressure and a potential shift in market sentiment. As the wedge tightens, a breakout becomes increasingly likely—especially when accompanied by growing volume and investor interest as seen in the recent OSMOUSDT price action.
The falling wedge setup on OSMOUSDT is further supported by a notable uptick in volume, signaling that accumulation may be underway. Historically, falling wedges break to the upside with strong momentum, often leading to rapid price expansion. In this case, the projected upside move is estimated to be in the range of 140% to 150% from current levels. This makes OSMO one of the more attractive breakout candidates in the mid-cap altcoin space, especially for traders seeking high-reward setups.
The overall market sentiment around Osmosis has also been increasingly positive, with more eyes turning toward decentralized finance projects and blockchain infrastructure plays. OSMO, being a core player in the Cosmos ecosystem, is well-positioned for strong speculative interest, particularly as its technicals align with favorable chart patterns and renewed on-chain activity.
For those tracking breakout patterns and looking to capitalize on explosive moves, OSMOUSDT offers a technically sound and timely opportunity worth serious consideration.
✅ Show your support by hitting the like button and
✅ Leaving a comment below! (What is You opinion about this Coin)
Your feedback and engagement keep me inspired to share more insightful market analysis with you!
OSMOBTC
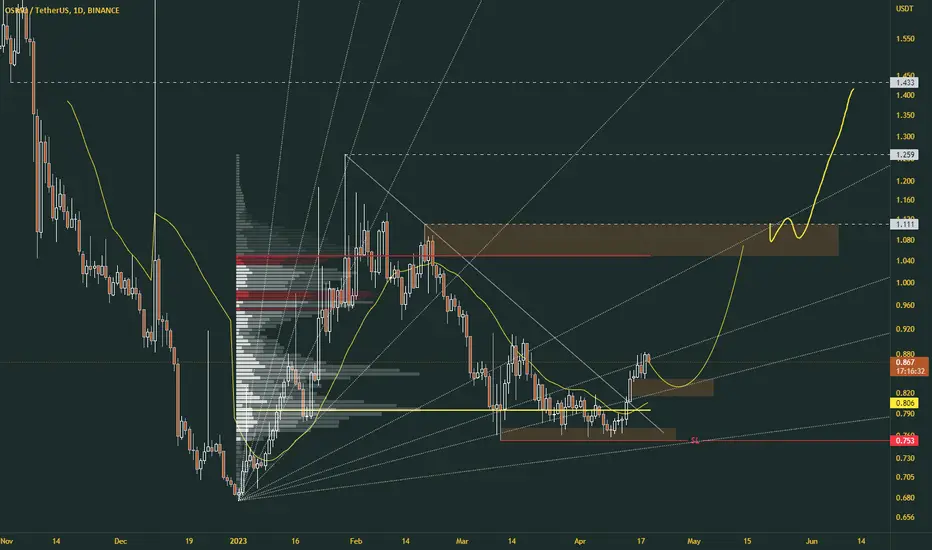
OSMO/USD - One more leg down then FOMO time! 🚀As predicted in my last idea, OSMO continued down for some time and now it would appear we are about to complete a five wave correction.
Price completed wave 4 and is falling on wave 5. Once done, OSMO could have a nice recovery.
The indicators should also curve up nicely once we bottom on the last leg.
Buying under $8 seem like a good idea based on this chart. NFA.
I'd not jump just yet, give it a bit of time, but chart is promising.
Like and follow if you liked my idea!
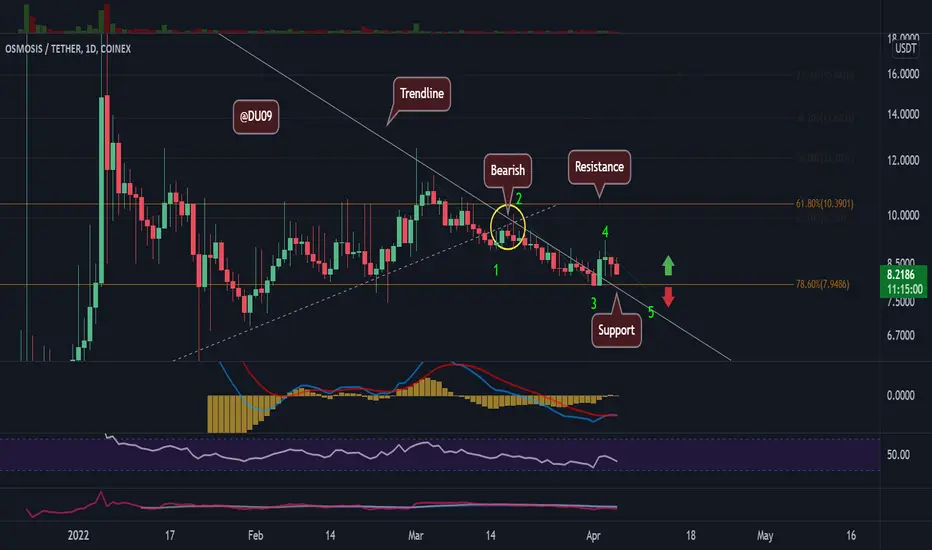
OSMO/USD - Bearish price action continues. Support at $8! 🙄Osmosis, an exchange token on the Cosmos ecosystem had a great pump in early 2022, but that quickly faded.
OSMO could not sustain the uptrend and in March fell below a key ascending trendline which was re-tested as resistance = BEARISH! See yellow circle.
For this reason, do not FOMO into OSMO. It can easily drop to $8 before any sustained recovery.
To turn bullish, OSMO has to turn the descending resistance trendline into support. Otherwise, expect lower lows as price searches for support.
The indicators and volume are also not looking sexy and are rather bearish.
Bias is bearish. This is supported by the price action and indicators.
Seems some market participants are stuck in the past when OSMO pumped hard, but this chart gives no such indications now.
Reality check is important. Wait for a clear break before FOMOing.
Like and follow if you liked my idea!
