USDJPY - Now or Never!Hello TradingView Family / Fellow Traders. This is Richard, also known as theSignalyst.
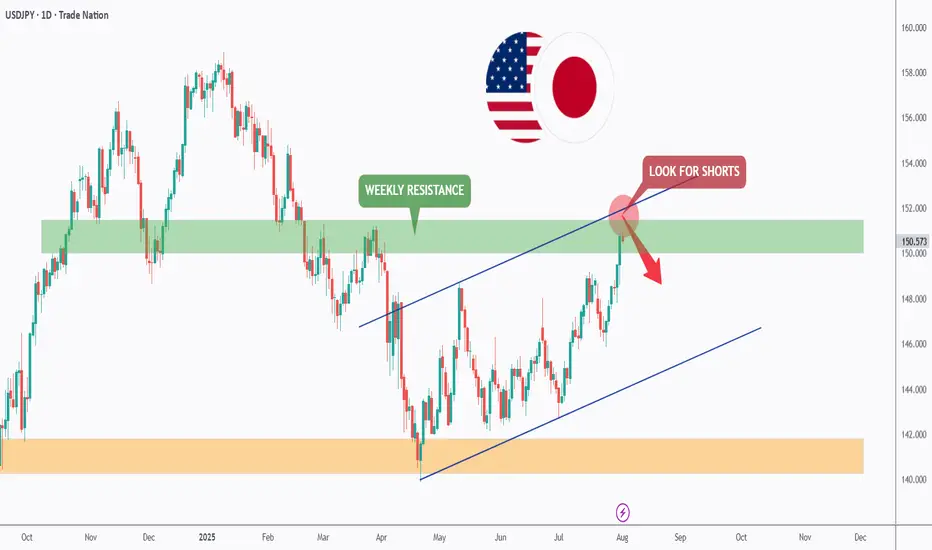
📈USDJPY has been overall bullish trading within the rising channel marked in blue and it is currently retesting the upper bound of the channel acting as an over-bought zone.
Moreover, the green zone is a strong weekly resistance.
📚 As per my trading style:
As #USDJPY is around the red circle zone, I will be looking for bearish reversal setups (like a double top pattern, trendline break , and so on...)
📚 Always follow your trading plan regarding entry, risk management, and trade management.
Good luck!
All Strategies Are Good; If Managed Properly!
~Rich
Disclosure: I am part of Trade Nation's Influencer program and receive a monthly fee for using their TradingView charts in my analysis.
Overbought
CHFJPY - The Bulls Are Exhausted!Hello TradingView Family / Fellow Traders. This is Richard, also known as theSignalyst.
📈CHFJPY has been overall bullish trading within the rising channel marked in blue and it is currently retesting the upper bound of it.
Moreover, the green zone is a strong supply.
🏹 Thus, the highlighted red circle is a strong area to look for sell setups as it is the intersection of the upper blue trendline and green supply.
📚 As per my trading style:
As #CHFJPY is hovering around the red circle zone, I will be looking for bearish reversal setups (like a double top pattern, trendline break , and so on...)
📚 Always follow your trading plan regarding entry, risk management, and trade management.
Good luck!
All Strategies Are Good; If Managed Properly!
~Richard Nasr
Disclosure: I am part of Trade Nation's Influencer program and receive a monthly fee for using their TradingView charts in my analysis.

NZDUSD - It is Time!Hello TradingView Family / Fellow Traders. This is Richard, also known as theSignalyst.
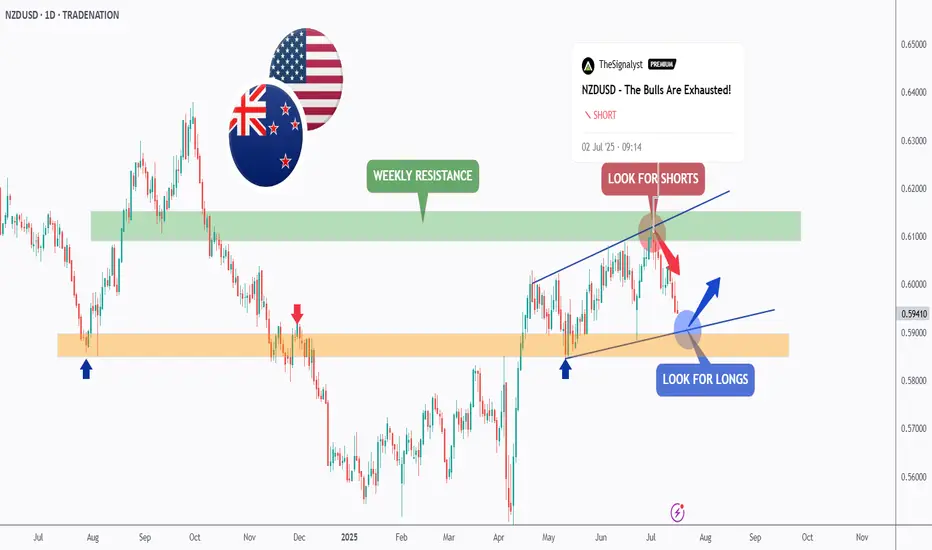
As per our last NZDUSD analysis, attached on the chart, it rejected the upper bound of the blue wedge pattern and traded lower.
📈This week, NZDUSD is retesting the lower bound of the wedge.
Moreover, the orange zone is a strong weekly support.
🏹 Thus, the highlighted blue circle is a strong area to look for buy setups as it is the intersection of the lower blue trendline and orange support.
📚 As per my trading style:
As #NZDUSD approaches the blue circle zone, I will be looking for bullish reversal setups (like a double bottom pattern, trendline break , and so on...)
📚 Always follow your trading plan regarding entry, risk management, and trade management.
Good luck!
All Strategies Are Good; If Managed Properly!
~Rich
Disclosure: I am part of Trade Nation's Influencer program and receive a monthly fee for using their TradingView charts in my analysis.
EURJPY - Still Over-Bought!Hello TradingView Family / Fellow Traders. This is Richard, also known as theSignalyst.
📈EURJPY has been overall bullish trading within the rising channel marked in blue. However, it is currently retesting the upper bound of the channel.
Moreover, the green zone is a major weekly supply.
🏹 Thus, the highlighted red circle is a strong area to look for sell setups as it is the intersection of the upper blue trendline and weekly supply.
📚 As per my trading style:
As #EURJPY approaches the red circle zone, I will be looking for bearish reversal setups (like a double top pattern, trendline break , and so on...)
📚 Always follow your trading plan regarding entry, risk management, and trade management.
Good luck!
All Strategies Are Good; If Managed Properly!
~Richard Nasr
Disclosure: I am part of Trade Nation's Influencer program and receive a monthly fee for using their TradingView charts in my analysis.

USDJPY - Trade The Range!Hello TradingView Family / Fellow Traders. This is Richard, also known as theSignalyst.
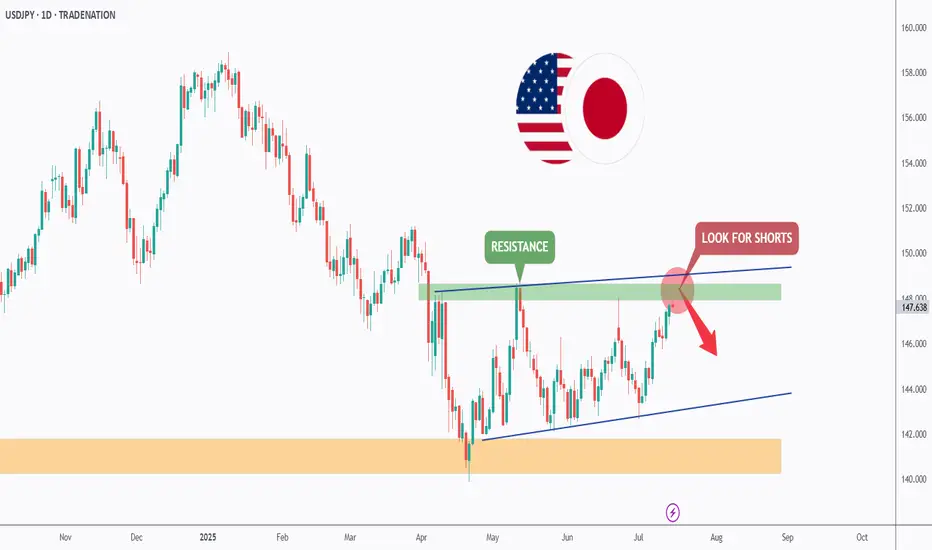
📈USDJPY has been trading within a range between $140 and $150 round numbers and it is currently retesting the upper bound of the range.
📚 As per my trading style:
As #USDJPY is around the red circle zone, I will be looking for bearish reversal setups (like a double top pattern, trendline break , and so on...)
📚 Always follow your trading plan regarding entry, risk management, and trade management.
Good luck!
All Strategies Are Good; If Managed Properly!
~Rich
Disclosure: I am part of Trade Nation's Influencer program and receive a monthly fee for using their TradingView charts in my analysis.
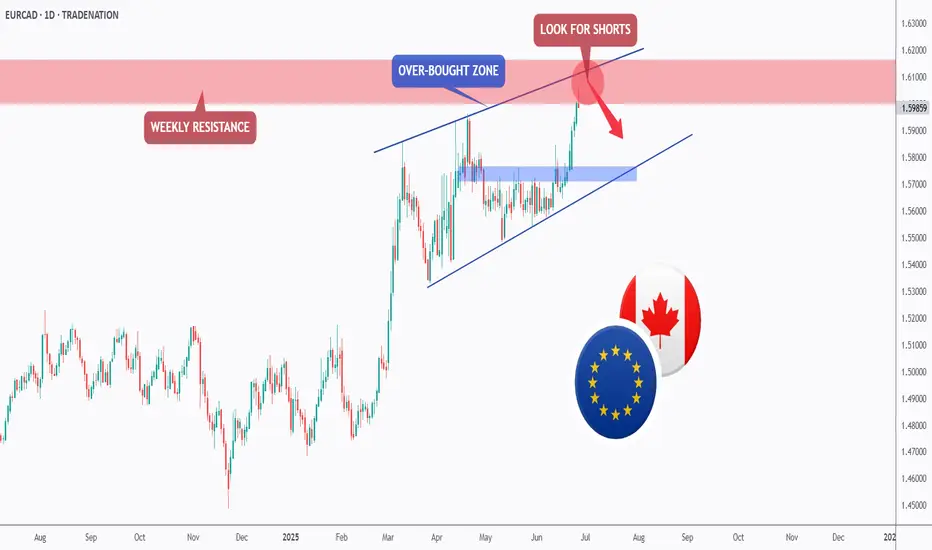
EURCAD - Weekly Resistance Might Shift The Momentum!Hello TradingView Family / Fellow Traders. This is Richard, also known as theSignalyst.
📈EURCAD has been overall bullish trading within the rising channel marked in blue. However, it is currently approaching the upper bound of the channel.
Moreover, the red zone is a strong weekly resistance.
🏹 Thus, the highlighted red circle is a strong area to look for sell setups as it is the intersection of the upper blue trendline and resistance.
📚 As per my trading style:
As #EURCAD approaches the red circle zone, I will be looking for bearish reversal setups (like a double top pattern, trendline break , and so on...)
📚 Always follow your trading plan regarding entry, risk management, and trade management.
Good luck!
All Strategies Are Good; If Managed Properly!
~Rich
Disclosure: I am part of Trade Nation's Influencer program and receive a monthly fee for using their TradingView charts in my analysis.
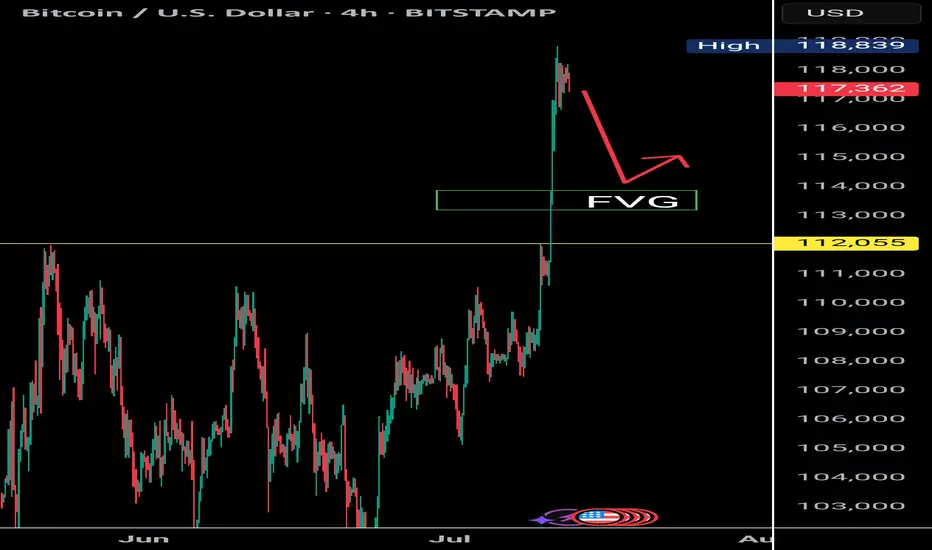
$BTC Rejection at 119K | Eyes on 112K Retest as RSI Cools DownBitcoin faces strong rejection near the $119K resistance zone, showing signs of a cooling market as the RSI exits the overbought territory. Historically, BTC tends to revisit key structural levels after such overheated moves. A favorable re-test zone lies between $114K and $112K, with $112K aligning closely with the previous all-time high — a psychologically significant support area.
Support levels to watch: $112K (favorable retest) and $110K (strong base).
As RSI continues to cool, keep an eye on bullish reactions around these levels for potential entries.
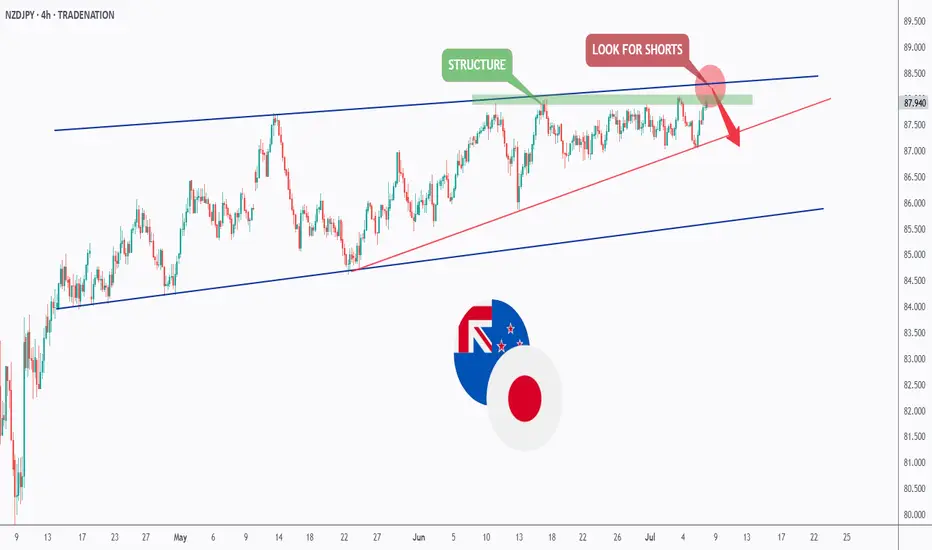
NZDJPY - bulls are exhausted! Hello TradingView Family / Fellow Traders. This is Richard, also known as theSignalyst.
📈NZDJPY has been overall bullish trading within the rising flat channel marked in blue and it is currently retesting the upper bound of it.
Moreover, the green zone is a strong structure.
🏹 Thus, the highlighted red circle is a strong area to look for sell setups as it is the intersection of the upper blue trendline and green structure.
📚 As per my trading style:
As #NZDJPY is hovering around the red circle zone, I will be looking for bearish reversal setups (like a double top pattern, trendline break , and so on...)
📚 Always follow your trading plan regarding entry, risk management, and trade management.
Good luck!
All Strategies Are Good; If Managed Properly!
~Rich
Disclosure: I am part of Trade Nation's Influencer program and receive a monthly fee for using their TradingView charts in my analysis.
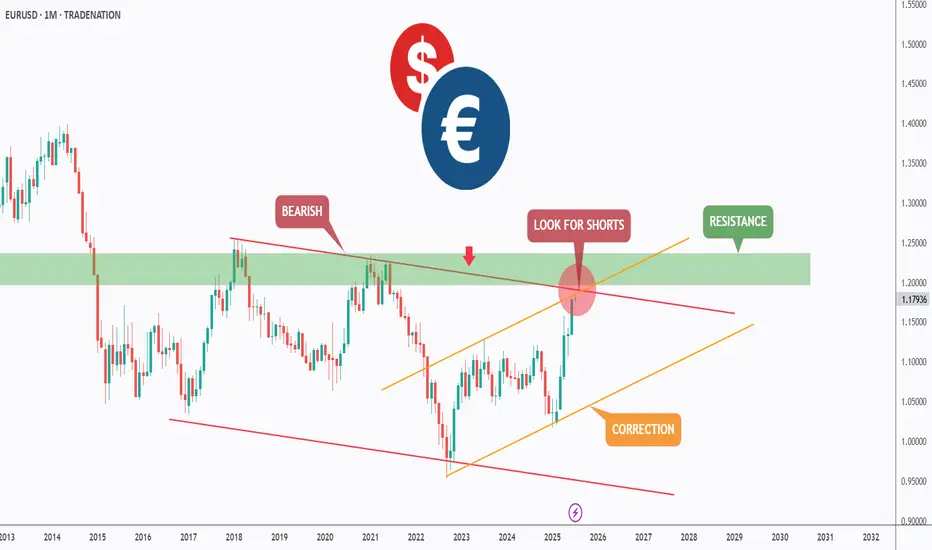
EURUSD - Macro Trend Shift Soon?Hello TradingView Family / Fellow Traders. This is Richard, also known as theSignalyst.
📈From a macro perspective, EURUSD has been bearish trading within the falling red channel.
Medium-term, EURUSD has been in a correction phase trading within the rising channel in orange.
Moreover, the green zone is a massive monthly resistance.
🏹 Thus, the highlighted red circle is a strong area to look for sell setups as it is the intersection of the upper red and orange trendlines and resistance.
📚 As per my trading style:
As #EURUSD is around the red circle zone, I will be looking for bearish reversal setups (like a double top pattern, trendline break , and so on...)
📚 Always follow your trading plan regarding entry, risk management, and trade management.
Good luck!
All Strategies Are Good; If Managed Properly!
~Rich
Disclosure: I am part of Trade Nation's Influencer program and receive a monthly fee for using their TradingView charts in my analysis.
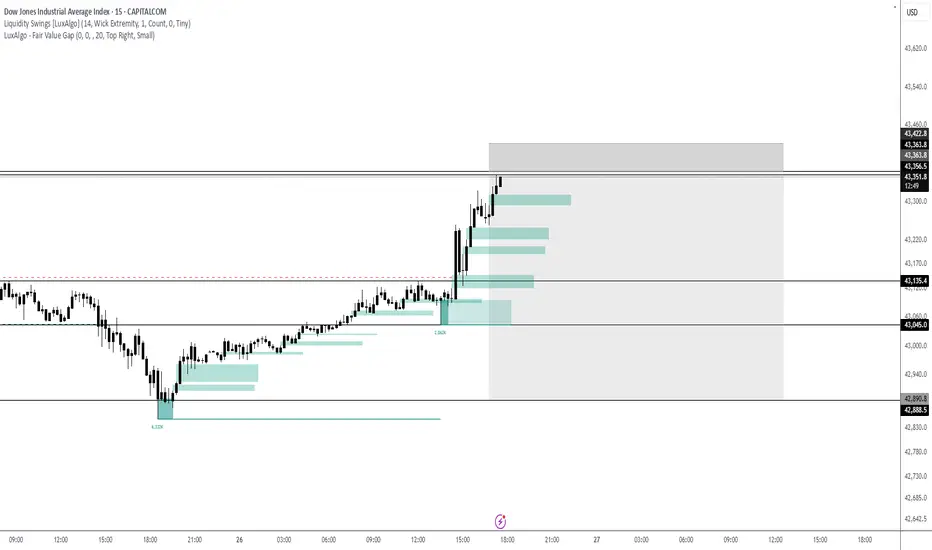
US30 - ShortLooking for the Short on US30 final pull back before we see extension to the upside 45,000.
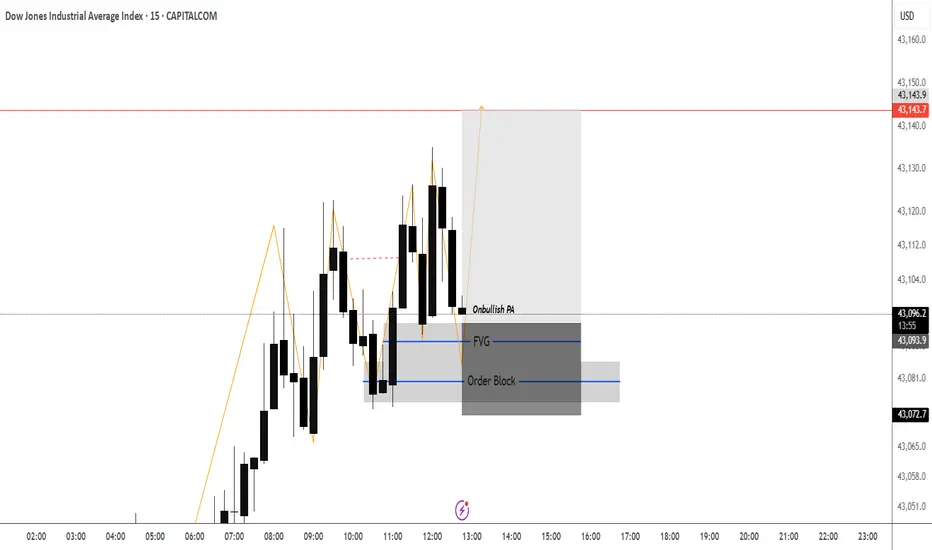
US30 - Long 43,150Still looking for that 43,150 lets get a test of FVG then on bullish PA above we can plan trade. Stops would go below the order block.
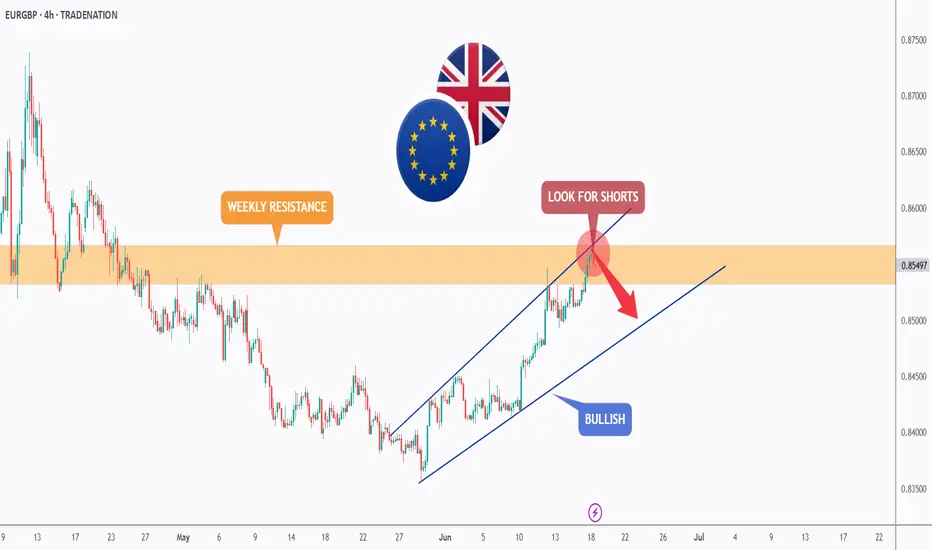
EURGBP - Bullish No More!Hello TradingView Family / Fellow Traders. This is Richard, also known as theSignalyst.
📈 EURGBP has been overall bullish trading within the rising channel marked in blue. And it is currently retesting the upper bound of the channel.
Moreover, the orange zone is a strong weekly resistance.
🏹 Thus, the highlighted red circle is a strong area to look for sell setups as it is the intersection of the upper blue trendline and resistance.
📚 As per my trading style:
As #EURGBP is around the red circle zone, I will be looking for bearish reversal setups (like a double top pattern, trendline break , and so on...)
📚 Always follow your trading plan regarding entry, risk management, and trade management.
Good luck!
All Strategies Are Good; If Managed Properly!
~Rich
Disclosure: I am part of Trade Nation's Influencer program and receive a monthly fee for using their TradingView charts in my analysis.
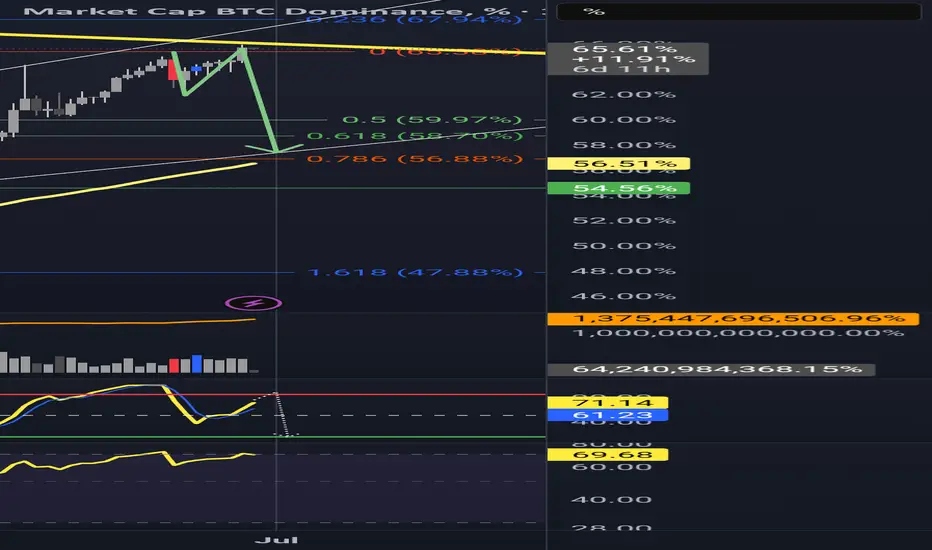
Is Altseason Around the Corner? BTC.D looks tired AF!BTC dominance just hit the top of a rising wedge that has been building for over a year. Price is stalling at 65.64 percent, sitting right against long-standing resistance.
Momentum is weakening. Stochastic RSI is at 72 and starting to roll over. RSI is sitting just under 70 and showing early signs of fading.
The structure suggests we are close to a decision. If BTC dominance starts to fall from here, the conditions for an altcoin run are in place.
Key levels to the downside are already mapped. First is 59.97 percent. Then 58.70 percent. After that, 56.88 percent. The 100-week simple moving average is also sitting at 56.51 percent. If dominance breaks below that level, it opens the door for a larger shift in market flow.
Previous retracements in BTC dominance have aligned with strong moves in altcoins. This current setup is technically clean and nearing resolution.
It is not confirmed yet, but the signals are starting to stack. This is a moment worth watching.
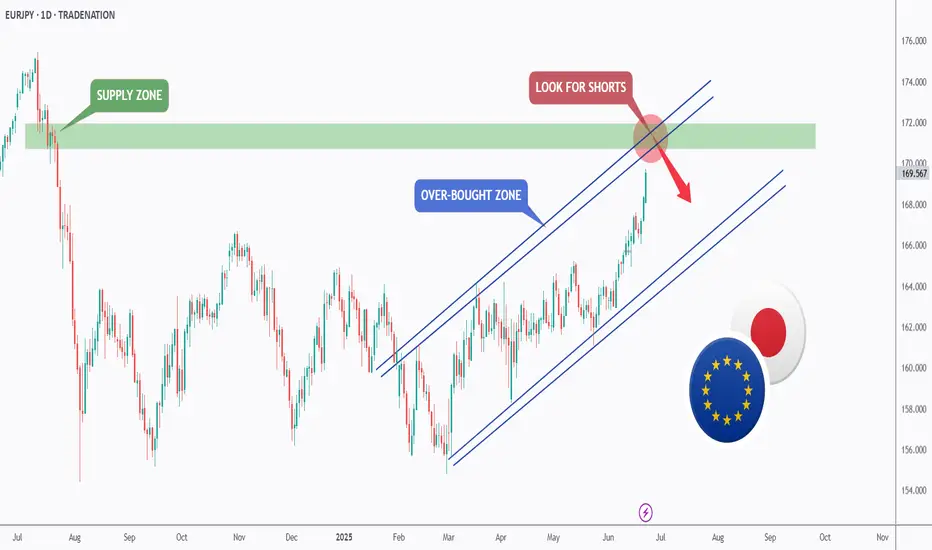
EURJPY - Over-Bought Big Time!Hello TradingView Family / Fellow Traders. This is Richard, also known as theSignalyst.
📈EURJPY has been overall bullish trading within the rising channel marked in blue. However, it is currently retesting the upper bound of the channel.
Moreover, the green zone is a major weekly supply.
🏹 Thus, the highlighted red circle is a strong area to look for sell setups as it is the intersection of the upper blue trendline and weekly supply.
📚 As per my trading style:
As #EURJPY approaches the red circle zone, I will be looking for bearish reversal setups (like a double top pattern, trendline break , and so on...)
📚 Always follow your trading plan regarding entry, risk management, and trade management.
Good luck!
All Strategies Are Good; If Managed Properly!
~Rich
Disclosure: I am part of Trade Nation's Influencer program and receive a monthly fee for using their TradingView charts in my analysis.
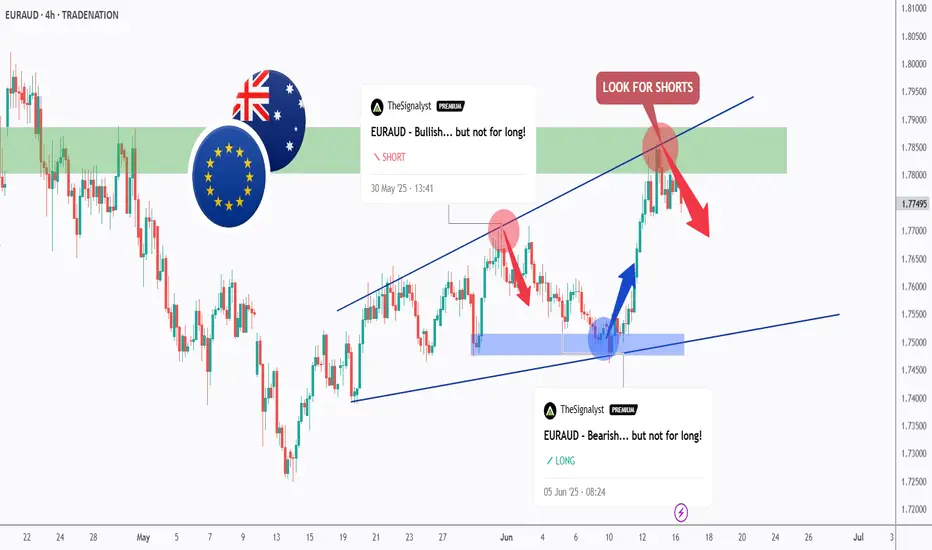
We Are Milking EURAUD... Again!Hello TradingView Family / Fellow Traders. This is Richard, also known as theSignalyst.
As per our two EURAUD analysis, we looked for shorts around the green structure and longs around the blue demand.
What's next?
📈EURAUD has been trading within the rising broadening wedge marked in blue, and it is currently rejecting the upper bound of the wedge which we consider an over-bought zone.
Moreover, the green zone is a strong structure and resistance.
🏹 Thus, the latest highlighted red circle is a strong area to look for sell setups as it is the intersection of the upper blue trendline and resistance.
📚 As per my trading style:
As #EURAUD is around the red circle zone, I will be looking for bearish reversal setups (like a double top pattern, trendline break , and so on...)
📚 Always follow your trading plan regarding entry, risk management, and trade management.
Good luck!
All Strategies Are Good; If Managed Properly!
~Rich
Disclosure: I am part of Trade Nation's Influencer program and receive a monthly fee for using their TradingView charts in my analysis.
CHFJPY - Bullish... but not for long!Hello TradingView Family / Fellow Traders. This is Richard, also known as theSignalyst.
📈CHFJPY has been overall bullish trading within the rising channel marked in blue. However, it is currently retesting the upper bound of the channel.
Moreover, the red zone is a strong structure and resistance.
🏹 Thus, the highlighted red circle is a strong area to look for sell setups as it is the intersection of the upper blue trendline and resistance.
📚 As per my trading style:
As #CHFJPY is around the red circle zone, I will be looking for bearish reversal setups (like a double top pattern, trendline break , and so on...)
📚 Always follow your trading plan regarding entry, risk management, and trade management.
Good luck!
All Strategies Are Good; If Managed Properly!
~Rich
Disclosure: I am part of Trade Nation's Influencer program and receive a monthly fee for using their TradingView charts in my analysis.

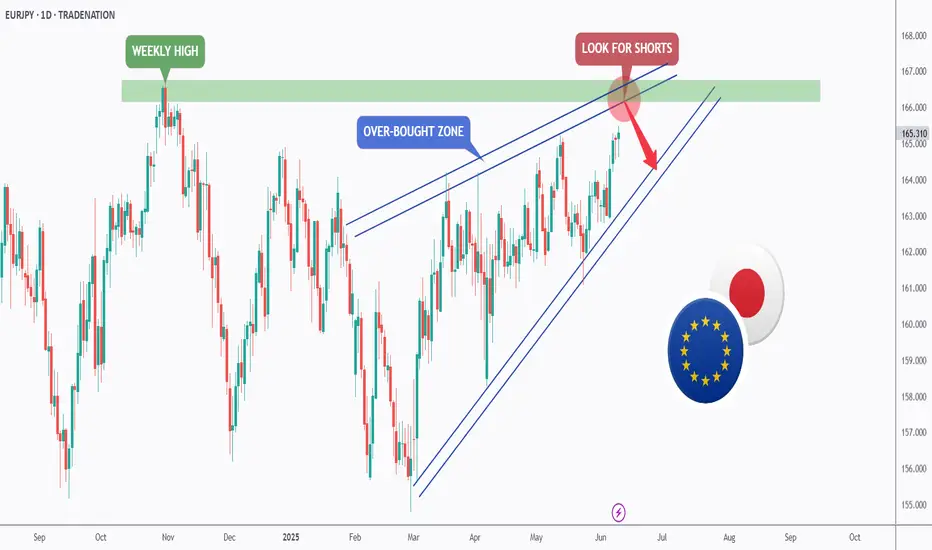
EURJPY - Already Over-Bought!Hello TradingView Family / Fellow Traders. This is Richard, also known as theSignalyst.
📈EURJPY has been overall bullish trading within the rising wedge pattern marked in blue. However, it is currently retesting the upper bound of the wedge.
Moreover, the green zone is a major weekly high.
🏹 Thus, the highlighted red circle is a strong area to look for sell setups as it is the intersection of the upper blue trendline and weekly high.
📚 As per my trading style:
As #EURJPY approaches the red circle zone, I will be looking for bearish reversal setups (like a double top pattern, trendline break , and so on...)
📚 Always follow your trading plan regarding entry, risk management, and trade management.
Good luck!
All Strategies Are Good; If Managed Properly!
~Rich
Disclosure: I am part of Trade Nation's Influencer program and receive a monthly fee for using their TradingView charts in my analysis.
$Btc Rejected at $110K – Will $106K Hold or Is $95K Next? #BTC/USD is showing signs of another lower high after facing strong rejection near the $110,000 resistance zone. The price is currently testing the $106,000 support area, a level that may serve as a crucial retest zone. If buyers step in here, we could see a bullish rebound and potential push toward a new high.
However, if $106K fails to hold, the next support zones to watch are $100K and $95K. A breakdown below $106K opens the door for a deeper correction, possibly targeting $95,000 – a key demand area from previous structure.
Supporting this bearish pressure, the RSI is dropping from the overbought zone, signaling increasing selling momentum. Historically, such RSI movements have coincided with local tops and short-term pullbacks.
🔍 Key Levels:
Resistance: $110,000
Support 1: $106,000 (retest zone)
Support 2: $100,000 (psychological level)
Support 3: $95,000 (major structure support)
📊 Outlook: Watch price action closely at $106K. A strong bounce could reignite bullish momentum. A break below this level may confirm the start of a deeper retracement.

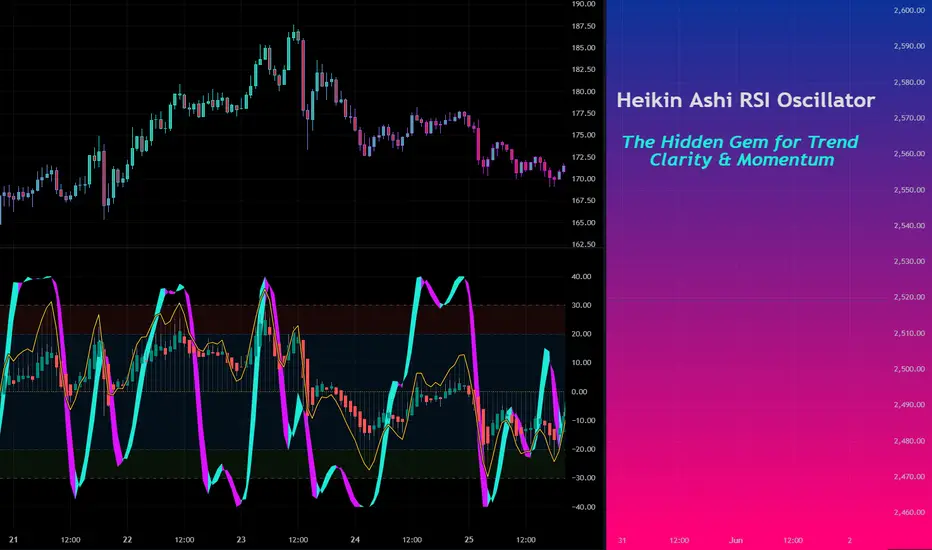
HA-RSI + Stochastic Ribbon: The Hidden Gem for Trend & MomentumNavigating volatile markets requires more than just raw price action. The Heikin Ashi RSI Oscillator blends the power of smoothed candlesticks with momentum insights to give traders a clearer picture of trend strength and reversals.
At Xuantify , we use the Heikin Ashi RSI Oscillator as a hybrid momentum and trend tool. While the indicator calculations are based on Heikin Ashi values to smooth out noise and better capture trend dynamics, the chart itself displays standard candlesticks (real price data) . This ensures that all signals are aligned with actual market structure, making it easier to execute trades with confidence and clarity.
This dual-layer approach gives us the best of both worlds: clarity from smoothing and precision from real price action. MEXC:SOLUSDT.P
🧠 How We Use It at Xuantify
At Xuantify , we integrate the Heikin Ashi RSI Oscillator into our multi-layered strategy framework. It acts as a trend confirmation filter and a momentum divergence detector , helping us avoid false breakouts and time entries with greater precision. We pair it with volume and volatility metrics to validate signals and reduce noise. Note the Stochastic Ribbon Overlay as shown in the chart, very accurate for momentum.
⭐ Key Features
Heikin Ashi Smoothing : Filters out market noise for clearer trend visualization.
RSI-Based Oscillation : Measures momentum shifts with precision.
Color-Coded Bars : Instantly identify bullish/bearish momentum.
Dynamic Signal Zones : Customizable overbought/oversold thresholds.
Stochastic Ribbon Overlay : A powerful multi-line stochastic system that enhances momentum analysis and trend continuation signals.
💡 Benefits Compared to Other Indicators
Less Whipsaw : Heikin Ashi smoothing reduces false signals common in traditional RSI.
Dual Insight : Combines trend and momentum in one visual.
Better Divergence Detection : Easier to spot hidden and regular divergences.
Visual Simplicity : Clean, intuitive design for faster decision-making.
⚙️ Settings That Matter
RSI Length : Default is 14, but we often test 10 or 21 for different timeframes.
Smoothing Type : EMA vs. SMA – EMA reacts faster, SMA is smoother.
Overbought/Oversold Levels : 70/30 is standard, but 80/20 can reduce noise in trending markets.
📊 Enhancing Signal Accuracy
Combine with Volume Oscillators to confirm momentum strength.
Use Price Action Zones to validate oscillator signals.
Look for Divergences between price and oscillator for early reversal clues.
🧩 Best Combinations with This Indicator
MACD : For cross-confirmation of momentum shifts.
Bollinger Bands : To identify volatility squeezes and breakouts.
Support/Resistance Levels : For contextual trade entries and exits.
⚠️ What to Watch Out For
Lag in Strong Trends : Like all smoothed indicators, it may react slightly late.
Over-Optimization : Avoid curve-fitting settings to past data.
Standalone Use : Best used in conjunction with other tools, not in isolation.
🚀 Final Thoughts
The Heikin Ashi RSI Oscillator is a powerful hybrid tool that simplifies complex market behavior into actionable insights. At Xuantify, it’s a core part of our strategy toolkit, helping us stay ahead of the curve with clarity and confidence.
🔔 Follow us for more educational insights and strategy breakdowns!
We regularly share deep dives into indicators, trading psychology, and backtested strategies. Stay tuned and level up your trading game with us!
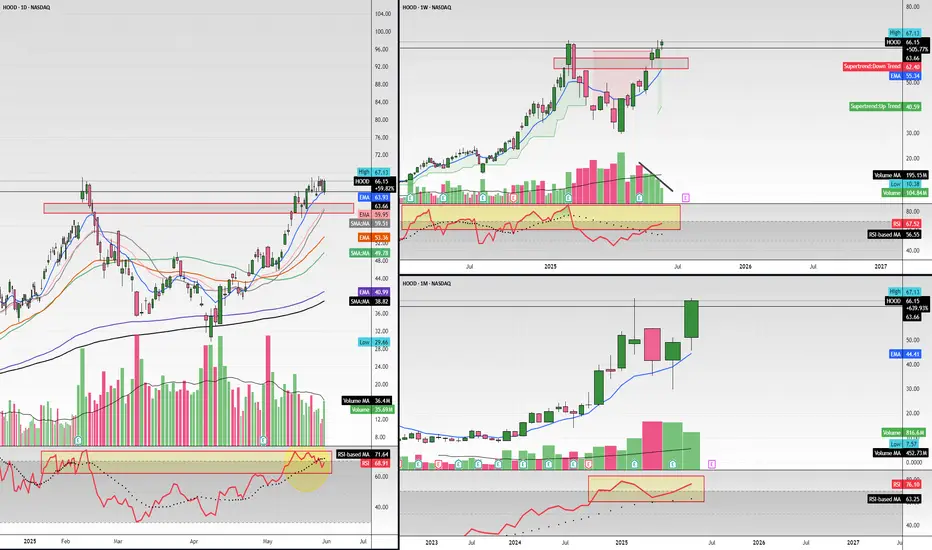
$HOOD great product but short term pull back here $58-$60Hello, I have multiple time frames up here: Daily, Weekly, and Monthly. I love Robinhood NASDAQ:HOOD as a broker, product and revolutionary company in the financial space. This is a great long term hold equity wise in my opinion but right now I am looking to short this name for a necessary pullback into $58-$60. It's overbought on the big time frames as you can see highlighted, it is possible it can break out of course but I believe with declining weekly volume this name will resort to some pullback. Also, Bitcoin can have some downside as well which will bring this name down with it. This ticker is volatile and can move 5-8% in either direction in just one session. I am looking for $60p about 3 weeks out, 6/20 date.
WSL
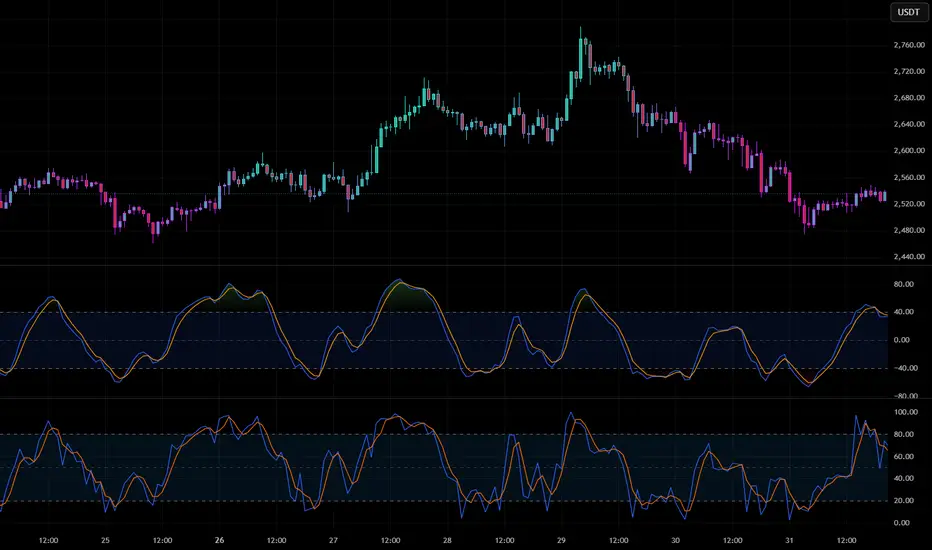
SMI vs. Stochastic: Which One Gives You the Edge?Momentum indicators are essential tools in every trader’s arsenal—but not all are created equal. While the Stochastic Oscillator has been a go-to for decades, the Stochastic Momentum Index (SMI) offers a more refined and reliable way to read market momentum.
In this post, we’ll break down the key differences between these two indicators, how we use them at Xuantify , and why the SMI might just give you the edge you’ve been looking for.
🧠 How We Use It at Xuantify
We’re always looking for tools that offer greater precision and less noise . While the Stochastic Oscillator is one of the most commonly used tools for spotting overbought and oversold conditions, the Stochastic Momentum Index (SMI) gives us a clearer, smoother view of momentum —especially in volatile or choppy markets.
We use the SMI to refine our entries and exits , particularly when trading breakouts or reversals. MEXC:ETHUSDT.P
⭐ Key Features
Stochastic Oscillator : Measures the closing price relative to the high-low range. Simple and responsive. Great for spotting short-term reversals.
Stochastic Momentum Index (SMI) : Measures the distance of the current close from the midpoint of the high-low range. Smoother and more centered around zero. Better at filtering out false signals.
💡 Benefits Compared to Other Indicators
Stochastic Oscillator vs. SMI:
Signal Smoothness: Moderate vs. High
Noise Filtering: Low vs. Excellent
Centered Oscillation: No vs. Yes (around 0)
Best Use Case: Range-bound markets vs. Trend shifts & momentum confirmation
False Signal Risk: Higher vs. Lower
The SMI is especially useful when you want to avoid whipsaws and get a more reliable read on momentum .
⚙️ Settings That Matter
Stochastic Oscillator : %K = 14, %D = 3
SMI : Length = 14, Signal Smoothing = 3, Double Smoothing = 3
You can adjust the SMI smoothing values to match the volatility of the asset— lower smoothing for fast markets , higher for slower ones.
📊 Enhancing Signal Accuracy
Enhance SMI signals by combining them with:
Trend filters like EMAs or Supertrend
Volume confirmation
Support/resistance zones
Divergence spotting for early trend reversals
This layered approach helps us avoid false positives and stay aligned with the broader trend .
🧩 Best Combinations with This Indicator
SMI + EMA Crossovers: Confirm momentum with trend direction
SMI + RSI Divergence: Spot early reversals with confluence
SMI + Volume Profile: Validate momentum near key price levels
⚠️ What to Watch Out For
Lag in fast markets: SMI’s smoothing can delay signals slightly
Over-optimization: Avoid excessive tweaking of parameters
Not ideal alone: Best used with confluence tools for confirmation
🚀 Final Thoughts
The Stochastic Oscillator is a classic for a reason—but the Stochastic Momentum Index is a refined evolution . We’ve found that SMI gives us cleaner signals , better momentum clarity , and fewer false alarms —especially when paired with smart filters.
If you're looking to upgrade your momentum toolkit , the SMI might just be your edge.
🔔 Follow us for more educational insights and strategy breakdowns!
We break down indicators, strategies, and market psychology to help you trade smarter—not harder.
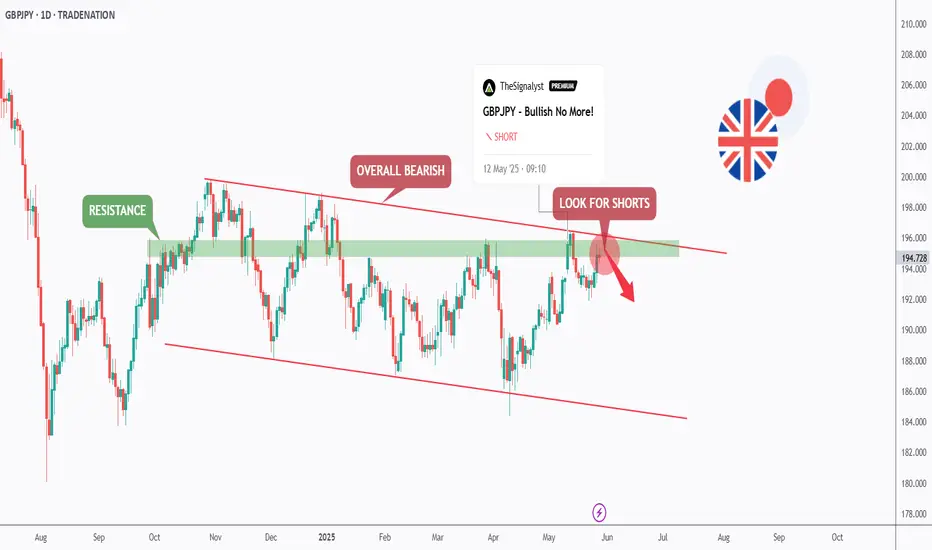
GBPJPY - Bearish Control, Again!Hello TradingView Family / Fellow Traders. This is Richard, also known as theSignalyst.
📉As per our last GBPJPY analysis (attached on the chart), it rejected the upper red trendline and traded lower.
What's next?
GBPJPY is currently retesting the upper bound of the falling red channel again.
Moreover, the green zone is a strong structure and resistance.
🏹 Thus, the highlighted red circle is a strong area to look for sell setups as it is the intersection of structure and upper red trendline acting as a non-horizontal resistance.
📚 As per my trading style:
As #GBPJPY is around the red circle zone, I will be looking for bearish reversal setups (like a double top pattern, trendline break , and so on...)
📚 Always follow your trading plan regarding entry, risk management, and trade management.
Good luck!
All Strategies Are Good; If Managed Properly!
~Rich
Disclosure: I am part of Trade Nation's Influencer program and receive a monthly fee for using their TradingView charts in my analysis.
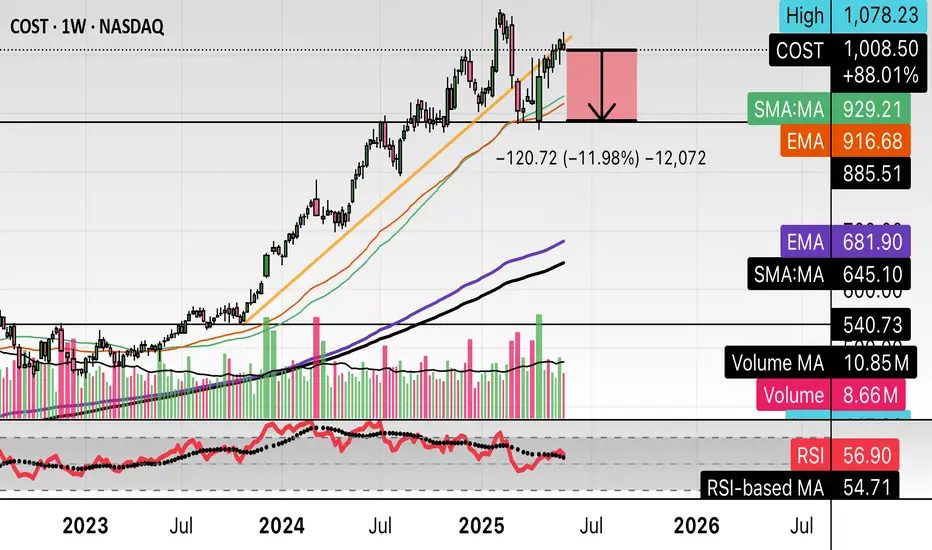
$COST earnings short, possible uptrend selloff(Sorry for mobile charts/posts)
NASDAQ:COST Hello, looking at multiple time frames on Costco I am going to take a stab at a short. This name isn’t unfamiliar with big moves so an 8% to 10% move could take place here on earnings forecast. Granted, they could not divulge any details but I think that wouldn’t be good and amidst the tariff rhetoric which has been the narrative for retail names could add headwind. 6/6 $900p is what I will take a stab at. 1 contract will suffice as there could be a good R/R especially if you hedge. If you look at the Monthly chart this thing is bought up heavily. I am going to try and get a good entry so I’m not risking what I may feel is too much on an earnings “lotto.” $100-$150 on a contract will be good in my book.
WSL