Bearish Crab at the PCZ with divergenceBearish Crab at the PCZ with MACD bearish Divergence and showing a lower high and lower low locally also coming off of overbought on the RSI
Overbought

CHFJPY - TRIO Retest!CHFJPY is overall bullish trading inside the blue and green daily channels.
I find the upper bound interesting as it is the intersection of the upper daily trendlines in green and blue, and the upper weekly trendline in brown.
The highlighted purple circle is a strong area to look for sell setups as it is the intersection of three trendlines. Which I call " TRIO RETEST "
As per my trading style:
As CHFJPY approaches the purple circle area, I will be looking for reversal sell setups on lower timeframes (like a double top pattern, trendline break, and so on...)
Always follow your trading plan regarding entry, risk management, and trade management.
Good luck!
All Strategies Are Good; If Managed Properly!
~Rich

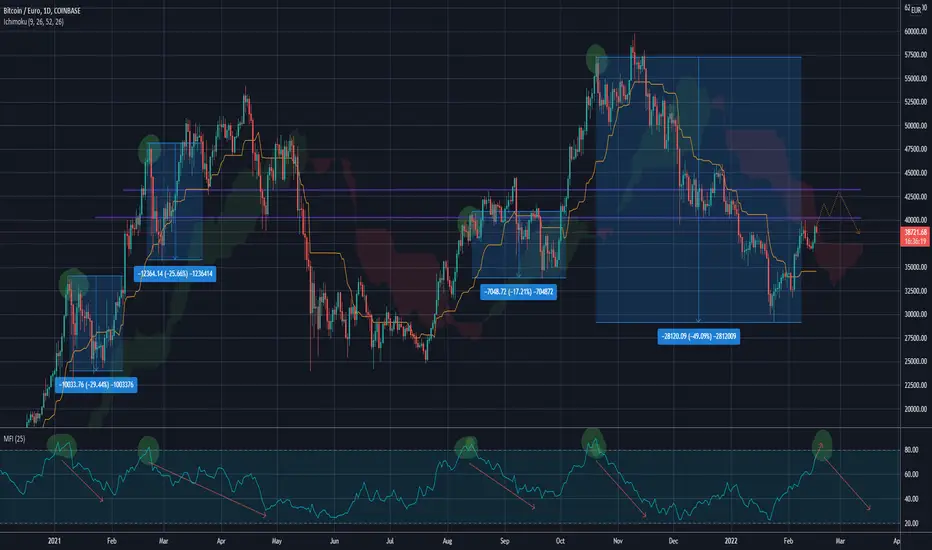
BTC BearishSince the fear of extraordinary high inflation and the corresponding provisions against it are shocking investor's sentiment, I want to warn from "unexpected happenings" in the near future.
I would not believe, that current levels will be held. We might see a continuation of up's and down's for a few weeks, but after March (point of time where the FED will stop its balance sheet expansion), I can't see prices being sustained at this level.
The Money Flow Index is near it's overbought range, which indicates a broader top-ish area, as well as we are still below the Cloud.
Passiveness is recommended.

MULTIPLE TIMEFRAME ANALYSISHaving Received countless of Approach on How I look at the Market to gain the Right Directional Bias, here I laid it out bear for your digestion.
I will like to say thank you for reading all my previous post and do not hesitate to comment or ask question.
TOP DOWN ANALYSIS APPROACH
This makes it easier to know which Direction you want to plan your trade in alignment to the HIGHER TIME FRAME.
I hope this will help your ongoing trader development and takes out those confusion when it comes to organising your bias,when to trade and when to be patient and when to start looking for opportunities on lower timeframe to then reduce your risk and keep you focus.
I will start from the Monthly Chart on ONEUSD a cryptocurrency called HARMONY that I believe will 10X it’s current price as we progress in Blockchain takeover
MONTHLY CHART
Monthly TimeFrame Blue 12EMA
A Support that act like a trendline
WEEKLY CHART
Same like Monthly 12EMA
But here Orange 36EMA on Weekly:A
Retracement level to consider adding new
Position in the Direction of the HTF
We saw a slowing week on the last red
That leads to the last week bounce
DAILY CHART
36EMA rejection Bounce on DAILY
Cautious area to take profit
Look for Rejection
Look to BUY Cheaper on OTF
8 HOURLY CHART
36EMA on 8HR with a Candlestick or
PRICE ACTION to look for the Discounted
LONGS and 2 good Confluences
Candlesticks HAMMER Price Action +
36EMA bounce
In Between the 200EMA
633EMA is a VOLATILITY GAP
This is where I observably expect
price to bounce Couple times in
betweenbefore we can make a directional
headway.
A VOLATILE REGION You can identify
in any market as price proceeds. So this gives you
a readiness awareness of what to expect and
for how long. 8HOURS represent a whole trading
SESSION
6HOUR CHART
Higher High 200EMA Selloff
on 6hr Corresponds the36EMA
on DAILY
BULLISH ENGULFING on 6hr 36EMA
after a potential longer term 8hr
(All Asian Session) Price Bounce
And maintaining of Higher Low
Price Structure
4HOUR CHART
Short Term Break of Structure (BOS) on 4hr
Chart is a good caution to let us know that
price won't just rise so easily higher
2 HOUR CHART
For Price to Change Direction
We have seen 1st 2hrs of hitting
200EMA rejection
Another 2hours of Price Slowing
without making a new low follow by 2hrs
of another Price Slowing after a Preceding
Downward Selloff Spiral
A clear indication of good 6hrs of consolidation
That eventually break out higher.Now we have
a good reason to look for BUY OPPS on
Smaller TF
The lower timeframe analysis will follow on hourly to minute charts.

ETH Overbought - Corrective WaveCrypto markets have seen a nice pump in the past week, but ETH is currently overbought on RSI at the 6H, 4H, 2H and 1H, and has bumped heads with the long downward trendline originating at the start of December.
Medium term this may be the start of a big reversal that sees us heading back up, but in the short term I expect we will see this trendline acting as resistance and ETH to take a breather, stepping back to the 2750-2800 level, which sits between the 0.236 and 0.382 Fib levels.

EURNZD - OVERBOUGHT - big correction lower expected ?Hello Traders
Here is a new SELL Scenario, a big drop is expected before going up until 25 february, bullish will be exhausted soon ?
Will EURNZD follow its seasonal pattern lower again this year ?
✅ EUR / NZD SELL between @1.70900 and @1.71300
TP1 @1.71100
TP2 @1.70900
TP3 @1.70700
SL @1.73500
JamdeJam will not accept any liability for loss or damage as a result of
reliance on the information contained within this channel including

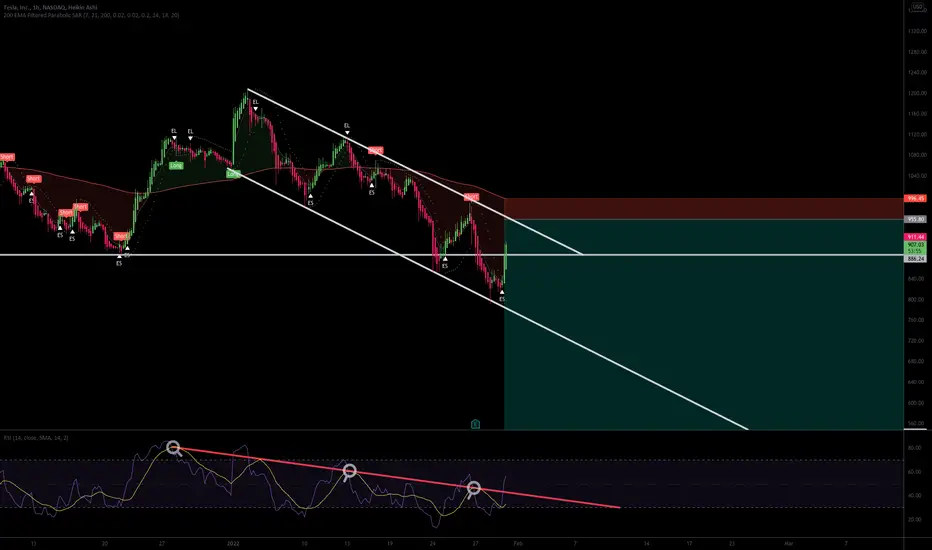
Risky play, TSLA in a downtrendThe trend is your friend.
Tesla looks like it's continuing the downtrend, As much as I admire Musk and his vision, stock price is severely overvalued and needs to regress to mean.
Every bounce towards the upper trendline is an opportunity, my ideal entry is around $935-950. TP sub $700 then set trailing SL,
RSI downtrend too,.
(Not financial advice, just some logical opinions)
NASDAQ:TSLA
BTCUSD two scenario, watch out for break outBTCUSD is between resistance level 38322 and support level 37521.
if BTCUSD breaks and close below 37521 and the trend line, wait for pullback or retest of 37521 and go short target is 35550.
if BTCUSD fails to breaks below 37521 and the trend line and breaks above 38322 wait for retest for long position but 38322 is strong resistance level which i think BTCUSD will need some strength to break which is the reason why BTCUSD has to go down to pick up some strength.

The 4 Hour MACD Has Worked Great LatelyI am showing the resistance "zones" for the hourly /ES. But the 4 hour /ES is already really overbought. It has been reliable for buy and sell signals lately.

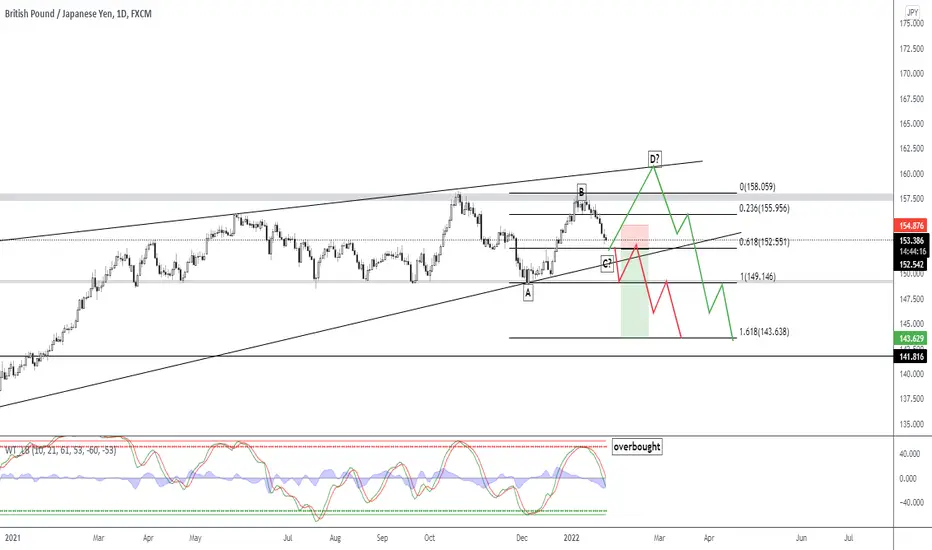
GBP/JPY SELL ?On a Monthly/Weekly TF it seems like the market will be rising again. But im looking for sell opportunities on lower TF's. I got two possibilities first one is that the market will be pushing down for now on or make a push to the upside and form a ABCD Pattern and than drop again. What do you guys think?
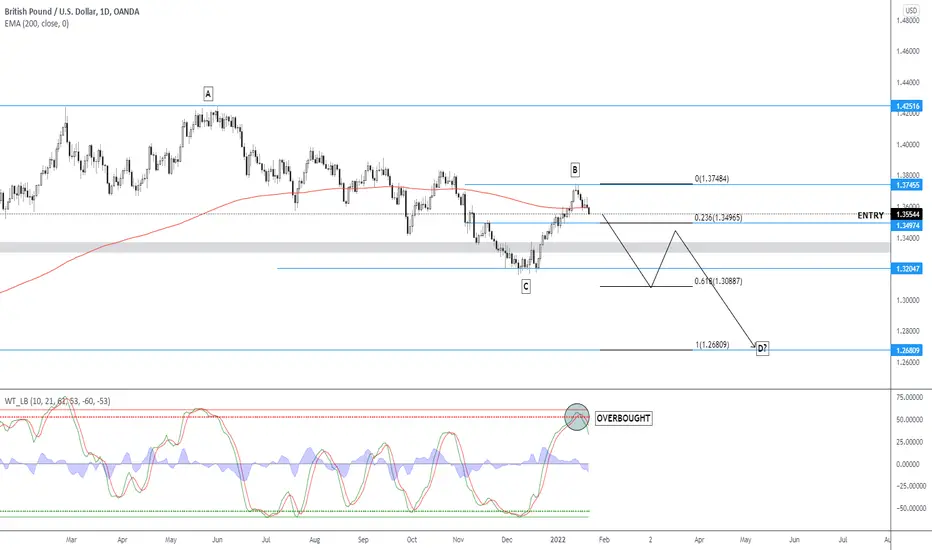
GBP/USD DAILY! Price is over bought, market might form a abcd pattern. Waiting for the push to the downside.
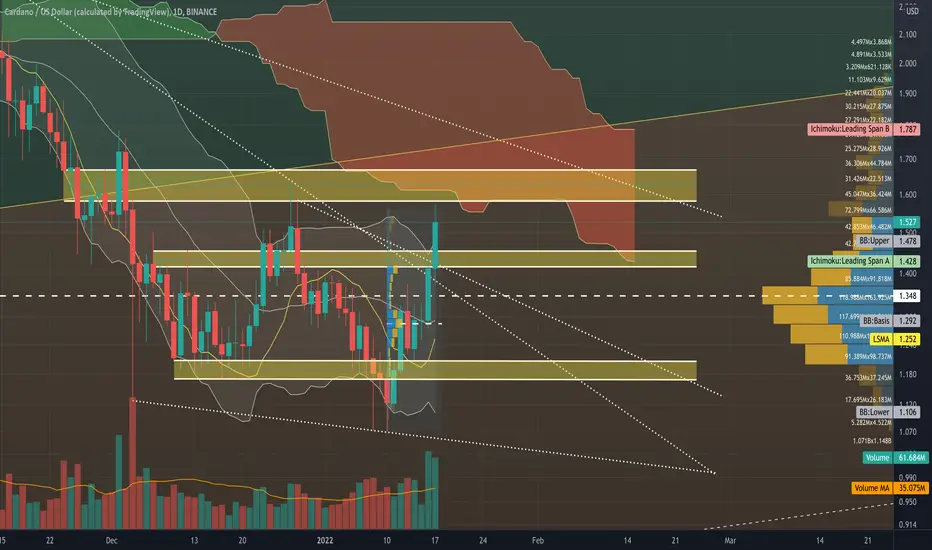
ADA/USD - updateWe have seen a very nice rise with ADAUSD since the 11th Jan with increasing Volume on this Binance 1d chart. The only issue at the moment is that BTC is dragging everything down with it so ADA is having trouble maintaining its rise at the moment.
ADA is above its Bollinger Bands Middle Band Basis 20 Period SMA and note that we have expansion of the Upper and Lower Bands and this expansion is for positive momentum. Not that ADA is above its Bollinger Bands Upper band so a retracement back under the Upper Band shouldn’t come as a surprise.
Note that ADA is still above its Least Squares Moving Average (LSMA) for this 1d timeframe.
ADA is still in the Bearish Zone of the Ichimoku Cloud but note that ADA has risen and is now getting close to the Leading Span A (Senkou Span A) resistance Level.
Note that ADA is still above its Longterm Pitchfork Median Line on this 1d timeframe.
ADA is still above its Volume Profile Fixed Range Point of Control (VPFR POC) for the fixed range of 8x daily candles that i have selected.
ADA is still above its Volume Profile Visible Range Point of Control (VPVR POC) for this charts Visible Range.
Note that Volume has increased and yesterday’s Volume Bar closed above its Volume 20 Period Moving Average and today’s Volume Bar will also close above it.
If we look at the Moving Average Convergence Diveragnce (MACD), we can see that the MACD Line (Blue Line) has crossed back over the Signal Line (Orange Line) generating a Buy Signal on the 13th-14th Jan and note that the MACD Line (Blue Line) is very close to crossing back over the 0.0 Base Line into the Positive Zone of the MACD indicator. Note that the MACD Line (Blue Line) has not been in the Positive Zone above the 0.0 Base Line since the 17th Sept 2021 so this will be an important move.
If we look at the Average Directional Index (ADX DI) we can see that the +DI (Green Line) is at 25.30 and has crossed back over the -DI (Red Line) which is at 14.28. this means that Positive Momentum is stronger then Negative Momentum on this 1d timeframe. Note that the Trend Strength is slightly weak with the ADX (Orange Line) at 18.94 under it s 9 Period EMA (White Line) which is at 19.85 and under the 20 Threshold. Note that the ADX (Orange Line) is pointing upwards so we may see another massive increased positive rise if the ADX (Orange Line) crosses back above the 9 Period EMA (White Line) and the 20 Threshold level.
If we look at the Stochastic Indicator (STOCH) we can see that the %K (Blue Line) is in the Overbought Zone of this indicator. The %K (Blue Line) is pointing downwards but it is still above its %D (Orange Line). Be on the lookout for if the %K (Blue Line) stays above the %D (Orange Line) or crosses back below it. Note that because the %K (Blue Line) is in the Overbought Zone that doesn't see that it will drop out of it because the %K (Blue Line) can range sideways in the Overbought Zone for a prolonged period of time.
Here is a wider look at this 1d chart.
With such a rise it is not uncommon for the price to drop back under its Upper Bollinger Band before continuing upwards. If Upwards Momentum continues being strong then we may see ADA walk up along its Upper Band for a few days.
As usual with BTC dropping, BTC is dragging everything down with it and slowing ADA’s rise, so we have to keep an eye on what BTC is doing because if BTC drops under $40K, then that will continue to drag ADA and all other alts down with it.
I hope this is helpful with your trading and hodl-ing.
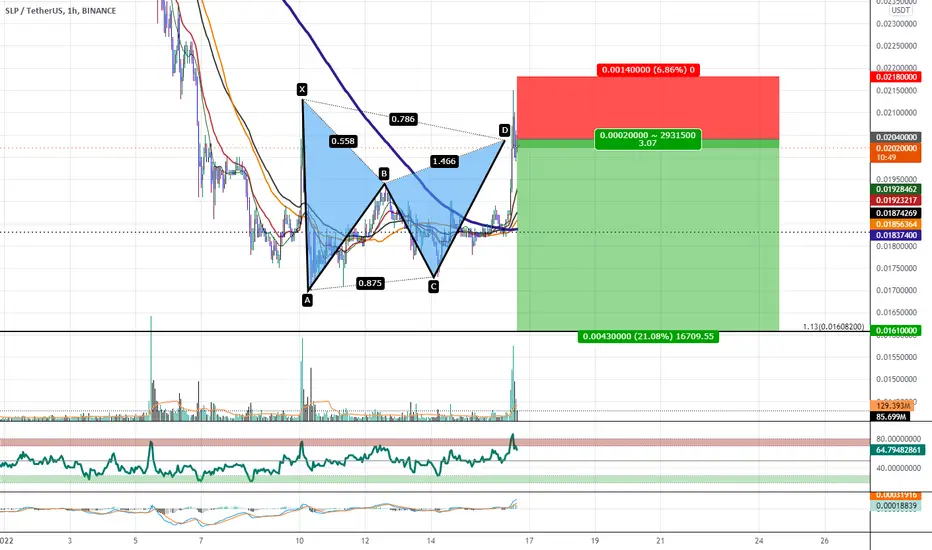
Bearish Gartley May Be In Play After a Terminal Bar RejectionI will be targeting the major 1.13 extension of SLP's Lifetime Overall Trend for profit taking on this Hourly Bearish Gartley.
Price briefly peaked above the PCZ to get Overbought on the RSI but quickly settled back below the PCZ of the Harmonic this is the type of stuff we usually see after a Terminal Bar Rejection.
I will be entering the trade with a stop loss above the high
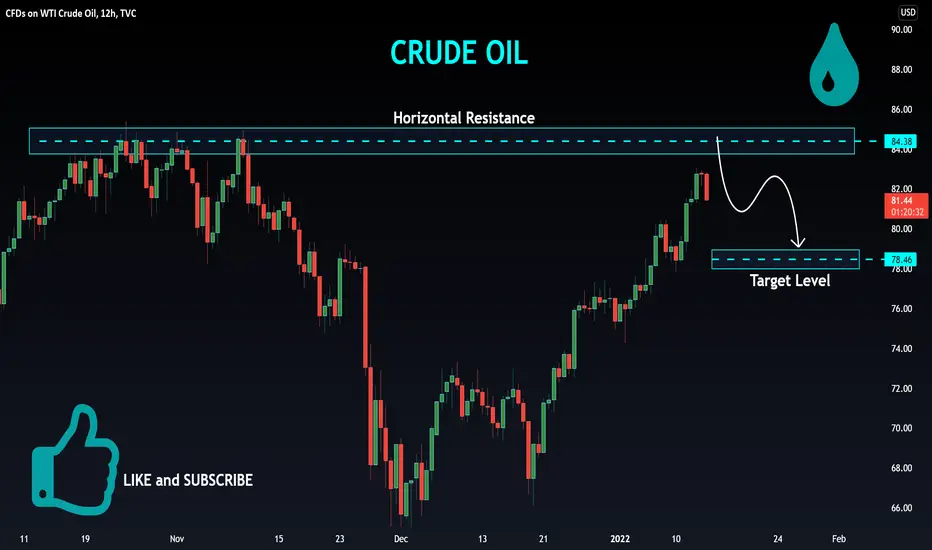
CRUDE OIL Local Short! Sell!
Hello,Traders!
CRUDE OIL is trading in an uptrend
But the price is about to hit the strong resistance level
And as oil looks locally oversold I would be
Expecting a local bearish correction
Towards the target below
Sell!
Like, comment and subscribe to boost your trading!
See other ideas below too!
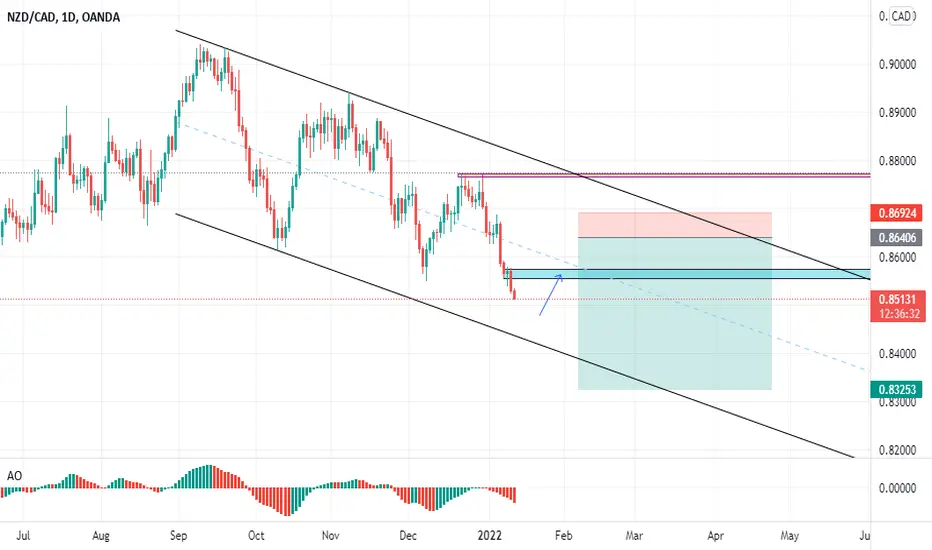
NZDCAD || Enthusiastic CADTalk about false breakout of channel.
CAD seems to be on overbought across all pairs.
I'll rather wait for a new entry than follow this present trend.
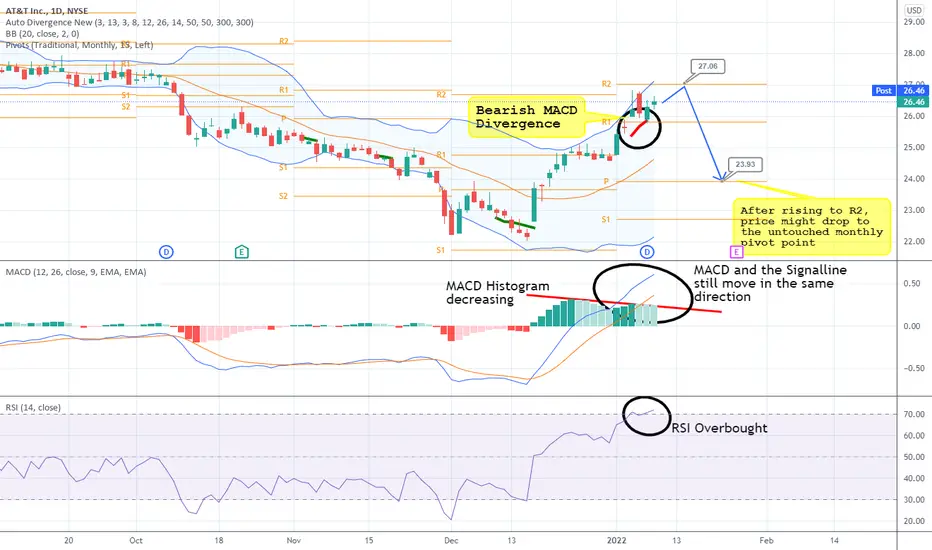
AT&T Bearish DivergenceThere's a bearish MACD Divergence on the AT&T daily chart. And to confirm this signal: RSI hasn't been in the overbought area for a while - but now it is.
Looking at the MACD, we see that MACD and the Signal Line are still moving in the same direction - to indicate a trend reversal we would need to see the MACD cross the signal line from above - so there's no bearish signal yet - BUT - the MACD histogram shows two hills with the second one (the newer one) being not that big as the first one. This might indicate that the price will still rise a bit to the resistance at 27.06 (R2) and then - after MACD crossed the Signal Line - it will fall to the monthly Pivot Point at 23.93.
Usually, the Pivot Points get touched by the price in the current or in one of the following time periods. So there are multiple Indicators to second the bearish Signal.
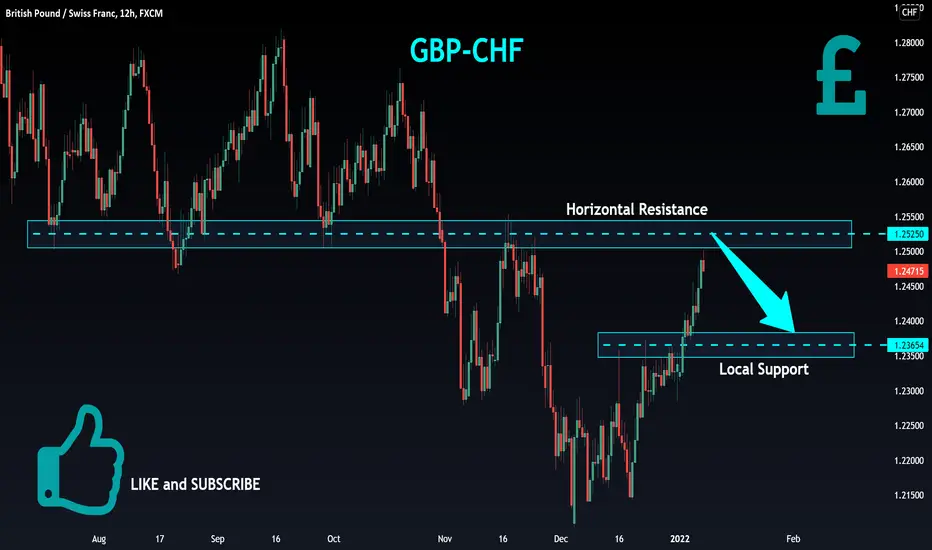
GBP-CHF Will Go Down! Sell
Hello,Traders!
GBP-CHF is retesing a horizontal resistance level
And as the pair went up without pullbacks recently
It looks overboght to me, so I am expecting
A bearish correction and a local move down
From the resistance to retest a support below
Sell!
Like, comment and subscribe to boost your trading!
See other ideas below too!
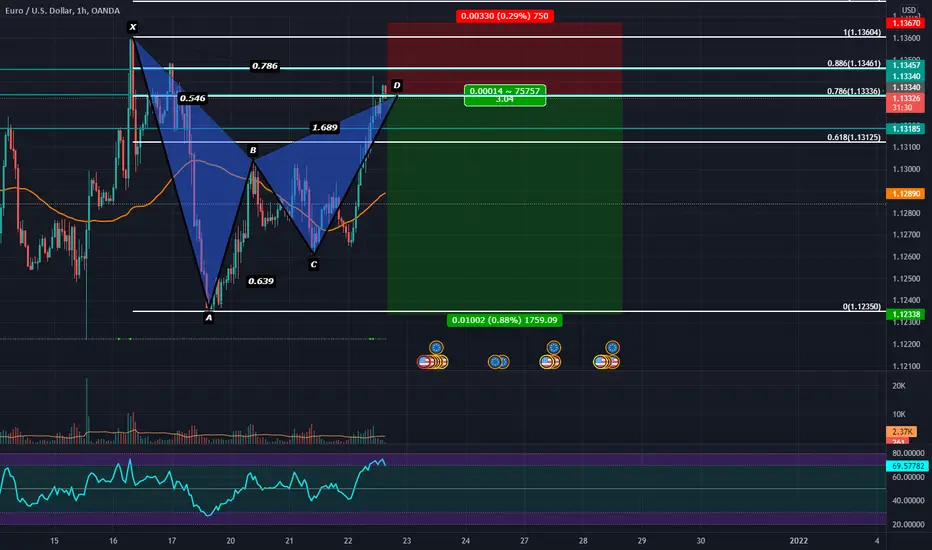
1 HR Bearish Gartley on the EUR/USDSimilarly to the AUDUSD there is a Bearish Harmonic here on the Hourly but instead if a Bat we seem to have more of a Gartley Here near Overbought Levels.
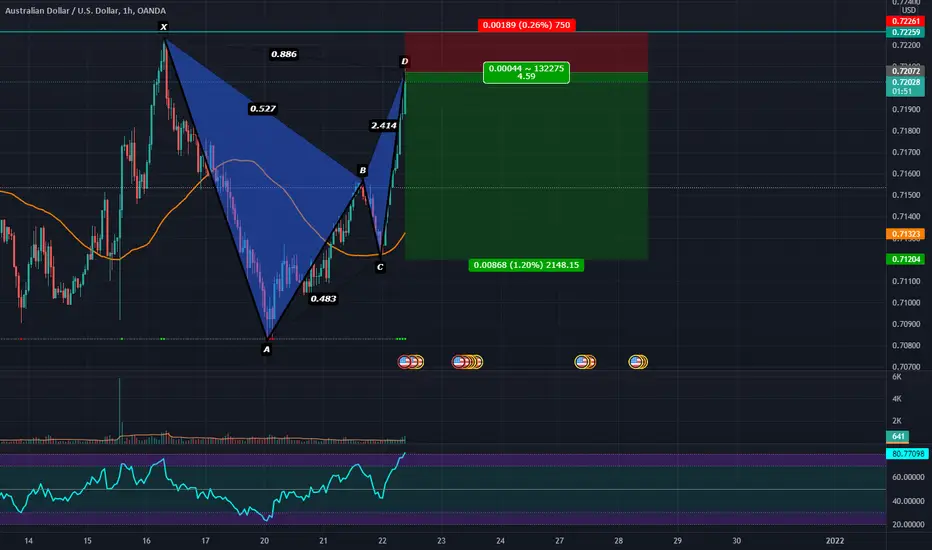
Bearish Bat Visible on the 1 Hour at Overbought on RSIWill put my stop above X and Take profit at C I like that the RSI is a little bit Exhausted in Confluence with this harmonic level.
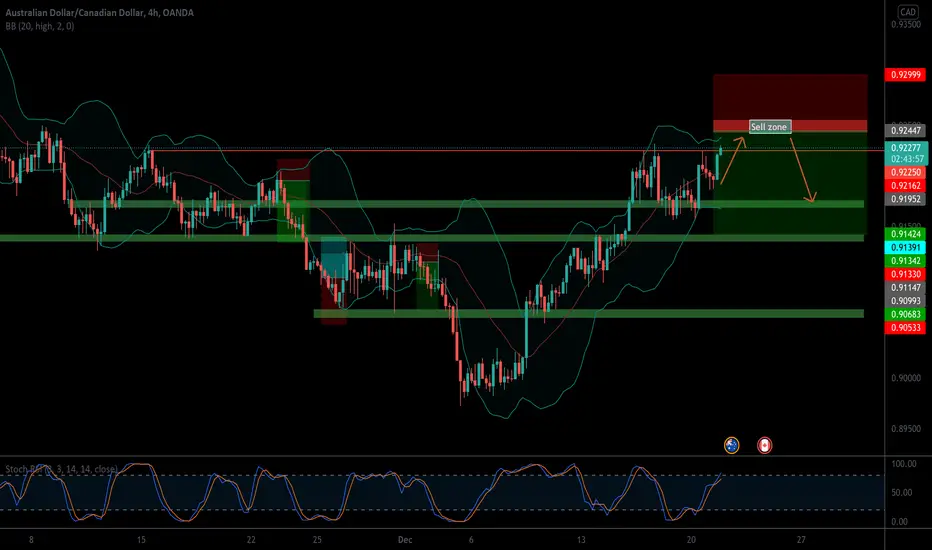
AUD CAD Short Idea AUDCAD has been in a decent uptrend for most of December, however, it has started to approach a key resistance level on the 4hr time frame. The key level mentioned is the 0.925 level which is the high of early November. The RSI indicators on the daily/4hr time frame show an overbought bias, coupled with the approach to the key level mentioned above leads me to think that the price will drop from here. The initial target of this trade is located at the 0.9175 area, following this then the next target lies at 0.9143. The stop-loss area for this trade is at the 0.93 level. A likely scenario that I'm looking for sells near to the 0.925 area.
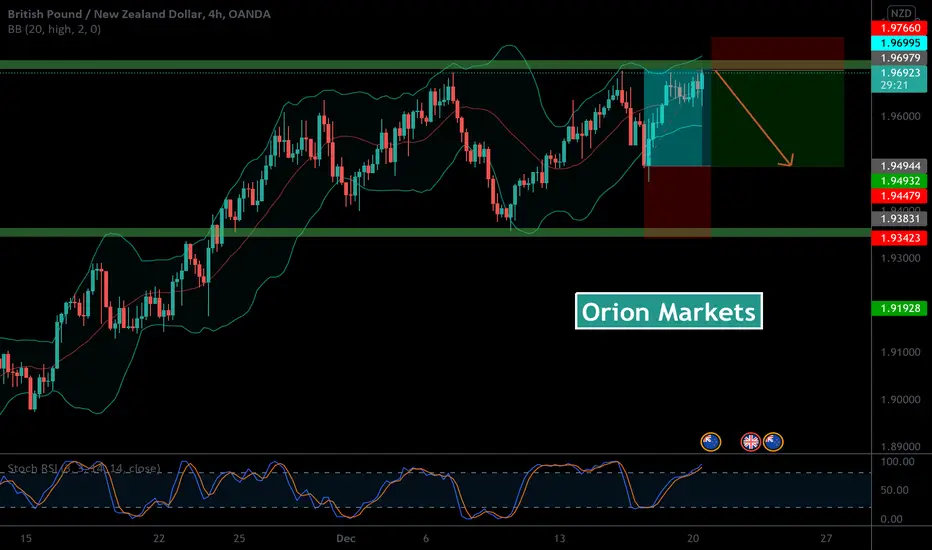
GBPNZD Short Idea Since breaking the 1.936 level, there have been two failed attempts to break the key resistance level of 1.97 (October 11th high). The 1.936 level is now acting as a support zone which price respected earlier on in December. As there hasn't been a convincing break of this level it's very likely that the price will fall and re-test the support level mentioned of 1.936. The RSI levels are in overbought conditions at 89.36 on the 4hr chart, suggesting that a drop in price is probable. The initial target of this trade is located at the 1.95 level, proceeding this would lead to the previous support level of 1.936. The stop-loss area is at 1.975, just above October high.
GBPCAD Sell OpportunityPrice is at an interesting QM level. After price rallied up, it came down, breaking important swings on the way down before retracing to the QM level. I think price is poised to go down to the target.
