LC heavy overboughtLC had a big pump today and offers a nice short opportunity. I assume it will correct down to the next support slowly.
Overbought

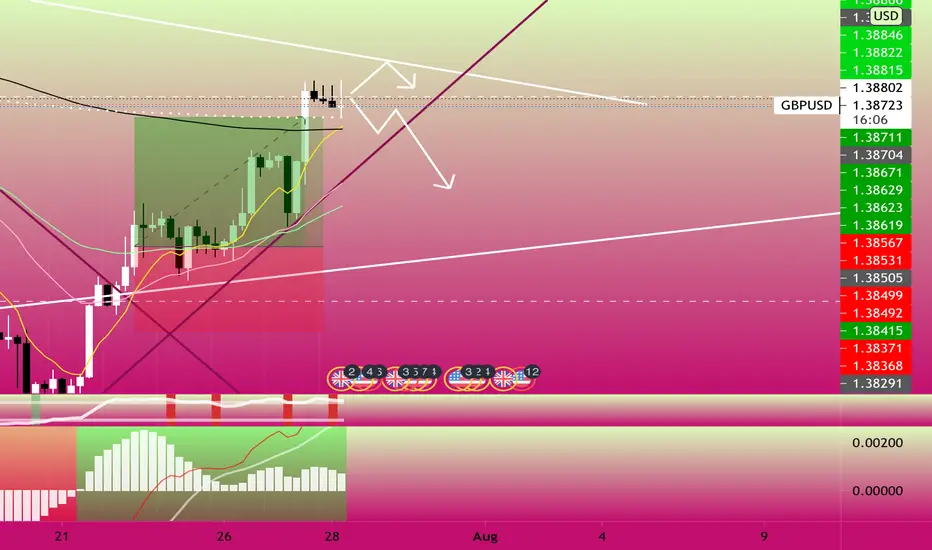
Gbpusd Possible sell for 100+ pips
GBPUSD analysis: after our recent 112 pip win we are now seeing a test of the resistance line. The bulls that rode this with me had a similar TP and now that it hit most of us have sold causing exhaustion in this pair. On top of it being overbought on the 4 hour and on a continuation of a downtrend, we are looking for a sell. I have placed a maroon trend line to confirm the push down. If price breaks this maroon trend line we will see a bear market. This could be at least another 100 pips downwards for now we wait.
We don’t chase the market so be patient with this move.
Dark Cloud Cover on daily with Overbought RSI and Gap BelowThis is a second attempt at finding a short opportunity on MRNA after the first failed i have waited and i now see a new signal.
I expect that we will see a daily reversal in MRNA from here in respect to the Dark Cloud Cover candle Close we just got on the daily. At minimum we will see a reversal to fill the gap below but at the worst we will go all the way down to or weekly support level i highlighted in the chart.

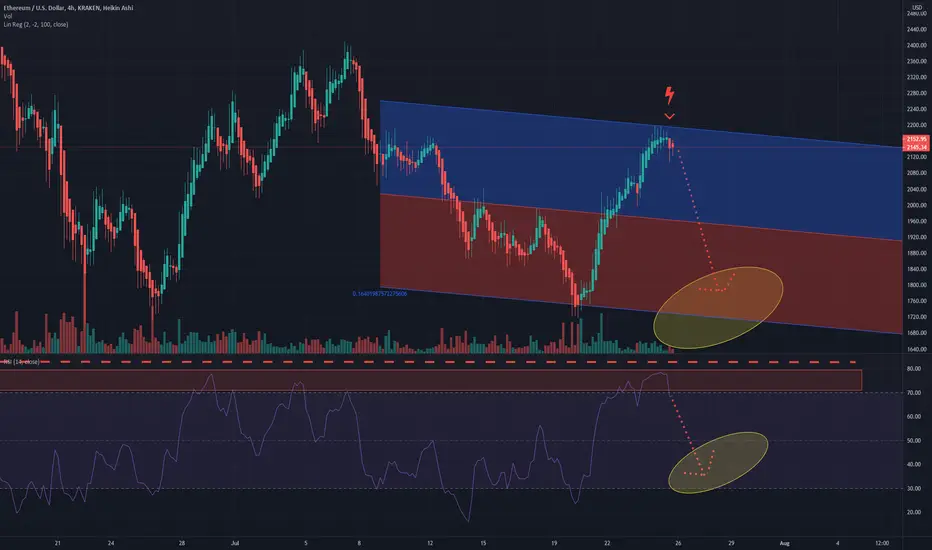
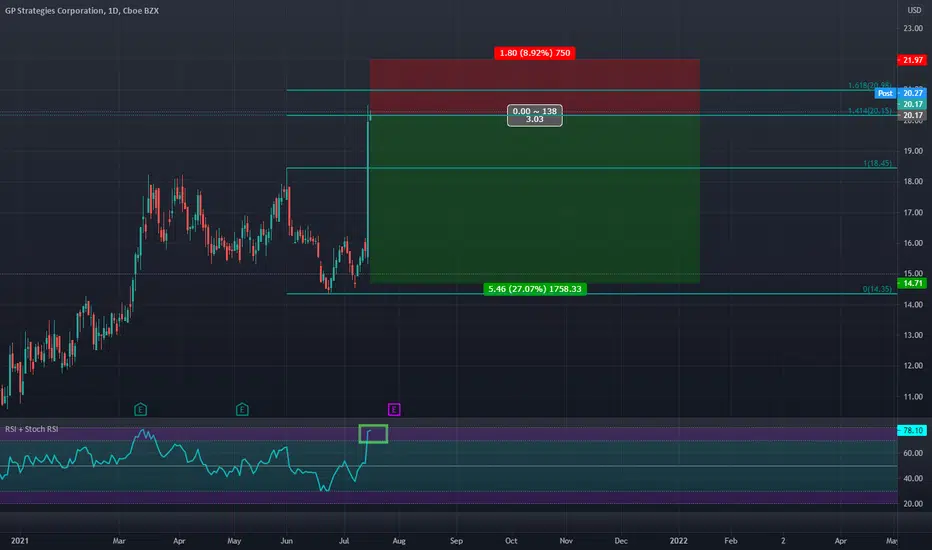
All-in Short 🔻 Double: RSI Resistance, Channel ResistanceAll-in Short 🔻 Double: RSI Resistance, Channel Resistance
🔴 KEY POINTS:
- RSI is strongly overbought
- Momentum hit RSI Resistance
- Price Action hit Channel Resistance
- Machine Learning (Artificial Intelligence, Linear Regression) says upcoming Resistance
- Chart Pattern: This Technical Indicator Variation worked 100% in the past
We've opened short. All-in.
MRNA Low Risk Short PositionMRNA is hillariously overbought, with stochastics, EMA's, bollingerbands, MACD, and RSI on the daily chart all showing prime conditions for a short position.
Here's the chart showing those indicators:
I am going to be watching this on Monday and throughout the week, looking for a short position entrance. I played it on Tuesday for a nice $50/ share short with similar technical indicators. Hoping to duplicate that again this week. Might go debit, might go credit, not entirely sure how I'll play this yet. IVR is somewhat high for a credit trade, and since they have earnings coming up, I imagine that will continue to increase. For that reason, a debit trade might be the winner here. That said, if IVR collapses, that will hurt my trade.
Still formulating the exact plan, but I am going to play MRNA short in some capacity.
I am anticipating a retracement to the $300.00 / level in the short term at $250.00 in the next few months.

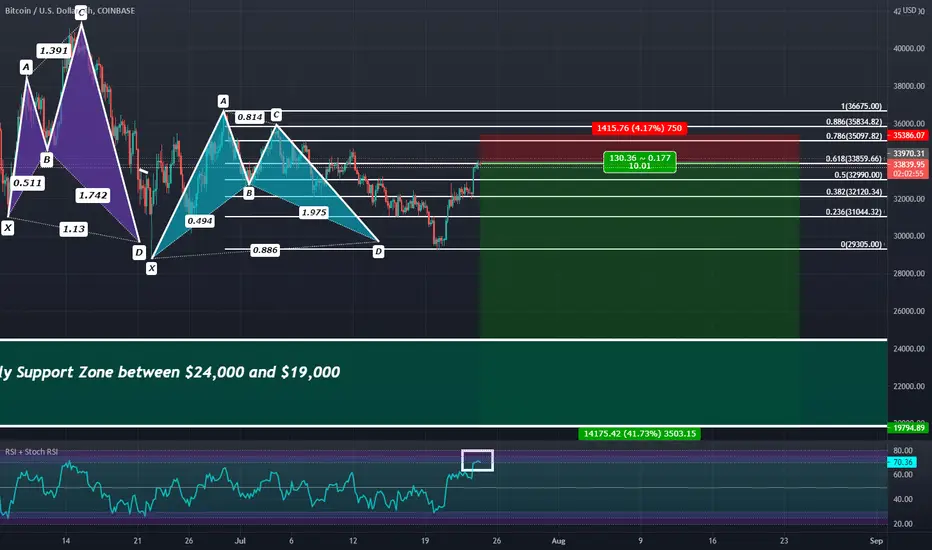
4HR Overbought at a 0.618 Retrace: My Bearish OutlookIf we bearishly reverse here and make yet another lower high we could see Bitcoin break below $28,000 and go all the way down to the daily support levels of $24,000 and $19,000
3 HOUR REVERSAL CANDLE IN CONFLUENCE WITH OVERBOUGHT CONDITIONS Hello traders,
3 hour chart here.
Everyone is calling for a full blown reversal after just one bullish daily candle.....this is how traders get sucked into buying higher during bear markets while big money is getting there shorts filled by you.
Overbought conditions, and a reversal candle with a massive doji.
25x long liquidations around $30,888 - $31,111.
Stay safe, and never chase green candles. Same goes for red candles.
Why?
Liquidations/stop hunts will always come before the next major move, it's just how these markets we're designed to move and flow.

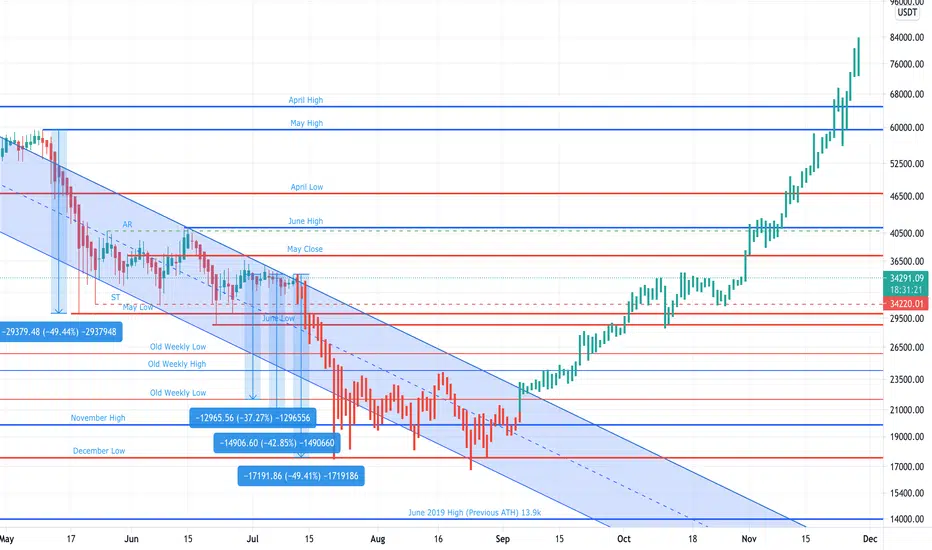
I sold My Car And I'm NOT Buying Bitcoin!My wife just got a new job and we now have a company car! There's no point in keeping our car, because it's a deprecating asset. However, as much as i want to buy more Bitcoin with this cash, i'm just not buying now and here's why;
If you look at the downward channel, you'll see that the last time price went above, ended up with a mark down. It's way too risky to buy here right now. This is a bull trap at it's best.
So, let's review my bullish case;
1- Break the triangle (and make sure it's not a bull trap)
2- Break $37k
3- Break $41k
Even if the triangle looks like being violated, it just means it's in the overbought territory. Whenever i bought the overbought condition, i lost. Instead, i'll assume this violation is a bull trap and wait for the next oversold condition which is below 22k! That's 35% down from current price and once it reaches there with a climactic action, it won't stop until everyone believes Bitcoin is dead.
Why have a nightmare?
So, here's the scenario i'm buying;
Given we are in redistribution, not accumulation;
1- This current moment is last point of supply (LPSY)
2- Markdown will follow down to December 2020 lows at $17.500
3- Start sideways accumulation verified with net buying activity on the volume profile
4- The spring event occurs and verifies with change of character, stong volume
5- I buy (Else, i wait for another drop)
6- Price rallies to 80k in November
7- Evaluate sideways action whether it's distribution or re-accumulation.
8- Sell with 4x profit if it's redistribution, else ride until 100k and above!
Why 80k? Read my recent analysis:
Ofcourse it's too early to give price target, we will need to calculate the horizontal count during the real accumulation and adjust our estimation, but so far this is what i can say.
Until then friends, i'm sitting on cash enjoying stable daily interest.
DON'T FOMO, you can always buy later.
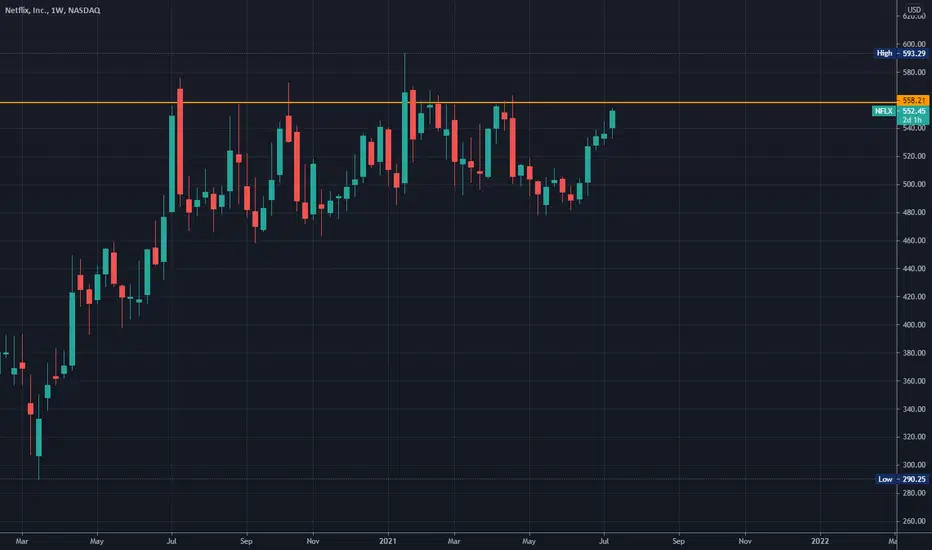
NFLX Low Risk Short PositionNFLX has been trading in a range for many months, as we can see by this weekly chart here:
Stochastics on the daily chart are showing it as heavily overbought, with an RSI of about 85, likely in anticipation of earnings which come out in 6 days. Historically, NFLX sells off about 80% of the time post earnings, usually quite steeply, with an average sell-off of between $50-60 dollars within the week that follows earnings.
Here's a daily chart with stochastics visible:
Barring a few temporary outlying moves to the outer extremities of its range, I believe NFLX will either:
1) Push up towards and then reject at the $566 level and then retrace back down towards $515.00 post earnings.
2) Falter post earnings and retrace to more "typical" RSI and stochastic levels prior to earning hitting.
3) (Hopefully not) push outside its trading range (difficult to imagine this scenario actually happening) and form new highs above its existing range.
I am currently in an Iron Condor on NFLX with 570 and 490 short strikes. It is leaning bearish at the moment, but a move back down downwards 515 and a crush of implied volatility will substantially help my position. I believe both are likely to happen in the current market environment.
--------------
If you were to enter NFLX short, you might consider it around the $566 level, assuming it pushes that high. You could accomplish this with a call credit spread which would give you the benefit of IV crush, assuming volatility decreases (which it would, if the price fell off steeply.)
You could also take a bearish debit spread, but that will struggle with volatility collapse as it's a BTO position.
-------------
Whatever happens, I'll be curious to watch NFLX as it develops. I do not think it's current price behavior is sustainable.
IDK what's going on here but i think it needs to be reversedRecently we had a big bullish day and now it's prolly time for a sizeable correction.
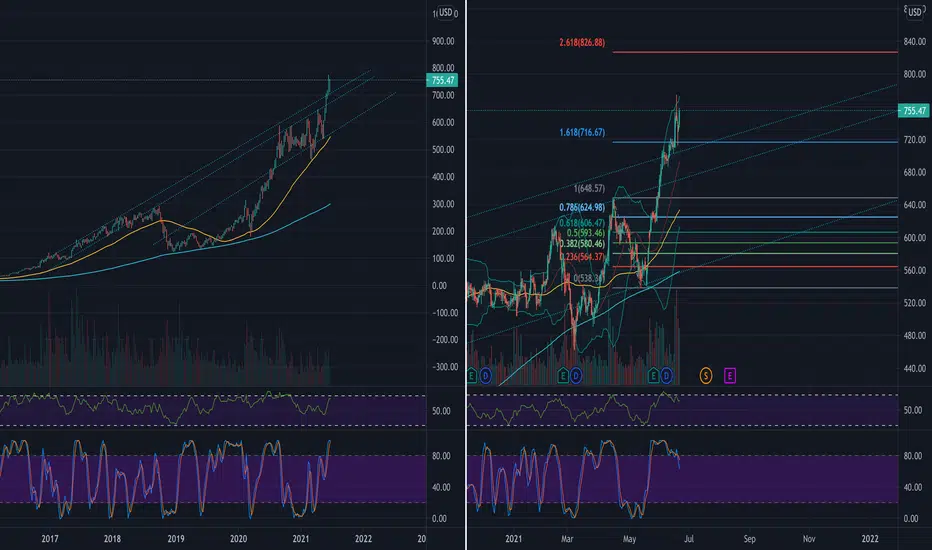
NVDA Crash Coming? Big Sell Opportunity? 600 incoming??Ive been looking into two stocks recently, NVDA and SPY, and they both look extremely overbought. I mention SPY only because NVDA is apart of the S & P 500, Ill upload my SPY short analysis soon.
However if you look into the weekly chart on the left it has broken out of an of what appears to be an already overbought channel. This channel dates back to 2018, where the MFI indicated overbought before a major dip under the 200 MA. Looking at where its at now, its above the channel where it was deemed to be oversold in 2018.
Looking at the daily chart on the right NVDA has been riding up the Bollinger Bands for the past month at an almost unsustainable rate causing the bands to have a range from $610 to $770. This is dangerous for the stock so all traders should trade with caution.
the MFI has just flipped downward which shows the money flow is starting to decrease, as well as the stoch RSI. The stock is also getting far from its 50 MA which is at $635 at the time of writing. Lastly looking at the fib retracement have broken past the 1.618 level. From 540 in May it has went straight up breaking threw 7 levels only retesting the .786 level at $625. Not to mention its up over 100% over the past year and even more since the corona crash.
I predict the 1.618 level wont hold for long and we should see a $650 NVDA in the near future, that is where we topped on April 15th, the 1 level on the fib retreacement, and around where the 50 MA should be soon. If it doesnt hold strong on that level we should be retesting the .786 level where it showed strong support flipped resistance before breaking through. If it doesnt hold around the 625 area then it appears the strongest level of support is the .5 level around 593. This could take a few weeks to develop. Trade with caution!
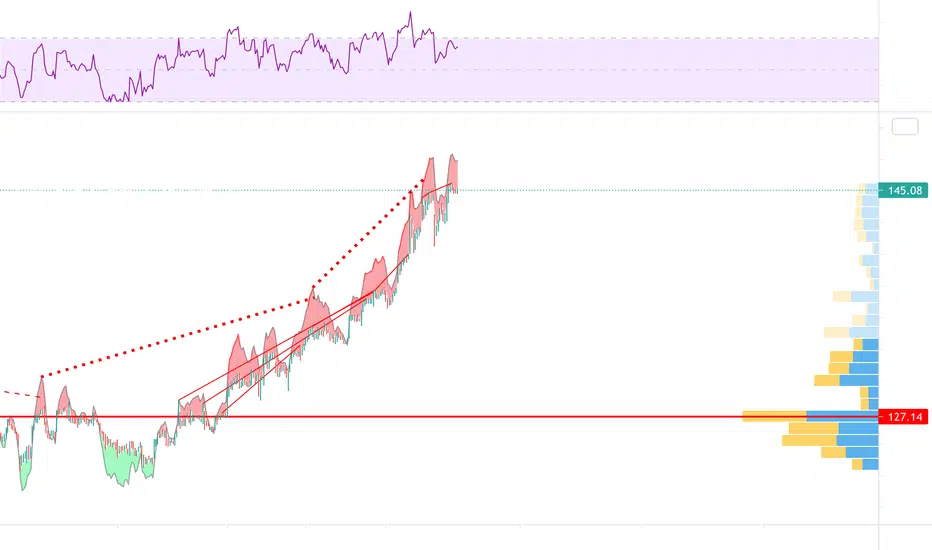
Steep Correction To Come I am a huge fan of Apple and their business model, but this is technical analysis and the "red" flags are screaming that it is time for a sharp correction.
Indicators:
I. Red trend lines signaling future decline ( trend lines are from the Knoxville Divergence indicator and help foresee growing divergence often times ahead of MACD and traditional sell signals
II. High RSi shows that Apple is extremely overbought
III. Visible range shows the prime trading activity price is 127.14
IV. Divergence+ shows a red cloud above the most recent candles indicating high levels of bearish divergence
Feedback:
Let me know your thoughts in the comments below, this analysis has been used previously and is extremely accurate.
Previous analysis linked below
As requested, my thoughts about AMD! 👍As @adamh6847 requested, I’ll share my insights about AMD with you guys!
Since it lost the red line and it did several bearish divergences on the RSI, AMD is falling, but what to expect next?
Now the RSI is pretty oversold, indicating a possible rally in the 30min, maybe to the 92 again. But we have no bullish confirmation, just a possible rally.
The fact we are just above the 20ma in the 4h chart might confirm the rally thesis, but AMD is still having some problems around. Unless we see a very good reversal pattern around, the chances are that AMD will drop to the 85 – 87s area.
Today’s movement was very bearish, and if we don’t see something great above this 20ma, then it’ll just fall to our supports. Until recently, the RSI was very overbought, and this was another warning sign for us.
We have no buy sign, but I see no reason to sell it, as we are already close to the supports. I think we should wait for more patterns.
If you liked this trading idea, remember to click on the “Follow” button to get more trading ideas like this, and if you agree with me, click on the “Agree” button 😉.
See you soon,
Melissa.

AAPL double top? What to do? (Options Calendar/Diagonal)A trader on my social media is long NASDAQ:AAPL options as the charts begin to setup a potential Double Top with RSI overbought. The trader does not want to close their trade but feels the need to take some profit. In these situations I like to convert single directional options plays into a Calendar Spread or Diagonal Spread. In this video I use this real time example to demonstrate why and how this can be done.

ES is due for a drop.So Es is due for a drop, maybe even a significant correction. But this is tough to call because markets only go up don’t cha’ know? Manipulation is tough to trade but I still take small bites of money on sells. And now think we are at a sell spot possibly. ES has been trading in parallel channel of yellow lines. Also this index is overbought on monthly, weekly and daily. Look back at past same such conditions and you see almost always selling off. So that is what i am to do somewhere between now and touch of top of yellow channel. Take a small bite of profit if it drops because today’s markets have so much of a lot of fuel. It’s got to drop big one f these days, and I will be ready for big drop. But I don’t think this is a setup to the big one.
I appreciate everyone support and nice thoughts.
Miss Bunny.

We will have another chance to buy it soon! 🤑🤑🤑Ok, WISH hit the 13.80 as we thought it would, and it is below this level right now. That’s fine, now I see the 13 as the next support, and look at the RSI – it is starting to get oversold again!
Any reversal pattern around will be a buy sign for us.
And this will be perfect, because the 13 is also the 20ma in the 4h chart. The 30min and 4h charts were too overbought recently, and this pullback simply normalizes the situation.
For now, we have no other buy sign, but I’ll warn you if we see one! So, keep in touch!
If you liked this trading idea, remember to click on the “Follow” button to get more trading ideas like this, and if you agree with me, click on the “Agree” button 😉.
See you soon,
Melissa.

You must keep an eye on these points now! 👁Just as we expected, PLTR is just flying, and there’s nothing here telling me otherwise.
Today we have an intraday consolidation, and this is good, because we have new points to look at.
The 27.50 is the resistance we must see broken this week. The 27.01 is the support we don’t want to see PLTR losing.
Let’s see the daily chart for a change. PLTR is at an interesting resistance, and if it loses the 27.01, we might correct a little bit. The RSI is quite overbought, and this is another thing that we should be aware.
If PLTR loses the 27.01, we might see it between the 26-25s. Then we’ll see. Maybe we’ll have another buy there! Nothing scary. 😉
If you liked this trading idea, remember to click on the “Follow” button to get more trading ideas like this, and if you agree with me, click on the “Agree” button 😉.
See you soon,
Melissa.

Looking to short ESI look at ES and I can see good short opportunity. This does not meen it won’t go up but I see very big profit for down move short term. Why?
- Price is in up yellow wedge
- RSI is overbought or close.
- price is hitting resistance at up trendline in black which has been tested a lot of times both from a support side and a resistance side.
I will take short position if candle close below lower line of yellow up wedge.
You can see my price targets in the down arrows and yellow support areas to take partial profit. If price drop down to black support line then I should exit altogether because this is strong demand zone and then a good long opportunity.
Happy trading!
Ms. Bunny

How to proceed on WISH? 🤓This is just a consolidation. A normal movement that occurs when something did an amazing movement. It is how the market tells us that the stock is resting.
There’s nothing to worry about here, and since we are above the 20ma, we are fine, and the momentum is bullish.
The 20ma is a support for us here, and it seems WISH will hit it next, before it hits our first target at 15! The entry point was around 12.10, so, I believe it is impossible for us to lose money right now.
We are still in a bull trend in the 4h chart, but the problem is the RSI, which is overbought. This makes a pullback more likely, but this doesn’t change our thesis!
WISH is bullish, and I’m 100% sure that we’ll see pullbacks along the way, so, let’s just be prepared and be patient! I’ll keep you guys updated, as usual!
If you liked this trading idea, remember to click on the “Follow” button to get more trading ideas like this, and if you agree with me, click on the “Agree” button 😉.
See you soon,
Melissa.

Going according to our plan! 😎Palantir is obeying technical analysis and it is behaving according to the plan.
Today it is breaking the 26.71, the breakpoint that would resume the bull trend, as we talked about I my last analysis. The only thing that could trigger a pullback is if PLTR loses the 26.71 again and make this a false breakout.
But we are good for now, and we shouldn’t worry about what didn’t happen.
The problem is that PLTR is overbought in the 4h chart, and if we see a bearish pattern here, it could trigger a pullback. But since we don’t have one, we are ok. 😉
Even if it drops, this doesn’t change our target at 30. I’ll keep you guys update in a daily basis!
If you liked this trading idea, remember to click on the “Follow” button to get more trading ideas like this, and if you agree with me, click on the “Agree” button 😉.
See you soon,
Melissa.

BEARISH CROSSDOWN CONFIRMED (OVERBOUGHT) BTC (3 HOUR)If you look at the momentum oscillator you'll see price action is overbought and has signaled twice now, and the same area on the actual chart is showing strong sell offs during those specific candles which shows sellers are taking control in the short term, plus we're at resistance and have been in a downtrend since ATH's.
Stay safe and have a great weekend.

NZDJPY, 240, SHORT SIGNAL ---> SHORT NOWNZDJPY just touched a strong resistance @77.800
This is a critical resistance because it s right at 61.8% retracement and 50 EMA
RSI shows Overbought in 60min chart.
Expecting it s going down to 77.400 which is the next support.

We are doing good! What's next for us? 🤑Ok, WISH did break the pivot we mentioned (12.10), and it triggered the buy sign! Now we are off to the 15!
Today’s movement was good, but since it was a bit overbought, now it is doing a correction.
The 4h chart is starting to show us a good movement as well, and it is easy to see why the 15 is our target (previous top).
The RSI is a overbought too, but I don’t see this invalidating our thesis. Maybe it’ll correct along the way, but our target is still the same!
If you liked this trading idea, remember to click on the “Follow” button to get more trading ideas like this, and if you agree with me, click on the “Agree” button 😉.
See you soon,
Melissa.
