OXT/USDT — Accumulation Before a Breakout or Further Decline?📌 Overview
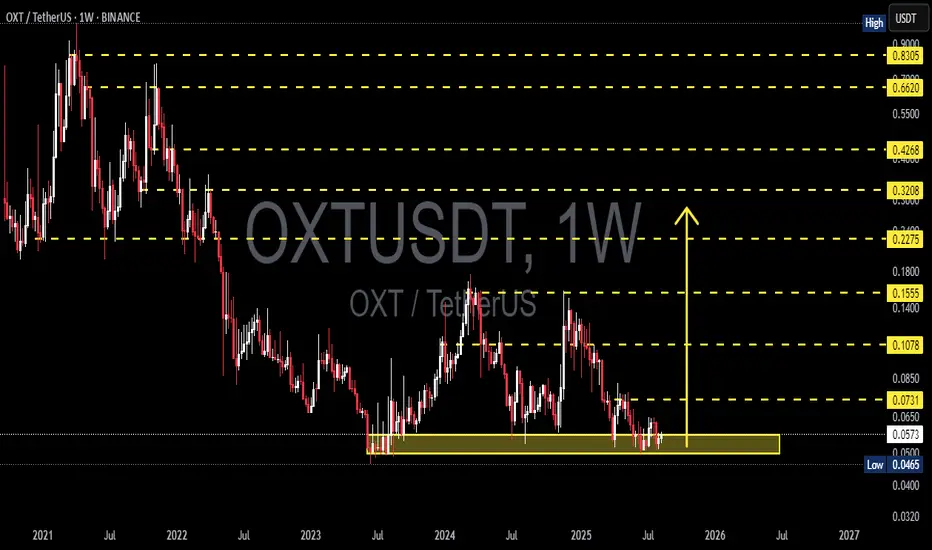
OXT/USDT is currently at a critical stage on the weekly chart, consolidating within the strong demand zone at 0.0465–0.0650 (yellow box) that has been tested multiple times since mid-2023. This area acts as the last line of defense for buyers before price enters uncharted multi-year lows. The macro structure remains in a long-term downtrend since the 2021 peak, but the base formation in this low zone opens up a significant opportunity for a medium-term relief rally if a breakout is confirmed.
---
1. Key Technical Levels
Main Support / Demand Zone (yellow box): 0.0465 – 0.0650
→ This is the “floor” that has been holding price for nearly two years.
Minor Support: 0.0500 (psychological & repeated reaction level)
Layered Resistance Levels:
0.0731 → 0.1078 → 0.1555 → 0.2275 → 0.3208 → 0.4268 → 0.6620 → 0.8305
---
2. Structure & Patterns
Macro Trend: A sequence of lower highs since 2021 → indicating the primary trend is still bearish.
Potential Pattern:
Base / Accumulation Range near multi-year lows → resembles an early rounding bottom, but not confirmed yet.
Possible spring pattern: brief drop below main support followed by a sharp reclaim.
Volume (not shown here): Often decreases near the bottom range, signaling sellers may be losing strength.
---
3. Bullish Scenario (Relief Rally Potential)
💡 Conservative confirmation:
Break & weekly close above 0.0731.
Step-by-step targets: 0.1078 → 0.1555 → 0.2275.
0.1078 is the key breakout pivot; clearing it could trigger large-scale short covering.
⚡ Aggressive setup:
False breakdown below 0.0465 (spring) followed by a quick weekly close back above 0.050–0.055.
Initial target: 0.0650, then 0.0731 if momentum continues.
Best suited for swing traders aiming for high risk/reward.
---
4. Bearish Scenario (Trend Continuation)
Clean weekly close below 0.0465 + failed retest (0.0465 turning into resistance).
Downside targets: 0.0400 then 0.0320.
Failure to break 0.0731 and forming another lower high would also indicate sellers remain in control.
---
5. Strategic Notes
The 0.0465–0.0650 zone is the final battleground between long-term buyers and sellers controlling the macro trend.
Patience is required on this 1W timeframe; valid breakouts may take several weekly candles to confirm.
Aggressive traders may consider entries within the yellow box with tight stops below 0.0465, while conservative traders can wait for a confirmed breakout above key resistance.
---
6. Key Takeaway
As long as price holds inside or above the yellow box, relief rally potential remains alive.
Breaking 0.0731 will be the first major signal of sentiment shift.
A breakdown below 0.0465 opens a new chapter in the long-term downtrend.
#OXT #OXTUSDT #OrchidProtocol #CryptoAnalysis #PriceAction #WeeklyChart #SwingTrade #SupportResistance #BreakoutSetup #CryptoTrading
Oxtusdtlong
Oxt Technically So Amazing Oxt/USDT is showing promising signs. It looks like it's gearing up for a bullish move, and I anticipate the price to increase by 15-30% in the coming days. However, it's important to note that this is not financial advice, so please do your own research (DYOR) before making any decisions.

OXT-USDT - DAILYThese are my Keylevels for OXT.
Nothing do to here, i think that we need to wait for more confirmations.

OXT COIN PRICE ANALYSIS AND POSSIBLE MOVES !!ASX:OXT Coin Short Term possible Scenerios Near Me !!
• Manipulation by whales expected under this project... Do trade carefully with proper stoploss & take profite and don't use upto 10% fund if you take trade.
• Like & retweet For more Free analysis.
LIKE AND FOLLOW US FOR MORE FREE ANALYSIS !!
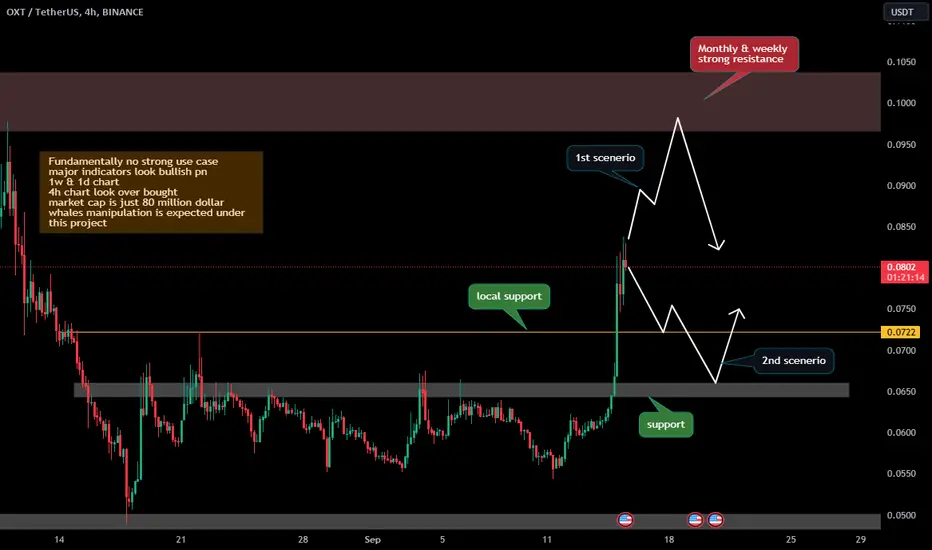
OXT/USDT - Orchid: Resistance_Breakout_Confirmation◳◱ A Resistance Breakout and Confirmation has been detected on the $OXT / $USDT chart. The price has broken above a key resistance level and has been confirmed by a strong candle, indicating a potential bullish trend. The next resistance key levels are located at 0.0933 | 0.0999 | 0.1124, and the major support zones can be found at 0.0808 | 0.0749 | 0.0624. Consider entering a trade at the current price zone of 0.088 and targeting higher levels.
◰◲ General info :
▣ Name: Orchid
▣ Rank: 350
▣ Exchanges: Binance, Kucoin, Huobipro, Gateio, Mexc, Bittrex
▣ Category/Sector: Services - Data Management
▣ Overview: Orchid aims to serve a privacy-preserving role in Ethereum’s web3 stack. It is an incentivized peer-to-peer privacy network and decentralized VPN application that enables private access to the Internet. Users pay Orchid node providers in exchange for bandwidth. These providers stake Orchid tokens, OXT, to sell bandwidth on the Orchid Network. Providers receive user requests for traffic in proportion to their stake weight.
◰◲ Technical Metrics :
▣ Mrkt Price: 0.088 ₮
▣ 24HVol: 261,896.641 ₮
▣ 24H Chng: 2.564%
▣ 7-Days Chng: 2.13%
▣ 1-Month Chng: -3.04%
▣ 3-Months Chng: 29.28%
◲◰ Pivot Points - Levels :
◥ Resistance: 0.0933 | 0.0999 | 0.1124
◢ Support: 0.0808 | 0.0749 | 0.0624
◱◳ Indicators recommendation :
▣ Oscillators: NEUTRAL
▣ Moving Averages: STRONG_BUY
◰◲ Technical Indicators Summary : BUY
◲◰ Sharpe Ratios :
▣ Last 30D: -0.09
▣ Last 90D: 1.61
▣ Last 1-Y: -1.03
▣ Last 3-Y: 0.46
◲◰ Volatility :
▣ Last 30D: 0.55
▣ Last 90D: 0.76
▣ Last 1-Y: 0.84
▣ Last 3-Y: 1.24
◳◰ Market Sentiment Index :
▣ News sentiment score is N/A
▣ Twitter sentiment score is 0.54 - Bullish
▣ Reddit sentiment score is 0.72 - Bullish
▣ In-depth OXTUSDT technical analysis on Tradingview TA page
▣ What do you think of this analysis? Share your insights and let's discuss in the comments below. Your like, follow and support would be greatly appreciated!
◲ Disclaimer
Please note that the information and publications provided are for informational purposes only and should not be construed as financial, investment, trading, or any other type of advice or recommendation. We encourage you to conduct your own research and consult with a qualified professional before making any financial decisions. The use of the information provided is solely at your own risk.
▣ Welcome to the home of charting big: TradingView
Benefit from a ton of financial analysis features, instruments and data. Have a look around, and if you do choose to go with an upgraded plan, you'll get up to $30.
Discover it here - affiliate link -
Long OXT NOW 🚀🔥
OXTUSDT Long Entry : 0.2260 - 0.2250 $
short term : 0.2436 - 0.2493 $
mid term : 0.2660 - 0.2676 - 0.2847 - 0.3164 $
long term : 0.5 - 0.55 - 0.66 - 1 $
Enjoy !

OXT/USDT👑 ̲F̲X̲o̲n̲e̲4̲a̲l̲l̲ 👑 VIP 🚀🚀,
🟢OXT - USDT 🔚BINANCE
Buy limit : 0.42
🔸target💰
🔹0.65$
🔹1$
🔹3$
🎯 time about 3$ : 2 months or 3 months

OXTUSDT CwH Pattern | 75% Move ExpectedOXTUSDT CwH Pattern | 75% Move Expected on Handle Breakout
NOTE: Do your own analysis. Do proper risk and money management. Spot trading only.
Entry: 0.3910
TP1: 0.4326
TP2: 0.5072
TP3: 0.5889
TP4: 0.6865
SL: 0.3322
ROI: 68% - 75%
Risk: 15%
Do not use more than 10% Risk of your account.
Do not enter if you don't know how to trade.
