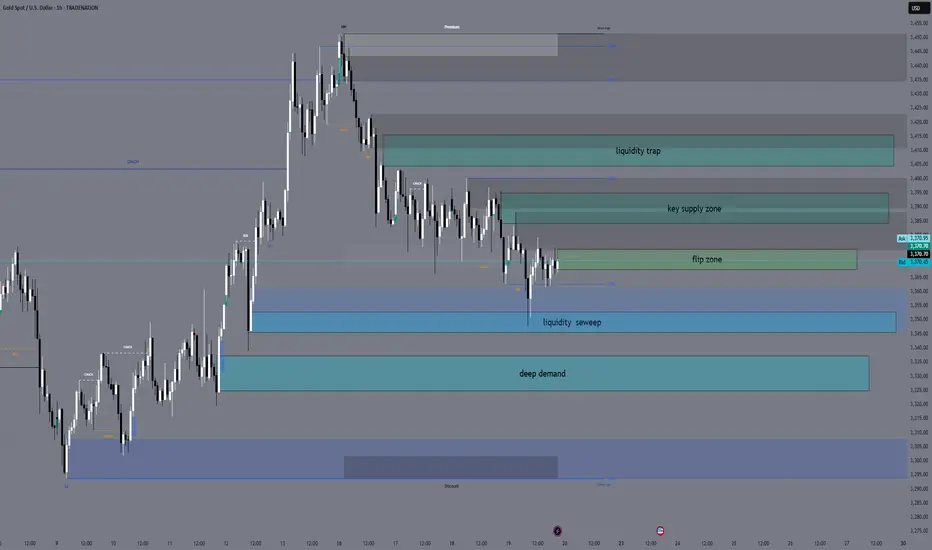
XAUUSD SNIPER OUTLOOK – JULY 28, 2025🔥 Macro & Sentiment
The dollar remains dominant — DXY holding above 105 keeps gold under pressure. No fundamental support for bullish continuation unless major macro shifts. Risk flows are defensive, not aggressive. FOMC and US GDP data remain key drivers for direction this week.
BIAS:
• Short-term bearish under 3350
• Market still in distribution mode — every bounce gets sold
• Real buy interest only deep below 3315
🔻 INTRADAY SUPPLY ZONES (Short Only With Rejection)
1. 3382–3370 (H1/M30 Premium Supply)
🔹 H1 order block, FVG alignment, EMA21/50/100 convergence
🔹 Liquidity inducement above → then rejection
📍 Short only if rejection shows via engulf / upper wick.
2. 3355–3340 (Decision Zone / Micro Supply)
🔹 EMA100/200 alignment, former support flipped resistance
🔹 M30 FVG fully filled, structure flip from mid-July
📍 Short bias below. Long only if reclaimed with H1 close above 3355.
🔵 NEUTRAL / PIVOT ZONE
3. 3338–3326 (Decision Band – M30/M15)
🔹 Consolidation area post-BOS, internal liquidity sweeps
🔹 EMA21 base on M15, no clear dominance
📍 Wait for clean reaction. Bullish engulf = scalp long to 3355. Failure = slide to demand.
🟢 DEMAND ZONES (Buy Only On Strong Reversal Confirmation)
4. 3314–3302 (M30/M15 Deep Demand)
🔹 H1 OB + hidden FVG + fib 38.2%
🔹 First real demand zone where buyers may engage
📍 Long only if strong M15 confirmation: engulf + RSI cross + EMA5/21 angle change.
5. 3289–3272 (True Reversal Demand – H1/M30)
🔹 Full NY reversal origin (July 18), major FVG left unfilled
🔹 Institutional volume + liquidity grab zone
📍 Buy only on full flush + fast snapback with BOS on M15/H1.
🧭 BIAS & EXECUTION BY TIMEFRAME
H4 Bias:
Bearish while below 3350. No valid supply above until 3370+. Avoid longs unless price sweeps 3314 or 3272 and confirms.
H1 Bias:
Sell clean rejection at 3355 or 3370–3382. Only flip long above 3355 with full-bodied close.
M30 Bias:
Watch decision zone 3338–3326 for direction. No-man’s land in between — don’t force trades.
M15 Bias:
Scalp long from 3314 or 3272 only on full confluence (OB + RSI + EMA realignment). Short only confirmed rejections above.
📊 FULL INTRADAY KEY LEVELS (Top → Bottom)
Level Context
3405 Fib ext. 127% (HTF sweep target only)
3385 OB
3375–3350 Valid Premium Supply (H1 shelf)
3350–3340 Micro Supply / Flip Zone
3338–3326 Decision Zone – watch reaction
3314–3302 Deep Demand (H1/M30 confluence)
3289–3272 Extreme Demand Base
3260 Fib 61.8% + HTF support
3250 Minor volume node
3240 Final structural floor
✅ EXECUTION NOTES
⛔ Avoid entering inside 3340–3326 → fakeout zone
✅ Play only clean sniper triggers with structure
⚠️ Wait for macro — FOMC / GDP releases may fake both sides
💡 Patience wins. Pick your zone, wait for setup, strike.
Which zone are you watching to strike? Drop your bias below.
📍 Like, comment & follow GoldFxMinds for the most precise sniper maps on TradingView.
Disclosure: This plan is based on the Trade Nation chart feed. I am part of their Influencer Program.
PA

XAUUSD H4 Outlook – “Fed Week: Only the Real Zones”Hello, gold traders!
FOMC week is here, the dollar’s flexing, and gold is stuck under a fortress of supply. No fantasy, no overlaps, just your real, actionable H4 map—zones spaced, logic tight, and all fluff deleted.
⬜Bias:
Neutral to bearish while price is capped under 3,355 and the EMA cluster.
Only flip bullish if price closes and holds above 3,375 with strong confirmation after news.
Current Price: 3,336.81
Summary for your audience:
Neutral–bearish: All the EMAs (21/50/100/200) are overhead, and the primary supply and decision zones are blocking any upside.
No reason to flip bullish unless gold breaks out and holds above both the decision zone and the full supply ceiling after major news.
All bounces into supply are likely to get faded, unless the structure changes dramatically post-FOMC.
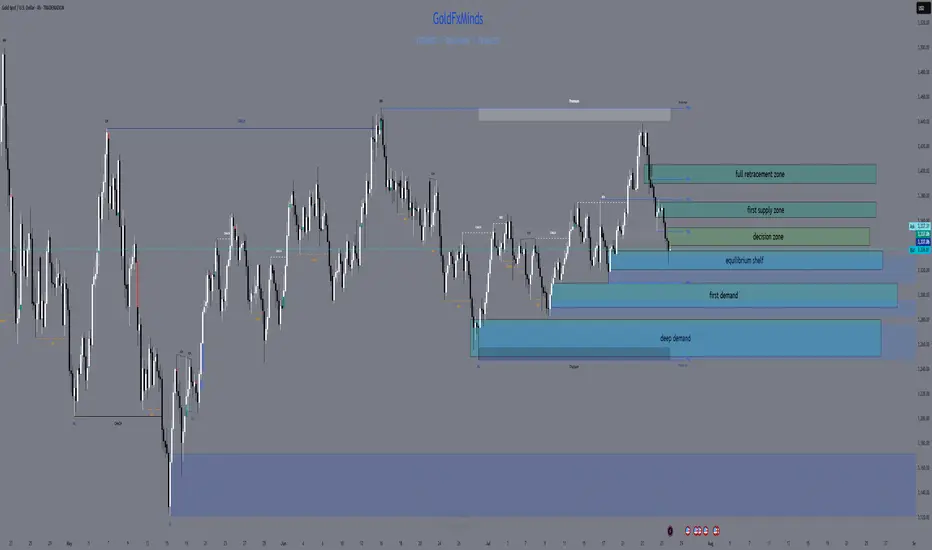
🟥 ULTRA SUPPLY ZONE: 3,390 – 3,405
127–161.8% Fib extension—liquidity grab and stop-hunt target for news-driven spikes
Only short if you see a monster upper wick and hard rejection
🟥 PRIMARY SUPPLY: 3,365 – 3,375
All EMAs (21/50/100/200) are stacked overhead; unfilled FVG at 3,370–3,375
Short on a clear rally rejection or bearish engulfing candle—this is where most breakouts get trapped
🔶 DECISION ZONE: 3,340 – 3,355
EMA100/200 straddle this level; small FVG at 3,350–3,352
Market “decides” here—fade unless price closes decisively above 3,355
🔵 EQUILIBRIUM SHELF: 3,320 – 3,335
50% Fib at 3,327; filled FVG at 3,325–3,330; SMA50 just below
Bounce/fake-break zone—wait for a clean H4 reversal, not a guess
🟢 FIRST DEMAND BASE: 3,290 – 3,310
H4 Order Block, hidden FVG (3,300–3,305), Fib 38.2% around 3,295
Longs only with strong pin-bar/engulf and quick EMA50 reclaim
🔵 DEEP PULLBACK BAY: 3,250 – 3,280
Weekly EMA21 and 61.8% Fib (~3,260), strong volume
Only consider a long on a panic flush and a powerful reversal wick
⚡️ MACRO CONTEXT
USD: On fire into ADP and FOMC; gold moves will be explosive, not logical
Events:
Tue: ADP
Wed: FOMC + Powell
Thu: Core PCE
Fri: NFP, ISM
Bias: Neutral-bearish under 3,355; only bullish if we close and hold above 3,375
EMAs: Clustered tightly overhead—bulls get no respect until this ceiling is crushed
🎯 TRADE LOGIC
Shorts:
3,390–3,405 (big wicks and clear rejection only)
3,365–3,375 (news spike or failed breakout with bearish candle)
Longs:
3,340–3,355 (only on a confirmed close above)
3,320–3,335 (strong reversal only—don’t front run)
3,290–3,310 (classic H4 pin-bar/engulf + EMA50 reclaim)
3,250–3,280 (deep panic flush and major reversal only)
NO TRADE: In the gaps—let the gamblers get chewed up, not you.
💬 Which zone will you snipe? Drop a comment and show you’re here for structure, not noise!
👍 Like & Follow for high-value, real-time sniper maps every day.
Disclosure: Chart via Trade Nation’s TradingView feed. Influencer Program participant.
GoldFxMinds 💛
Daily XAUUSD Outlook — Riding the Fed Wave (July 28, 2025)Hey Gold Hunters! 🌟
Today feels like the calm before a storm—ADP whispers tomorrow, the Fed speaks Wednesday, and gold is inching toward its next big move. Let’s weave the macro pulse into our Smart‑Money map, highlight the five real zones, then plot our sniper‑perfect entries. No fluff—just the human beat of the market.
1️⃣ Macro Pulse & Market Mood
US Dollar: Bullish tilt as markets price in another hawkish Fed pause.
Tomorrow (Tue): ADP jobs print could spark an early swing.
Wed PM: FOMC Statement & Powell’s press conference—biggest catalyst this week.
Thu/Fri: Core PCE, Unemployment Claims, then Friday’s NFP + ISM Manufacturing.
Gold is caught in suspense: a squeeze here (into supply) or a slide there (into demand) will come fast once the Fed drops its hint.
🧭 Bias: Neutral‑bearish—looking for lower highs under the 3,345–3,375 supply zone, with a preference to short rallies into that band until price convincingly breaks and holds above 3,375. Once we see a clean weekly‑style close above that level, we’ll flip to neutral‑bullish.
2️⃣ Five Breathing Zones (Top → Bottom)
🛑 Zone 1 “Sky Trap” (3,380 – 3,415)
The final airspace above our daily EMAs (10/50) where stops are hunted. Fib ext’s 127%–161.8% and an unfilled Fair‑Value Gap live here. Any spike that ends in a long upper wick or bearish engulf = short‑trap.
(let price fall clear of this zone before the next)
⚔️ Zone 2 “Premium Supply” (3,345 – 3,375)
The two‑week high order block, hugged by EMA50 and Fib 61.8%. Friday’s rejection candle was born here. Watch for bearish PA after a retest—your core sell zone.
(space down to next)
🌊 Zone 3 “First Demand Cove” (3,290 – 3,320)
Where mid‑June’s buyers piled in: June consolidation OB, filled FVG, and Fib 38.2–50% confluence. SMA100 sits below for extra gravity. A clean drop and bullish reaction here = sniper‑long trigger.
(gap to deep zone)
🚀 Zone 4 “Deep Pullback Bay” (3,240 – 3,270)
Hidden Fair‑Value Gap, BOS origin, and weekly EMA21 converge. If Zone 3 breaks, this is your deep‑dip reload—hunt that D1 reversal wick.
(last space)
🛡️ Zone 5 “Macro Reset Block” (3,000 – 3,140)
The root of 2024’s CHoCH, EMA200/SMA200 cluster, and 78.6–88.6% Fib retrace. Only if gold truly panics on a USD blitz—ultimate accumulation.
3️⃣ Sniper‑Perfect Scenarios
🔴 Short Setup
Where: A thrust into Zone 1 or 2 (3,345+).
Cue: Long upper wick → bearish engulf on D1/M30.
Edge: FVG fill + Fib confluence + RSI rollover.
🟢 Long Setup
Where: A dip into Zone 3 or, if swept, Zone 4.
Cue: Bullish pin‑bar or engulf + reclaim of EMA10/50.
Edge: June OB base + RSI bounce from ~50.
4️⃣ Your To‑Do List
Morning Watch: Does gold flirt with 3,375? Prep your shorts.
Mid‑Day Pull: A drop to 3,300? Hunt your longs.
Avoid: The gaps between zones—those are “no‑man’s land.”
News Trades: Let the daily candle close post‑Fed before committing.
💬 What’s your plan today? Comment below—let’s refine our edge!
👍 Enjoyed this map? Smash that Like & Follow for more pulse‑driven, zero‑fluff outlooks.
Disclosure: Chart powered by Trade Nation’s TradingView feed. I participate in their Influencer Program.
GoldFxMinds 💛

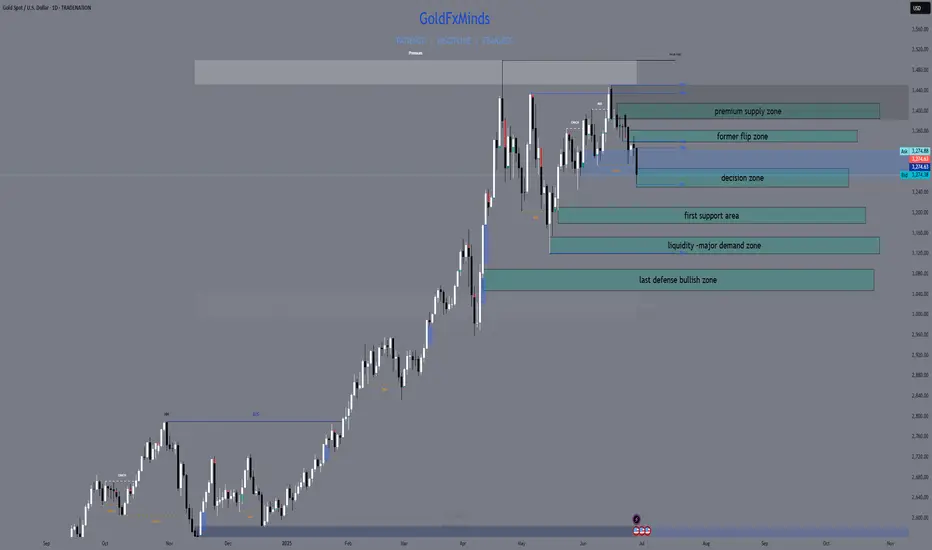
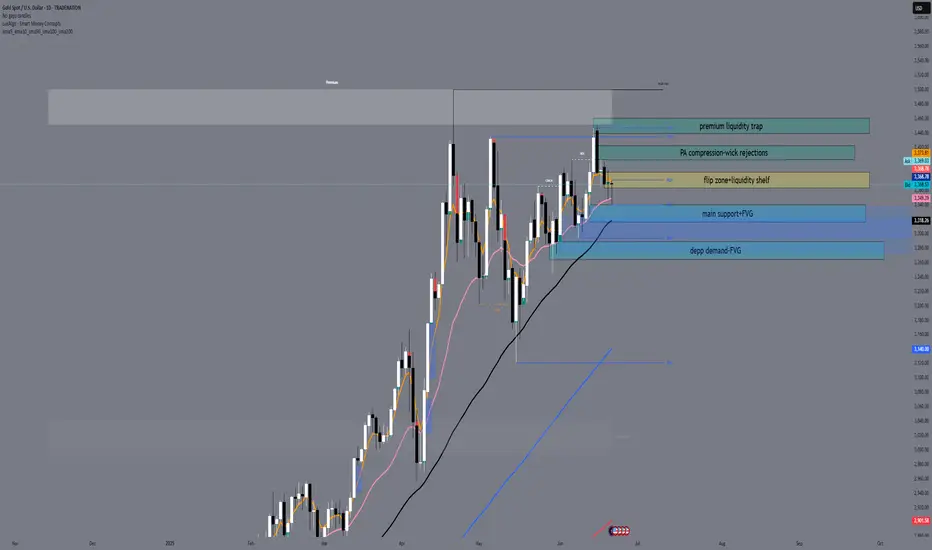
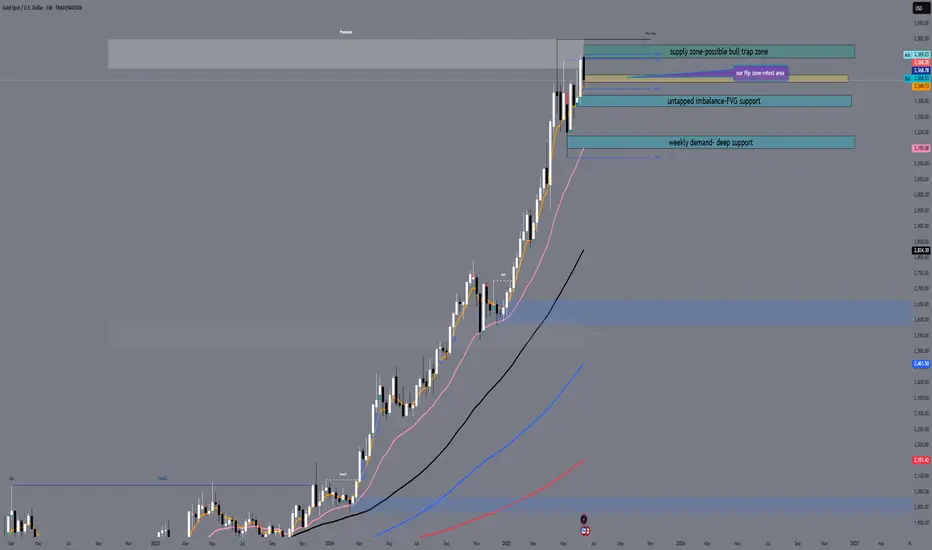
XAUUSD FULL WEEKLY STRUCTURE MAPHello traders! 🌟
We’re stepping into a pivotal week for gold (XAUUSD), and the weekly chart tells a story of tension, liquidity hunts, and potential big moves. Let’s dive into the three truly critical zones, backed by SMC/ICT logic, Fibonacci, EMAs, RSI, and fair‑value gaps — all in one elegant map. 🎨✨
🔹 HTF Overview & Macro Pulse
Current Price: 3336
Weekly Trend: Bullish overall, but momentum is fading as price coils under premium highs.
EMAs (5/21/50/200):
EMA5 & EMA21 are flattening beneath price, hinting at stall.
EMA50 sitting near 3120 as a deep support magnet.
RSI (Weekly): Cooling from ~75 down to ~66, showing bearish divergence vs those upper wicks.
Fair‑Value Gaps:
Unfilled 3365–3405 zone above — institutional imbalance still waiting.
Partially filled 3280–3320 below — common reaction pocket.
Fibonacci Extensions (1984 → 3365 high): 127.2% at 3405, 161.8% at 3439 — the exact top of our supply wick.
Macro Catalysts This Week
Wed (Jul 30): FOMC + Fed Statement
Thu (Jul 31): Core PCE + Unemployment Claims
Fri (Aug 1): NFP + ISM Manufacturing
Prepare for violent spikes into one of our zones — then trade the reaction.
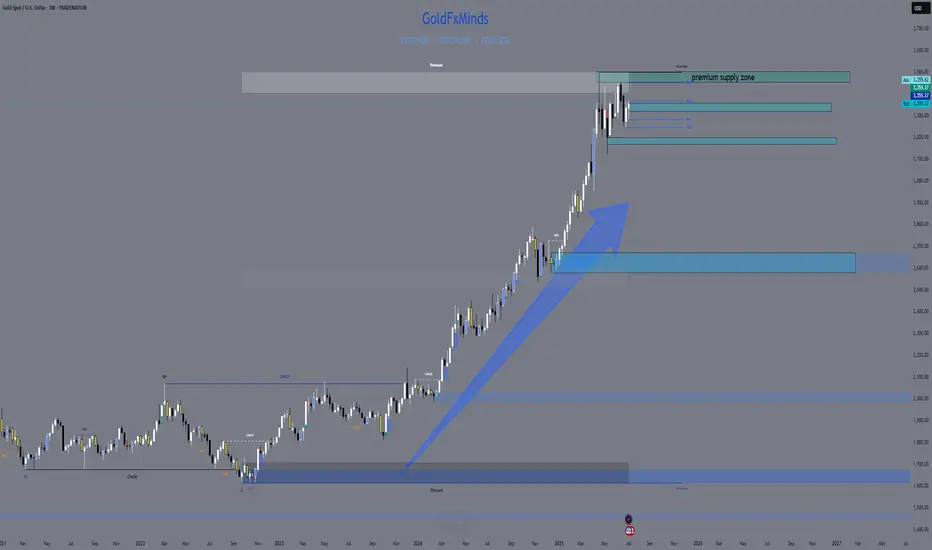
🔸 The Three TRUE Weekly Zones
W1 Supply (Ultimate Wick Zone)
🔥 3350 – 3439
This entire wick from May–July is YOUR one and only supply zone on weekly.
Pure liquidity sweep area
Confluence: unfilled fair‑value gap, 127–161.8% Fib, RSI divergence
Every touch here is a short‑trap until we see a full weekly close above 3439.
W1 Demand (Primary Buy Zone)
🌊 3220 – 3285
The last robust order block & BOS base before gold ran vertical.
Confluence: filled FVG, weekly OB body, EMA21 target, RSI back at 50
Ideal sniper entry after a news‑driven sell‑off into this range.
Deep Discount Block
🛡️ 2960 – 3050
The origin of the full 2024–2025 bull trend — true institutional accumulation.
Confluence: March 2024 CHoCH base, EMA50/200 proximity, 78.6–88.6% Fib retrace
Only for a major quarterly reset; not on the immediate radar unless USD spikes dramatically.
🧭 Strategy & Execution
Short Bias: Wait for a liquidity spike into 3350–3439 (likely around FOMC/NFP), then watch for a clean rejection candle.
Long Bias: After a thrust down into 3220–3285, look for wick‑based rejection plus EMA21 hold and a bullish engulf on weekly.
Avoid the mid‑zone between 3285–3350 — that’s noise, not structure.
Patience is everything. Let price sweep, then let us strike. The real power trades this week will be born from clear structure — not guesswork.
💬 What’s your favorite zone to watch? Drop a comment below!
👍 Smash that like🚀🚀🚀 if you found this map helpful, and hit follow for more GoldFxMinds sniper blueprints.
Disclosure: Analysis based on Trade Nation’s TradingView feed. I’m part of their Influencer Program.
GoldFxMinds 💛

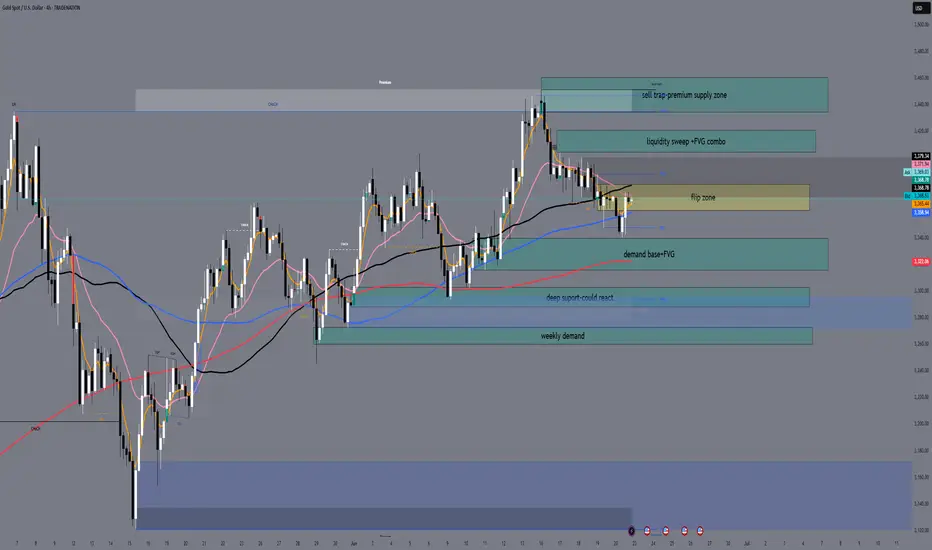
XAUUSD LIVE OUTLOOK – JULY 23, 2025Good evening, traders—let’s get this right, no mistakes. Gold hit 3,438, then pulled back and found support exactly in the 3,380–3,390 zone. Here’s your precise update:
🔸 HTF OVERVIEW (H4 → H1)
New High & Liquidity Sweep: A clean breakout to 3,438 invalidated every old supply.
Primary Demand: Price settled into the 3,380–3,390 H4 order block (untested FVG beneath). H1 confirms this blue zone as the critical buy area.
Invalidated Supply: No valid sell zones until we carve fresh structure above 3,438.
🔹 LTF PRECISION (M30 → M15)
M30 Flow: Spike to 3,438, then instant drop into 3,380–3,390. Volume spiked on the decline, then eased as price held.
M15 Structure: Inside 3,380–3,390, watch for a clean BOS above 3,395—that’s your bull‑bear pivot. Until then, this zone is the edge of the knife.
🎯 KEY ZONES & TRIGGERS
Buy Zone #1 (Live): 3,380–3,390
Confluence: H4 order block + unfilled FVG + H1 swing low
Trigger: M15 BOS above 3,395 and retest.
Buy Zone #2 (Backup): 3,350–3,360
For a deeper pullback—untested H4 demand.
Sell Zone: 3,420–3,438
Confluence: unfilled H4 FVG + premium supply
Fade only on clear M15 rejection (pin‑bar/engulf).
Decision Pivot: 3,395
Above = bullish continuation; below = stand aside.
➡️ ACTION PLAN
Longs: Enter on M15 close above 3,395 and retest; targets at 3,420 then 3,438.
Shorts: Only on rally into 3,420–3,438 with a decisive rejection candle.
Invalidation: A sustained break below 3,380 warns of a deeper flush toward 3,350–3,360.
🚀 CALL TO ACTION
If this nailed your edge, smash that Like, Follow @GoldFxMinds for daily sniper updates, and Boost this post so your fellow traders don’t miss these live levels! Drop a 🔥 if you’re ready to strike the next move.
Disclosure: I’m part of TradeNation’s Influencer program and receive a monthly fee for using their chart feed.
— GoldFxMinds
Gold Market Update – Key Zones for the Next MoveHey gold lovers! As the NY session wraps up, the chart is a painting of tension: gold boxed tight between major structure — and the real action is only about to start.
Bias:
At this stage, gold remains in a short-term bullish structure as long as price holds above the 3421–3428 decision area. A break and hold below this zone would shift the bias to neutral or bearish for the next sessions.
🎨 What’s drawn on the chart?
🟥 3472–3478 Supply Zone:
The ceiling, still untouched — this is where every failed breakout has left a “scar” on the chart. If we finally reach this zone, watch for wicks, rejections, or that rare, clean breakout candle. Sellers and patient bulls are both watching for “the drawing” to be complete.
🟩 3383–3390 Demand Zone:
The real floor. On your chart, it’s the base built by strong bounces and those long wicks buyers left behind. If price falls here, it’s not just a line: it’s a zone where new rallies are born and the market might “paint” a major reversal.
🟦 The Middle is Just Noise
Price is coiling, painting confusion in the center — but the edge zones are where structure and opportunity live.
Don’t be the trader who gets erased in the chop. Let price draw the story at supply or demand before making your move.
💡 Plan for Tonight
Wait for price to reach 🟥 supply or 🟩 demand.
Watch the “drawing” — will you see a wick, a rejection, or a true breakout?
Only trade once the story is clear at the edges.
Drop your best chart art or scenario below!
like🚀🚀🚀and 🔔 Follow for real structure updates & daily market stories — let’s turn trading into a masterpiece, together.
GoldFxMinds
GOLD SNIPER PLAN – July 21, 2025Hey, GoldMinds! 🔥
This isn’t just another range day — it’s the type of market that separates disciplined snipers from impulsive chasers. If you want an edge, you need a plan that’s both sharper and more refined than what most see on their charts.
After a week full of fake breakouts, confusing swings, and whipsaw price action, gold is giving us the gift of clarity — but only for those patient enough to let the market reveal itself. Here’s how you cut through the noise and focus on the only zones that actually pay.
🚩 SELL ZONES
1. Primary Supply: 3358–3370
This is the fortress where real sellers pushed back hard. The structure here is crystal clear: last week’s failed breakout, sharp rejection, and a textbook H1/M30 order block. You want the sniper entry? Wait for price to tap here and only short if you see an instant, aggressive bearish response on M15/M5 — not just a slow drift.
2. Upper Liquidity Trap: 3380–3395
Classic trap for late buyers. This is where price loves to sweep stops and trigger emotional FOMO — but the real professionals are only interested if the move fails hard. Watch for a fake breakout and sudden reversal; this is the sniper zone for “fade and run” shorts.
⚪ DECISION ZONE (Neutral / Pivot)
Pivot Range: 3335–3345
Forget this level — it’s where amateurs get chopped up. There’s no order block, no real fair value gap, just confusion and false hope. A true sniper waits here, watching, not acting.
🟢 BUY ZONES
1. Main Demand: 3326–3332
This is the engine room for bulls: a refined order block, evidence of real absorption, and a history of sharp reversals. Don’t try to anticipate — let price come here and look for a snapback move on M15/M5. This is where patient buyers take their shot.
2. Deep Demand: 3311–3320
Where the fear turns to opportunity. This zone sits under recent lows, home to panic sweeps and emotional selling. Only consider a long if you see a powerful, impulsive bounce. The risk is high, but the reward for perfect timing is even higher.
BIAS & EXECUTION
Bias: Neutral, but watch for range expansion — the market is coiling for a bigger move.
Execution:
– Only act at the true edges, never in the middle.
– Let M5/M15 price action prove your setup — the market owes you nothing.
– If a zone breaks with momentum, do not fight the flow; stand aside or prepare for the next edge.
FINAL SHOT
This is where discipline pays.
Sniper trading is about letting the market come to you and striking only when your zone lights up with confirmation. Every other move is just noise, meant to shake out the impatient. Drop a comment below with the zone you’re watching most , follow and🚀🚀🚀 GoldFxMinds for daily sniper maps, and remember: in gold, only real structure pays.
Disclosure: Charts powered by Trade Nation. Educational content only.
XAUUSD Daily Outlook – July 21, 2025Hey traders 💙
Gold continues to move inside a high timeframe range, with both bulls and bears defending structure at the edges. Price remains stuck between supply and demand — and only the strongest levels matter now. Here’s how the chart truly looks:
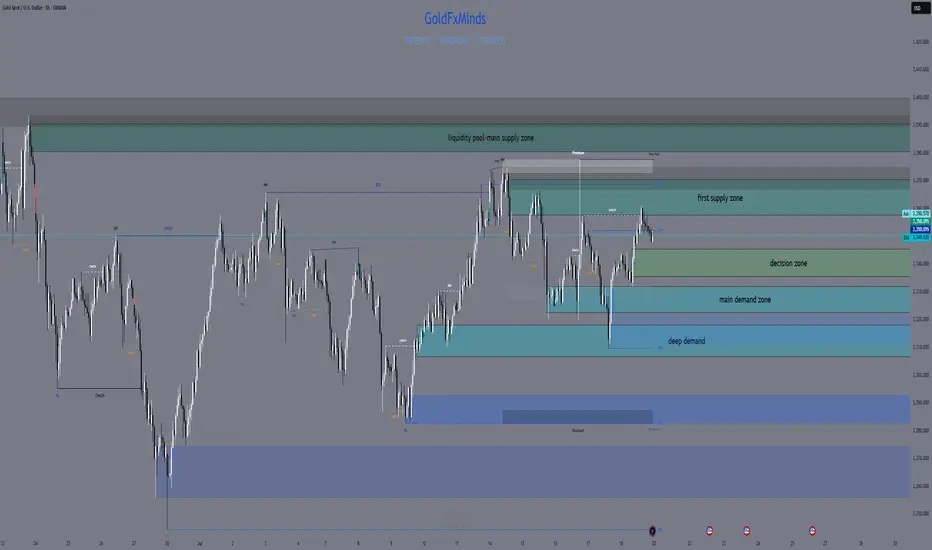
🔸 Key Supply Zones
1. 3380–3405: Main Daily Supply / Liquidity Pool Above
This is the top wall of the current range and the zone with the highest supply. Multiple failed breakouts, long upper wicks, and a clear cluster of liquidity just above. Unless we get a solid daily close above 3405, this area remains a trap for late buyers and a magnet for liquidity grabs.
2. 3355–3375: Internal Supply / Inducement Block
This zone has acted as an internal ceiling since the last CPI event. Here, price repeatedly failed to close above, and every return has produced quick rejections or fake breakouts. It often works as an inducement, catching breakout buyers and flipping the market lower.
🔹 Key Demand Zones
1. 3312–3300: Internal Demand / Mid-range Reaction
Here we see a clear reaction point where buyers have defended aggressively after CPI and NY session moves. It’s an internal demand area, often working as a temporary bounce or a place for stop hunts before larger moves.
2. 3275–3250: Main Daily Demand / Liquidity Pool Below
This is the base of the range, holding as support multiple times this month. Every dip into this zone has triggered large bounces, but the liquidity sitting below is also a key magnet for potential sweeps. Only a full daily breakdown here would flip the higher timeframe bias bearish.
📊 Technical Structure & Strategy
We are stuck between Main Supply (3380–3405) and Main Demand (3275–3250).
Every “middle” move is either inducement or a set-up for liquidity collection — not a real trend.
No daily close above 3405 → no bullish continuation.
No breakdown below 3250 → no clean bearish momentum.
Your edge: Only act when price confirms a reaction at a major zone with CHoCH/BOS, strong OB, or a liquidity sweep.
🧠 Takeaway:
This is not the time to guess direction — let the market show its intent at the edges. Use TradingView alerts on your key levels, be ready for volatility from macro news, and don’t get trapped in the mid-range games.
💬 Comment your bias or questions below.
Follow GoldFxMinds for more advanced XAUUSD updates and sniper-level education.
Stay patient, stay precise, and let structure work for you!
Posted using Trade Nation broker feed. As a participant in the Trade Nation Influencer program, I receive a monthly fee for using their TradingView charts in my educational content.
— GoldFxMinds 💙

XAUUSD Daily Sniper Plan – July 17-18, 2025Hello traders!
After yesterday’s high-volatility trap and NY session recovery, we now stand at a major structural junction. Buyers reclaimed 3310–3314 with precision, but price is pressing into multi-timeframe supply. Let’s break it down clearly
🔸 HTF Bias
Daily Bias: Bullish correction inside a larger range. Demand at 3310–3305 was swept and respected, but supply at 3347–3360 caps upside.
H4 Bias: Bullish flow into supply. Structure printed clean HLs from 3295–3310. However, current zone is full of short-term profit-taking risk.
H1 Bias: Bullish short-term trend. Price built higher lows from 3310, but now sits at 3340–3347 — reactive zone where momentum could fade if no breakout.
🔸 Key Structural Zones (with role)
🔺 Supply Zones (Above Price):
3347–3360 (D1/H4/H1 Supply)
🔹 Multi-timeframe confluence
🔹 Previous reaction + NY trap zone
🔹 Expect heavy rejection or false breakout wicks
3366–3385 (D1 Supply)
🔹 Final liquidity shelf for buyers
🔹 Only valid if 3347 breaks clean
🔹 Longs must wait for confirmation after breakout
⚔️ Decision Zones (Middle):
3335–3328 (Intraday Flip Zone)
🔹 M15-M30 structure control
🔹 Buyers can reload here on clean bounce
🔹 If price closes below, opens door for bearish momentum
🔻 Demand Zones (Below Price):
3314–3310 (H1/H4 Demand – Key Buy Area)
🔹 Institutional demand origin
🔹 Price tapped, swept, and reclaimed
🔹 Ideal sniper buys only on retest with bullish M15 BOS
3305–3295 (Deep Reversal Demand)
🔹 Extreme discount
🔹 Valid only if 3310 fails
🔹 High RR buys if liquidity sweep appears
🔸 Sniper Battle Plan 🎯
Scenario 1 – Fade from 3347–3360:
🔹 If rejection signs (M15 FVG + RSI divergence), short toward 3335, 3314
🔹 Only enter if NY open confirms exhaustion
Scenario 2 – Pullback to 3335–3328:
🔹 Ideal quick buys on bounce with confirmation
🔹 Watch for BOS on LTF for sniper entry
Today’s zones require real discipline: no rush, no panic — just clear steps, sharp entries, and clean rejections or retests. You already saw what 3310–3305 reacted. The next move? You plan it. You take it. You own it.
✨ Which zone are you watching for your next move?
Drop a comment, leave a 🚀🚀🚀and follow for more sniper-level clarity — every single day.
Let’s keep mastering this market. Together.
Disclosure: All plans are built on Trade Nation live feed. Educational only.
GOLD FULL UPDATE – July 15, 2025 | Post-CPI TrapPost-CPI Flip Zone Battle
Hello dear traders 💛
Today has been one of those heavy CPI days — full of volatility, sweeps, and doubt. But if we read it structurally and stop chasing candles, everything makes sense. Let’s break it all down step by step, clearly and human-like.
Current Price: 3330
Bias: Short-term bearish, reactive bounce underway
Focus Zone: 3319–3320 liquidity sweep + key decision structure unfolding
🔹 Macro Context:
CPI came in slightly hot year-over-year (2.7% vs 2.6%) while monthly stayed in-line at 0.3%. That gave the dollar a short-lived boost, and gold reacted exactly how institutions love to play it — sweeping liquidity under 3320, then pausing. Not falling, not flying. Just... thinking.
That reaction matters. Why? Because it shows us indecision. It tells us that gold isn’t ready to break down fully yet, and every aggressive move today was part of a calculated shakeout.
🔹 Daily Structure:
Gold is still stuck below the premium supply zone of 3356–3380. Every attempt to rally there for the past few weeks has failed — including today.
The discount demand area between 3280–3240 is still intact and untouched. So what does this mean?
We are in a macro-range, and price is simply rotating between key structural edges.
🔹 H4 View:
The rejection from CPI at 3355–3365 created a micro CHoCH, signaling the bullish leg is now broken.
After the 3345 fail, price dropped to 3320 — but it hasn’t tapped the full H4 demand at 3310–3300.
H4 EMAs are tilting down, showing pressure. This isn’t a breakout. It’s a correction inside a larger range.
🔸 Key H4 Supply Zones:
3345–3355: liquidity reaction during CPI
3365–3375: untested OB + remaining buy-side liquidity
🔸 Key H4 Demand Zones:
3310–3300: mitigation zone from the CHoCH
3282–3270: deep discount and bullish continuation zone if current fails
Structure-wise: We are in a correction, not a clean uptrend. That’s why every bullish attempt fails unless confirmed.
🔹 H1 Real Structure
This is where things got tricky today.
Price formed a bullish BOS back on July 14, when we first pushed into 3370. That was the start of the bullish leg.
But today, we revisited the origin of that BOS, right near 3320. This is a sensitive zone.
If it holds → it’s still a retracement.
If it breaks → we lose the bullish structure and shift full bearish.
So far, price touched 3320, bounced weakly, but has not printed a bullish BOS again.
🔸 H1 Zones of Interest:
Supply above:
3340–3345: micro reaction zone
3355–3365: CPI origin rejection
3370–3375: final inducement
Demand below:
3310–3300: current flip test
3282–3270: if this breaks, bias flips bearish
Right now, we are between zones. Price is undecided. RSI is oversold, yes — but that alone is never a reason to buy. We need structure. We need BOS.
🔻 So… What’s the Truth Right Now?
✅ If 3310–3300 holds and price builds BOS on M15 → a clean long opportunity develops
❌ If 3310 breaks, and we lose 3300, structure fully shifts and opens downside to 3280–3270
On the upside:
Only look for rejections from 3355–3365 and 3370–3375
Anything inside 3325–3340 is noise. No structure, no clean RR.
Final Thoughts:
Today’s move was not random. It was a classic CPI trap: induce longs early, trap shorts late, and leave everyone confused in the middle.
But we don’t trade confusion — we wait for structure to align with the zone.
If M15 or H1 prints a BOS from demand, that’s your green light.
If price collapses under 3300, flip your bias. The chart already told you it wants lower.
No predictions. Just real reaction.
—
📣 If you like clear and simple plans, please like, comment, and follow.
Stay focused. Structure always wins.
📢 Disclosure: This analysis was created using TradingView charts through my Trade Nation broker integration. As part of Trade Nation’s partner program, I may receive compensation for educational content shared using their tools.
— With clarity,
GoldFxMinds

Weekly XAUUSD Outlook (July 14–19, 2025)Hey team — we're entering a decisive week on gold as macro tensions heat up and price dances inside a key premium range. Let’s dive into what the chart is telling us.
🔸 HTF Bias: Weekly Structure Breakdown
Bias: Bullish with exhaustion signs
Current candle: Bearish rejection forming after last week's lower high inside the premium range
Trend: Still bullish overall, but stalling inside a distribution-like pattern
Weekly structure:
Confirmed CHoCH in early 2023 launched the bullish leg
Break of structure toward Higher High (HH) continues but weak high was created near 3500
We’re currently inside a weekly premium range, rejecting the upper quadrant
🔸 Key Weekly Confluences:
Zone Type Price Level Confluences
🔼 Resistance 3490–3500 Weak High + Premium zone + FVG + RSI divergence
🔼 Upper Range 3450–3470 Historical imbalance fill + EMA5 overextension
🔽 Support 3355–3320 Weekly OB + Discount side of premium leg + FVG
🔽 Deep Support 3200–3170 Last strong demand + BOS origin + RSI oversold risk zone
Fibonacci Range: 3500 = top of the bullish extension; 50% retracement sits around 3250
RSI (Weekly): Starting to curve down from overbought territory — watch for structure cracks
EMAs (5/21/50): Strong upside lock remains but a flattening 5EMA hints short-term slow-down
🗓 Macro + News Context:
This week is loaded with high-impact U.S. data and a parade of FOMC speakers:
Core CPI (Monday) and Retail Sales (Thursday) = critical for short-term inflation outlook
FOMC members speaking throughout the week = high chance of volatility spikes
Pre-G20 positioning (Friday–Saturday) could lead to risk-off flows or safety bids on gold
Watch Crude Oil Inventories and Building Permits for risk sentiment impact
The combination of CPI, retail sales, and continuous Fed commentary could cause abrupt sentiment swings — especially if inflation surprises to the upside again.
⚠️ What to Watch This Week:
Any weekly close above 3470 = potential sweep into weak high (3500)
Failure to hold 3355 zone = opens the door to revisit the deeper OB around 3200
Look for a lower high inside premium to confirm bearish weekly intent — otherwise we remain bullish
Any bounce from 3320 must show strong volume + FVG reaction to confirm continuation
✅ Final Notes:
This week is all about patience. We’re in a premium exhaustion phase, and with heavy macro catalysts on the table, gold is primed for a decisive breakout — up or down.
Stay flexible. Let price show its hand around the major zones. We’ll refine sniper entries on H4 and H1 once the weekly opens fully.
—
📌 If this breakdown helped, hit 🚀🚀🚀 follow @GoldFxMinds🔔 for daily updates as this structure develops and drop a comment:
Will gold sweep 3500 or collapse toward 3200? 👇
📢 Disclosure:
This analysis is based on the Trade Nation TradingView feed. I’m part of their Influencer Program and receive a monthly fee.
⚠️ Educational content only — not financial advice.
H4 Outlook | XAUUSD Monday • June 30 • 2025Hey fam,
Fresh week on gold — clean structure, clean levels, clean execution ahead. Forget the noise. We trade price, we trust precision.
🔍 Market Flow & Bias
Gold remains bearish on the H4 timeframe.
Lower highs, lower lows, clean rejection from supply, and all EMAs (21/50/200) aligned down. RSI hovers near 30, showing heavy momentum — not exhaustion yet.
Price is coiled, not crushed. If structure holds, we follow the short flow into deeper zones.
📌 Bias: Bearish below 3325. Pullbacks into supply = opportunity.
—
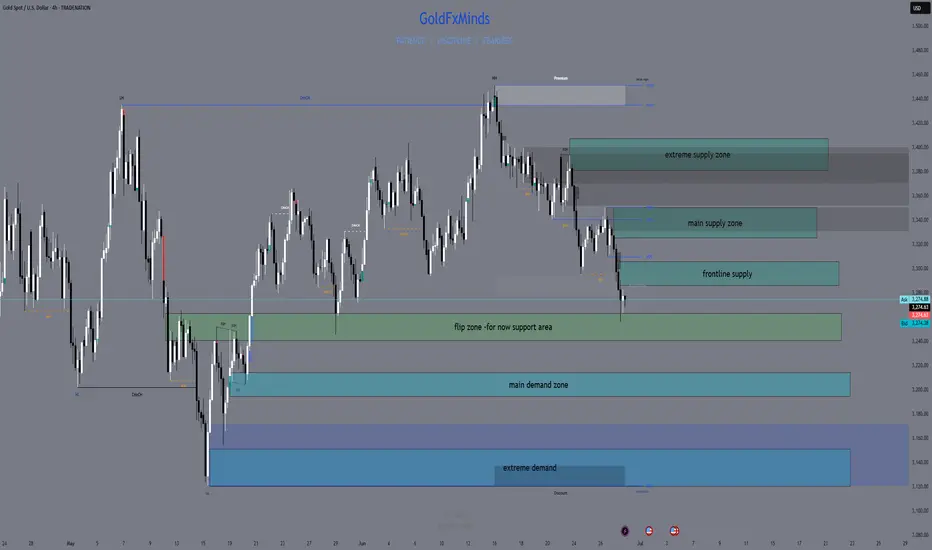
🧱 Zones of Interest (Clean & Confluent)
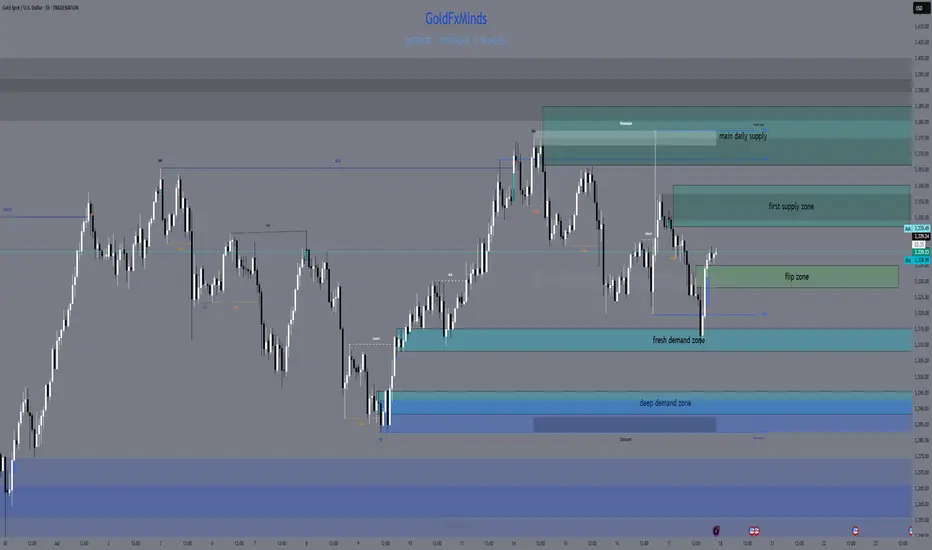
🔺 Zone 1 – 3380–3405 | Extreme Supply
Top OB zone with resting liquidity above. If price sweeps this level and fails, expect a sharp reversal. Only valid with reaction (CHoCH or bearish engulfing).
🔺 Zone 2 – 3325–3350 | Main Supply
Strong H4 breaker block. Origin of the last major selloff. Already defended once — if it holds again, look for sniper shorts from within.
🔺 Zone 3 – 3285–3305 | Frontline Supply
First inducement zone. Clean micro-OB that could give early fade trades. If bulls break through, Zone 2 becomes magnet.
⚖️ Zone 4 – 3260–3240 | Flip Shelf
Range base. If price holds, bulls might step in short-term. But a clean break below shifts momentum fully toward lower demand.
🟢 Zone 5 – 3215–3195 | Main Demand
Unmitigated OB with imbalance. If gold drops here with momentum and forms rejection wicks or CHoCH on LTF → long opportunity for bounce.
🟢 Zone 6 – 3150–3120 | Extreme Demand
Macro swing demand. Deepest discount level on the chart. Valid only if market flushes — this is the “last stand” for buyers.
—
🎯 Key Levels Zone Cheat-Sheet
Above
• 3380–3405 → Extreme Supply (trap zone)
• 3325–3350 → Main Supply block
• 3285–3305 → Micro OB inducement
Below
• 3260–3240 → Flip shelf (structural pivot)
• 3215–3195 → Main buy zone
• 3150–3120 → Deep macro demand
—
⚔️ Execution Plan
We sell from reaction zones, not assumptions.
We buy from confluence, not hope.
Every zone above comes with condition: no confirmation, no entry.
—
📣 Found this useful?
Drop a ⚔️ in the comments, tag your bias, 🚀and follow GoldFxMinds for sniper-level execution.
This isn’t guessing. This is structure. This is clarity.
Daily Outlook | XAUUSD June 30, 2025Hey traders,
Fresh week, clean structure. Let’s lock in the key levels and let price do the talking.
🌐 Macro Context
It’s a heavy week for USD – all major data drops before Friday:
Tuesday: ISM Manufacturing + Powell speaks
Wednesday: ADP Employment
Thursday: NFP, Unemployment Rate, ISM Services
Friday: US holiday – markets closed
📌 This means liquidity will build into Thursday, then fade. Expect gold to stay range-bound early in the week, unless momentum shifts hard today. Volatility should peak around NFP.
🧭 Daily Structure & Bias
Gold opened weak under 3287, still below 21EMA and 50EMA. The structure shows lower highs, bearish control, and no signs of strength reclaiming ground. RSI is at 42 — momentum down, but not oversold yet. Unless price breaks back above 3340, sellers stay in control.
✅ D1 Bias: Bearish while under 3340
📌 Key D1 Zones to Watch
🔺 D1 Breaker Block – 3340–3355
Former support, now clean resistance. Includes 50EMA and last failed closes. If price rejects again here, bearish continuation likely. A daily close above 3355 flips short bias.
🔺 D1 Supply + FVG – 3385–3405
Unmitigated imbalance from early June. If price pushes through 3355, this is the next upside magnet. Good spot for first reaction.
⚖️ D1 Decision Zone – 3287–3265
Current price zone. Multiple past reactions. A daily close below 3265 confirms breakdown. Holding above = more choppy range.
🟢 D1 Reaction Shelf – 3210–3180
Minor support zone from April candle bodies. Can slow price, but not strong enough for reversal on its own.
🟢 D1 Demand Block – 3155–3120
First major HTF demand. Includes 200EMA, strong structure, and previous breakout base. If price sells into it fast, watch for rejection — but only with confirmation.
🟢 D1 Macro Demand – 3090–3055
Final line of macro defense. Clean imbalance + demand from February. Valid only if sentiment breaks post-NFP.
✅ Final Summary
• Below 3265 = structure breaks → opens 3180
• 3155–3120 = real support zone
• Below 3120 = macro shift risk
• Reclaiming 3340 = short bias invalid
• Break above 3385 = continuation possible
📌 Today is all about the close. No confirmation = no trade. Thursday is the real trigger — be positioned, not exposed.
—
📣 If this gave you clarity and structure, drop a 🔥, share your bias, and follow GoldFxMinds for sniper plans with zero fluff — only clean, confirmed price action.
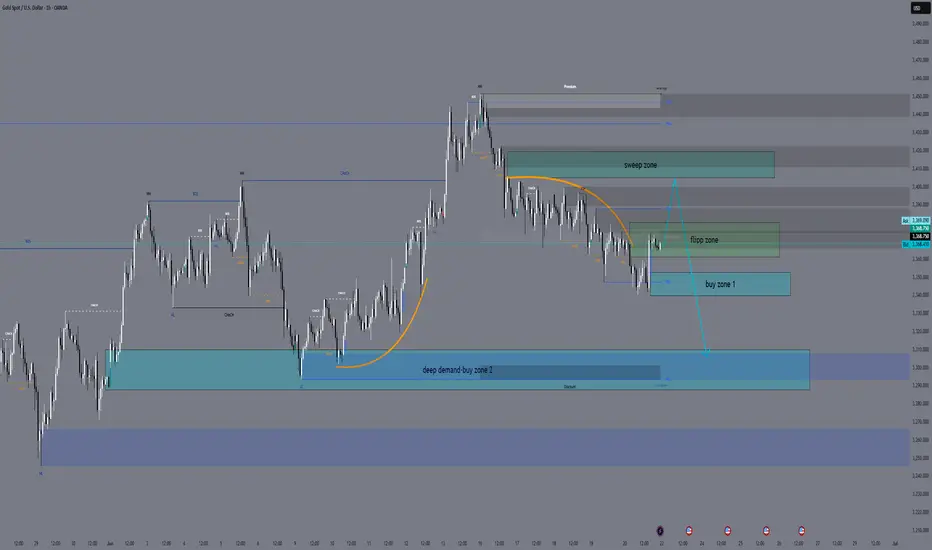
XAUUSD Daily Sniper Plan – June 25, 2025👋👋 Hello traders!
Gold is still moving down strongly. Today’s plan is made for traders who want clear and precise levels. Let’s look at the structure, important zones, and where to watch for trades.
1. Higher Timeframe Overview (Daily, H4, H1)
Daily: Price is falling near the 200 EMA around 3323. RSI shows less buying strength. We wait for a clear move.
H4: The trend is down with lower highs at 3418 and lower lows at 3311. RSI is low, showing weak buying. Price is near the 200 EMA.
H1: Small bounce up to 3328–3332 resistance. RSI is weak, so price must break this zone to move higher.
2. Lower Timeframe Details (M30, M15)
M30: EMA5 crossed above EMA21 but price is near resistance at 3328–3332. RSI is neutral.
M15: Price broke a small wedge up but is limited by EMA21 and EMA50. RSI near 58 shows price could be overbought.
3. Key Zones and How to Trade Them
🔻 Sell Zone: 3345 – 3352
Look for signs that price rejects this zone (wicks, bearish candles) before selling.
🟡 Flip / Decision Zone: 3360 – 3380
Do not trade here. This zone will show if trend changes. Wait for clear confirmation.
🟢 Buy Zone: 3300 – 3285
Look for price rejection and strong buying signs before buying here.
🟢 Deep Buy Zone: 3265 – 3272
Only buy here if price goes below 3280 and shows strength.
4. What to Do
Current price is about 3323.
If price goes above 3332, watch the sell zone 3345–3352 for a short trade.
If price drops below 3332, expect a move down to the buy zone 3300–3285.
Do not buy above 3360 without a clear trend change.
Be patient and wait for good signals.
5. Important Levels
Zone Price Range Notes
Sell Zone 3345 – 3352 Best short zone
Flip Zone 3360 – 3380 Wait and watch, no trades
Buy Zone 3300 – 3285 Good buy zone
Deep Buy Zone 3265 – 3272 Last buy chance
📣 If you like clear and simple plans, please like, comment, and follow
I’m part of Trade Nation’s Influencer Program and get paid to use their charts.
XAUUSD Daily Sniper Plan – June 24, 2025“Snipers wait. Structure tells the story.”
Hello traders! The market is stuck between the FOMC high at 3452 and the confirmed low at 3340. Price is compressing under H1 supply and above a key liquidity pocket. Here's your full plan with all sniper zones — now including a decision zone for intraday confirmation.
📰 Macro + Fundamental Context
Powell Testimony + multiple FOMC speeches today → high potential for dollar-driven volatility.
Inflation concerns and hawkish tone expected → short-term gold bearish pressure unless structure reclaims 3415+.
Smart money likely hunting liquidity both below 3340 and above 3400.
🔸 HTF Structure Summary (D1 → H4 → H1)
D1: Consolidation between 3452 and 3340. No new BOS.
H4: LL formed at 3340. LH not confirmed. Market is compressing under resistance.
H1: CHoCH + BOS confirmed. Current price sits in mid-range.
🔍 Sniper Entry Zones
🟥 Sell Zone 1: 3382–3395
H1 supply zone with previous rejection.
Includes order block + FVG.
Valid for new short entries if price returns and rejects.
🟥 Sell Zone 2: 3406–3420
High-risk spike zone from FOMC.
Only valid during fast, news-driven price movement.
Not a default entry unless confirmed rejection.
🟨 Decision Zone (Flip Area): 3360–3372
This is the key intraday flip level.
If price stays below, sell zones remain valid.
If price closes above, short bias is invalid and market may aim higher.
Use this zone to confirm bias before entering from either side.
🟩 Buy Zone 1: 3335–3345
Strong demand under equal lows.
OB + small imbalance on M15.
Valid for intraday long setups if confirmed with bullish price action.
🟦 Buy Zone 2: 3305–3285
H4 demand zone with major liquidity below.
Deep reversal area — only valid if price breaks 3340.
Smart money may be waiting here.
📌 Key Levels Summary
Zone Type Price Range Explanation
🔺 Premium OB 3450–3480 Daily supply zone
🟥 Sell Zone 1 3382–3395 Active H1 supply
🟥 Sell Zone 2 3406–3420 FOMC wick inducement
🟨 Flip Zone 3360–3372 Decision area — confirm bias
🟩 Buy Zone 1 3335–3345 Demand under equal lows
🟦 Buy Zone 2 3305–3285 H4 demand + deep liquidity
📣 Final Notes
📌 The market is at a critical moment. The flip zone (3360–3372) will decide tomorrow’s control: bear continuation or deeper retracement.
Watch price at the zone. Let the structure speak. Trade only where the logic is clean.
👁 Good luck in the market tomorrow, traders!
— GoldFxMinds
🟨 Disclosure: I am part of TradeNation’s Influencer Program and receive a monthly fee for using their TradingView charts in educational work.
XAUUSD Daily Sniper Plan – Monday, June 23, 2025Current Price: 3368.76
Trend: Bearish on H4 | Corrective on H1 | Weak Bullish Attempt on M15
Market Context: Gold is consolidating under EMA pressure after FOMC. Price is pinned inside a key flip zone, awaiting Monday’s fundamental triggers.
🔸 HTF Overview (D1, H4, H1)
📰 Macro + Economic Context – Week of June 23–28:
This is a high-impact week for USD with Fed speeches, inflation, and growth data. Monday opens with caution:
Monday, June 23
🟠 FOMC Member Waller Speaks
🔴 Flash Manufacturing & Services PMI
🟠 Existing Home Sales
Tuesday, June 24
🔴 Fed Chair Powell Testifies
🟠 CB Consumer Confidence
🟠 Richmond Manufacturing Index
Wednesday, June 25
🔴 Powell Testimony (Day 2)
🟠 New Home Sales
Thursday, June 26
🔴 Final GDP q/q
🔴 Unemployment Claims
🟠 Durable Goods Orders
🟠 Pending Home Sales
Friday, June 27
🔴 Core PCE Price Index
🟠 Revised UoM Consumer Sentiment
📌 Monday is lighter in impact, but PMI data and Waller’s speech may spark the week’s directional bias. Avoid trading blindly into PMI spikes.
H4 Structure & Bias:
Bearish trend intact: Lower High = 3418, Lower Low = 3311
EMAs (21/50/100) aligned downward — price capped below 3380
RSI still under 60 = no bullish momentum
Rejection zone remains valid at 3406–3420 (H4 OB)
Strong demand expected at 3340–3352 and extreme at 3310–3288
🔸 LTF Precision (M30, M15)
Price compressing around 3365–3372
RSI around 56 → indecision
No bullish HH above 3380 = still within bearish control
EMA flattening → prepare for trap setups around NY open
🧭 Trade Scenarios
🔻 Sell Zone – 3406–3420
H4 OB, FVG top, liquidity above 3405
Entry: 3412
SL: 3426
TP1: 3312
TP2: 3288
TP3: 3265
🧠 Wait for sweep or strong bearish reaction — no early entries.
⚠️ Flip Zone – 3360–3380
No-trade zone: EMA cluster + mid-FVG
Only use for confirmations, not entries
🟢 Buy Zone – 3340–3352
OB + demand + Fib retracement
Entry: 3348
SL: 3334
TP1: 3448
TP2: 3472
TP3: 3490
🟢 Buy Zone – 3310–3288
Below LL sweep (3311)
Deep liquidity + OB demand
Entry: 3298
SL: 3280
TP1: 3365
TP2: 3405
TP3: 3440
📍 Key Structural Levels – June 23
Level Type Role
3460 Bull Trap Limit Irrational spike area
3445 FOMC Unfilled wick – trap zone
3426 Sell Zone Risk protection above OB
3418 H4 LH Confirmed bearish structure
3410 OB Midpoint Micro-rejection inside OB
3395 Previous HH Inducement target
3384 FVG Top Minor LTF rejection
3360–3380 ⚠️ Flip Zone MA/FVG compression – avoid entries
3352 OB entry edge Buy Zone 1 upper limit
3340 OB base Buy Zone 1 key level
3311 H4 LL Confirms bear structure
3300 Round Level Psychological + liquidity
3288 OB base Final demand structure zone
3265 Final TP Bearish extension only
✅ Final Action Plan
📉 Stay bearish below 3380 unless a clean HH + OB support forms
⚠️ Avoid trading inside 3360–3380 flip zone during NY PMI data
🛒 Longs valid only from 3340 or 3310 with confirmation (RSI, PA, OB)
🧠 Focus on structure integrity and clean OB rejections only
💬 Will you fade the 3412 OB or wait for the sniper bounce at 3348?
🔔 Follow and 🚀@GoldFxMinds for premium breakdowns, macro updates, and real-time sniper execution guidance.
🔹 Disclosure: As part of Trade Nation’s Influencer Program, we receive monthly compensation for using their charts.
GoldFxMinds
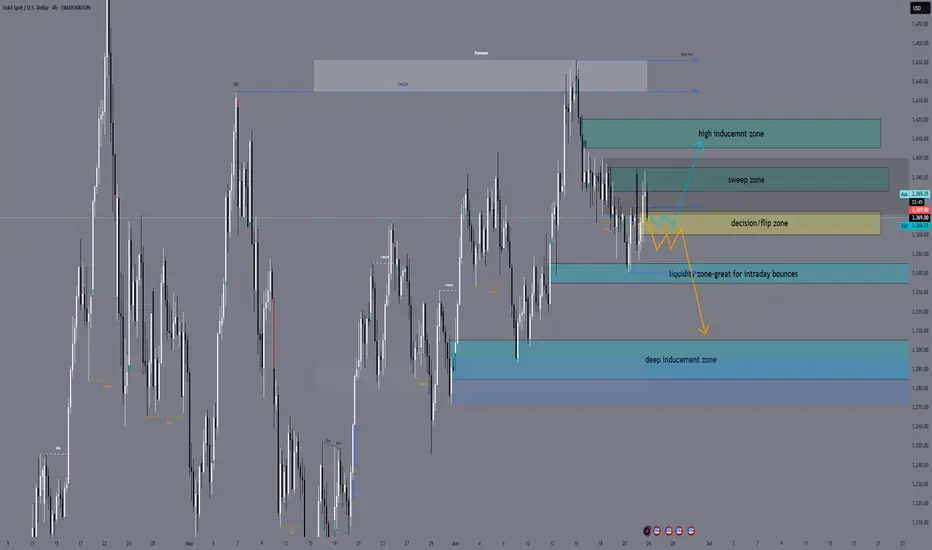
H4 Outlook – Between Flip and Trap👋 Hey Gold minds, welcome to another sniper-level breakdown. We're mid-range between major sweep zones and watching carefully how price reacts around the current compression under key EMAs and FVG. Let’s break it down:
🔸 MACRO + FUNDAMENTAL CONTEXT
USD drivers this week:
🔹 Monday–Tuesday: Multiple FOMC Members speaking
🔹 Wednesday: Powell Testimony
🔹 Thursday: Final GDP + Unemployment Claims
🔹 Friday: Core PCE and UoM Inflation Expectations
Macro sentiment:
FOMC speakers remain hawkish while inflation is sticky. Gold reacts defensively as markets price in Powell’s tone. Liquidity traps on both sides still active. Gold consolidates below key liquidity at 3405, potentially setting up for either expansion or sweep rejection.
🔸 H4 STRUCTURE + BIAS
Market structure:
Price formed a Lower High (3452) and confirmed bearish intent with a break of structure to the downside (CHoCH & BOS).
Currently compressing under H4 Fair Value Gap and retesting an internal OB + EQ zone around 3360–3370, showing signs of rejection.
EMA Cluster:
Price is compressing between EMA 21 / 50 / 100, failing to reclaim EMA100.
EMA5 is crossing under EMA21 – short-term bearish bias holds.
Bias: 🔻 Bearish to neutral
As long as price stays under 3380, supply remains in control. Only a break and close above 3405–3415 would flip bias bullish short term.
🧭 Sniper Zones – H4 Precision Map
🔷 Type 📍 Price Zone 📌 Justification
🔵 Buy Zone #1 3315 – 3340 Valid OB , previous HL structure, FVG reaction support
🔵 Buy Zone #2 3280 – 3302 Deeper demand pocket, untapped imbalance
🟠 Flip Zone 3360 – 3380 FVG + internal OB + EMA compression = key battle zone
🔴 Sell Zone #1 3405 – 3415 Internal OB + unmitigated premium zone under LH
🔴 Sell Trap Zone 3440 – 3460 Extreme rejection zone — 3452 HH sweep logic + OB
🔸 Price Action Expectations (PA)
If price rejects 3360–3380, expect a clean push back to 3320, with possible deeper draw to 3300–3285.
A clean break and close above 3380 (not just a wick) may open the door for a sweep of 3405, where sellers are expected.
Only an aggressive news-driven breakout above 3415 would unlock the final trap zone toward 3450+ – lower probability unless Powell surprises.
✅ Conclusion & Execution Plan
🎯 Watch how price behaves around the Flip Zone — this is the decision point.
📉 Main bearish confirmation = strong rejection at Flip Zone or 3405.
📈 Bullish continuation only above 3415 with volume and closing strength.
💎 Best RR zones:
Sell 3405–3420 → targeting 3360 / 3340
Buy 3315–3340 → targeting 3360 / 3380
🔥 If this breakdown helped sharpen your edge, drop a 🚀 in the comments and like the post!
🔔 Follow GoldFxMinds for more real-time, structure-based sniper plans.
🧠 Precision isn't optional. It's the edge.
🔹 Disclosure: As part of Trade Nation’s Influencer Program, we receive monthly compensation for using their charts.
GoldFxMinds
XAUUSD Daily Outlook | June 23, 2025👋 Hello Gold traders!
We’re entering a new week with structure sharpening around key zones. Price is now hovering just below the decision shelf at 3385, and all eyes are on whether bulls defend structure — or bears trigger the first real trap. Let’s zoom in with pure Daily focus and zero noise.
🔸 DAILY STRUCTURE OUTLOOK
Gold remains in a clear bullish trend on the Daily timeframe, with the last confirmed Higher High at 3452. However, current price is in a retracement phase, testing the area just below the BOS and reacting to recent liquidity sweeps.
Despite rising USD pressure, the bullish structure remains intact unless a daily close breaks below 3315.
📌 Daily Bias: Bullish (retracement phase active)
🧭 Macro Context:
Heavy Fed week: Powell testifies Tue & Wed, Core PCE and Consumer Sentiment hit Fri.
USD may remain supported short-term, but gold still benefits from long-term inflation hedge + geopolitical risk flows.
🔹 STRUCTURAL KEY ZONES (D1)
Type Zone Confluences
🟢 Buy Zone #1 3320 – 3340 Daily OB, FVG base, EMA50 , structure HL defense
🔵 Buy Zone #2 3265 – 3285 Untapped OB + imbalance, deeper fib retrace
🟠 Flip Zone 3363 – 3385 Former BOS, FVG retest, minor liquidity shelf
🔴 Sell Zone #1 3405 – 3425 First sweep of equal highs, premium OB, FVG pocket
🔴 Sell Zone #2 3440 – 3460 Extreme bull trap: clean OB top, imbalance cluster
🎯 EXECUTION PLAN
🔍 Flip Zone is your battlefield — if bulls reclaim this zone cleanly, we may revisit 3405.
📉 3405–3425 offers the first sniper short opportunity: liquidity sweep + OB + FVG = prime short trigger.
📈 3320–3340 is the cleanest high-RR long zone — only enter if price reacts with strength and forms a rejection candle or bullish engulfing.
🧊 If 3320 fails, standby at 3265–3285 for a deeper correction entry backed by clean OB/FVG logic.
✅ SUMMARY & ACTION PLAN
Wait for confirmation at the Flip Zone — do not force direction.
Most precise sniper trades expected:
🔻 Sell from 3405–3425 → target Flip Zone
🔺 Buy from 3320–3340 → target 3385–3400
Only engage with clear OB reactions and strong PA confirmation — no bounce chasing.
💬 If this outlook gave you clarity, drop a 🚀 and a like to support the work — it helps more traders find it.
💡 Got feedback or want to ask something? Comment below — we read everything.
📌 Follow GoldFxMinds for high-precision sniper plans, every single day.
📌 Disclaimer: I'm part of Trade Nation's Influencer Program and receive compensation for using their charts on TradingView. This content is for educational purposes only.
— GoldFxMinds
XAUUSD Weekly Outlook | June 23–27, 2025👋 Hey gold traders! As we close out the FOMC week and head into the final stretch of June, gold continues to hold bullish structure — but this week's candle is entering a very sensitive premium area. Let's break it all down in full top-down clarity:
🔍 Weekly Structure Update
✅ Weekly BOS confirmed since November 2023
✅ Price holding above EMA 5/21/50 — bullish lock intact
🔼 Current HH printed at 3452
📍Price is now entering a weekly FVG + supply trap zone around 3440–3460
🟣 RSI divergence starting to appear — caution in premium
🗺 Key Weekly Zones
Type Price Range Context
🔵 Demand Zone 3150 – 3190 Weekly OB + EMA50 confluence
🟣 FVG Support 3284 – 3320 Fresh imbalance post BOS
🟠 Flip Zone 3363 – 3385 Retest of BOS + FVG bottom
🔴 Sell Trap Zone 3440 – 3460 Weekly OB + liquidity sweep area
🧠 Bias This Week
📌 Bullish, but extended.
We expect a reaction from 3440–3460, not blind continuation.
The next healthy buy opportunity is only valid on a retrace toward 3320–3280, aligned with imbalance + structure.
🧭 GoldFxMinds Game Plan
Above 3440–3460 = overextension — wait for trap/sweep confirmation 🧨
Below 3363 = bearish flip zone — risk of revisiting 3280
Ideal buy = 3284–3320 → only on bullish PA or reversal confirmation
📰 Upcoming Economic Events (June 23–27)
🗣 FOMC Speakers flood the week (Waller, Powell, Williams, Goolsbee, Hammack, etc.)
🏠 Existing & New Home Sales, Consumer Confidence, Pending Home Sales
🛢 Crude Oil & Natural Gas Inventory reports
📊 Final GDP q/q, Core PCE, Personal Spending/Income
📉 Durable Goods, Unemployment Claims
🧪 Bank Stress Test Results (Friday)
⚠️ This is a dense news week — stay alert for surprise volatility, especially around Powell’s testimonies (Tue & Wed).
⚠️ Summary:
We are no longer in discount — we are inside the premium trap. Gold remains bullish, but 3440–3460 is a red flag zone. If this becomes the top, watch the flip at 3363–3385. Only re-enter long if structure confirms.
💬 If you found this helpful, drop a comment, give it a like, and make sure to follow GoldFxMinds for more sniper-level updates every week!
📣 This post was made using the Trade Nation chart feed. As a partner in their influencer program, I receive compensation for using and sharing their tools.
XAUUSD Daily Sniper Plan – June 20, 2025🧭 Market Context
Following FOMC volatility and a Wednesday bullish reaction off 3351, XAUUSD is now hovering near 3370. The structure remains compressed between a flat EMA cluster and a key supply zone above. Thursday may bring low-to-moderate volatility early on, but watch for reaction after Philly Fed Manufacturing and CB Leading Index data during NY. Also, stay alert for a tentative Fed Monetary Policy Report release that may trigger later-session volatility.
🔍 Structural Overview
Daily Bias: Neutral-to-Bullish
H4 Trend: Still respecting higher lows but price is trapped under dynamic resistance
H1–M15: Consolidation between 3351 demand and 3388 supply
RSI: Mixed; compression between 47–55
EMA Flow: Flat on M30/H1; slight compression building for breakout
Liquidity Pools:
Resting buy-side above 3388
Resting sell-side below 3351 and deeper toward 3340
📍 Key Zones to Watch
🔵 BUY ZONE #1 – 3345–3352
🔹 Demand zone | Previous NY reversal base
🔹 M15 OB + EQ zone + liquidity sweep
🔹 Below full EMA stack → oversold entry if NY flushes pre-news
🔵 BUY ZONE #2 – 3328–3340
🔹 Deeper HTF demand + RSI oversold potential
🔹 Bullish CHoCH reaction zone from last week
🔹 High RR for recovery play if price collapses during NY news
🔴 SELL ZONE #1 – 3384–3395
🔸 Rejected on FOMC wicks
🔸 Key supply zone + EMA200 (M30/H1)
🔸 Fakeout zone → valid if price spikes before NY volatility
🔴 SELL ZONE #2 – 3405–3415
🔸 Secondary high liquidity trap
🔸 Last bullish FVG inefficiency
🔸 To be used only in case of irrational spikes post-data
🟠 FLIP ZONE – 3368–3375
🔸 Compression zone + recent CHoCH
🔸 EMA50 (M15–H1) aligning
🔸 Watch for breakout and real volume entry → flip zone into continuation
📌 Note:
Tomorrow’s news events:
Philly Fed Manufacturing Index
CB Leading Index m/m
Fed Monetary Policy Report (Tentative)
This could bring range plays early and a directional break later. Stay patient and wait for confirmation inside zones. Flip zone is ideal for quick scalps if volume picks up.
🔥 Stay sharp and don’t force trades in pre-news chop. Clean zones only.
Tag us if you’re using the plan, and don’t forget:
🧠 Think in structure. Enter in precision.
– GoldFxMinds
🟢 Disclosure: I am part of TradeNation's Influencer program and receive a monthly fee for using their TradingView charts in my analyses and educational articles.
June 19 XAUUSD Setup — FOMC Aftershock or Bull Trap? Hey traders 👋
After yesterday’s FOMC fireworks and a weak reaction to initial retail sales data, gold broke structure into 3363 and is now floating below key resistance. Price is compressing under the previous H1 lower high, and liquidity continues to build on both sides — perfect conditions for engineered spikes.
Let’s break it down clearly.
🌍 Macro & Sentiment
Yesterday’s FOMC left rates unchanged, but Fed tone leaned hawkish.
Retail Sales and Unemployment Claims disappointed — slight downside pressure on the dollar.
Geopolitical front remains tense: no ceasefire in Gaza, Iran-Israel rhetoric escalates, and Russia-Ukraine conflict is ongoing.
Liquidity is king — and gold is being boxed for the next big move.
📉 Bias & Structure
Daily: Compression after FOMC, lower high remains in control.
H4: Bearish break below 3380, EMA21 hovering above price.
H1: Trendline structure broken, EMA5/21 forming bearish cross, RSI below 50.
Fibo: H1 drawn from 3452 to 3363 — key golden zone at 3405–3415.
🎯 Bias: Tactical Bearish under 3415 — looking for short-term bounces or premium traps to sell.
🧠 Sniper Zones
🔻 Sell Zones
1️⃣ 3405 – 3415
→ Key golden zone + EMA21 + FVG
→ Monitor M15/M5 rejection for continuation sells
2️⃣ 3435 – 3445
→ Premium OB trap zone
→ If price spikes irrationally, this becomes the extreme reversal area
🔺 Buy Zones
1️⃣ 3365 – 3380
→ Golden buy zone — real fib confluence
→ Already tapped today, but any clean retest may offer reactive bounce trades
2️⃣ 3335 – 3345
→ Extreme flush zone — only valid if deep dump occurs
→ Watch for exhaustion and M15 reversal confirmation
🔻 Emergency Buy Zone:
3305 – 3292
🧠 Why this zone?
✅ H4 untested Order Block + FVG (June 11 candle).
✅ 78.6% Fibonacci retracement (H1 swing from 3452 → 3363).
✅ RSI likely to print oversold.
✅ Deep discount structure — potential final inducement for reversal.
🔔 Important:
This is a backup zone, not for blind entries.
It only becomes active if 3335 breaks with conviction (full candle body close + volume).
Look for M15/M5 confirmation (divergence + price action signal) before engaging.
🔄 Flip Zone
3390 – 3398
→ Volume zone from FOMC + OB test
→ If reclaimed cleanly, may flip intraday bias short-term
📌 Battle Notes
Gold tapped 3363 today, reacting mildly.
If price retraces toward 3405–3415, I’ll watch for shorts — but no early entries.
Below 3365, watch for another bounce or setup around 3345.
Flip zone remains indecisive until confirmed with volume.
🧭 Plan Recap
→ Bearish under 3415
→ Pullback into 3405–3415 = short setup
→ Retest 3365–3380 = bounce watch
→ Flush into 3335 = reversal zone
→ 3435+ = irrational spike trap
🧠 Stay sniper. Wait for price to come to your zones — and execute only on confirmed reactions.
—
🚀 If this helped bring clarity, tap that 🚀, leave your bias in the comments, and hit FOLLOW for real structure-based trading.
🟨 Disclosure: I am part of TradeNation's Influencer program and receive a monthly fee for using their TradingView charts in my analyses and educational articles.
— GoldFxMinds 🧠✨
XAUUSD Sniper Plan – June 18, 2025Hey GoldMinds! 💛
After a messy reaction to today's Retail Sales miss, Gold continues to coil inside a premium range. With FOMC projections, rate statement, Powell’s press conference, and Unemployment Claims lined up next — volatility is far from over. Here’s our refined tactical plan 👇
🌍 Macro & Geopolitical Context
• US Retail Sales disappointed — signaling cracks in consumer demand, potentially weighing on the USD.
• Unemployment Claims up next — job market weakness could add pressure on USD if claims increase.
• FOMC day: Expect massive liquidity sweeps during economic projections, rate decision, and Powell’s press conference.
• Geopolitical tensions persist — no ceasefire in Middle East conflicts (Israel–Iran), and Russia–Ukraine remains unstable. Safe haven bids may still support gold on dips.
🧭 Bias: Tactical Neutral → Bearish
• Price remains capped under 3415–3445 supply
• EMAs are showing indecision: H1 trapped between EMA 5–21, H4 leaning weakly bullish
• RSI on most TFs is neutral → market waiting for event catalyst
• Structure suggests bull trap risk if 3415 holds
🔑 Key Sniper Zones
🔻 Sell Zones
1️⃣ 3405 – 3415
→ H1-H4 OB + FVG + sweep confluence
→ Premium liquidity pocket — ideal trap for reactive sellers
→ Watch M15 for rejection confirmation
2️⃣ 3430 – 3445
→ Upper inducement + clean OB + imbalance
→ Only valid if price spikes irrationally post-FOMC
→ Stronger reversal setup likely here
🟡 Pullback Monitor Zone
3390 – 3398
→ No trade zone — watch for signs of rejection or continuation
→ Could act as short-term resistance before deeper moves
🟢 Buy Zones
1️⃣ 3365 – 3380
→ Bounce zone with clean confluence: FVG, OB, previous HL
→ Best used for reactive entries after wick flushes
→ Key pivot zone with HL structure
→ OB + FVG combo, ideal for tactical long bounces with M15/M30 confirmation
2️⃣ 3335 – 3345
→ Deeper structure retracement zone
→ Contains H4 OB, imbalance + golden Fibo pocket
→ Most reactive buy zone post-event volatility
🧠 Battle Plan Recap
• If price fails to break 3415, we prepare for further bearish continuation
• Bounces expected at 3365–3380 — confirmation needed
• Final long setup lives at 3335–3345 — cleanest buy zone if FOMC triggers selloff
• 3390–3398 is not for entries — only reaction monitoring
• FOMC + Claims = high risk day → trade only sniper zones
✨ Final Notes
Volatility creates traps. Structure gives clarity.
We don’t predict — we react to the third move.
👇 Found this valuable? Hit the 🚀, follow for more sniper plans, and comment your bias!
Let’s trade like pros, not guessers — GoldFxMinds 🧠✨
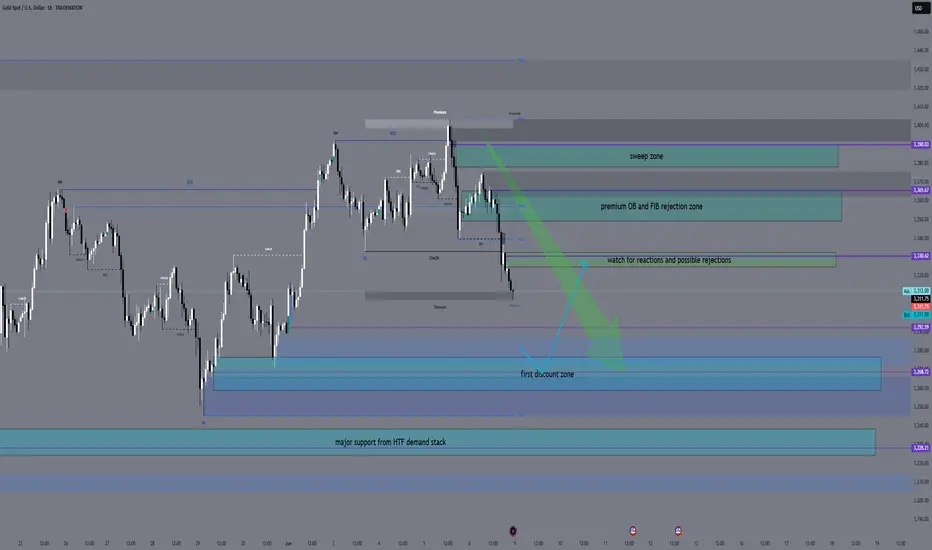
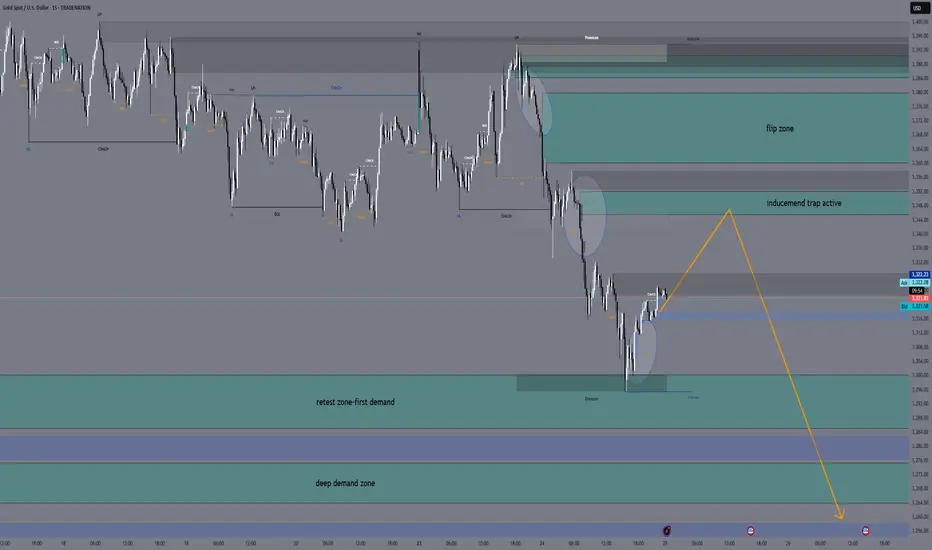
XAUUSD H1 Outlook – Clean Breakdown, Focused Zones in Play👋 Good afternoon, legends!
Here’s your XAUUSD H1 Outlook + Sniper Plan for June 9, 2025. We’re mid-retrace in a bearish shift, and structure is giving us real opportunities both ways.
📍 Bias: Bearish intraday — structure has shifted, and we’re working inside discount + premium rotations.
🔹 1. 🔍 H1 Structure Summary
Confirmed CHoCH → BOS → LL below 3314.
Price is sweeping the 3308–3300 weak low, sitting in a sensitive zone.
Expect either pullback to supply or continuation into deeper demand.
🔹 2. 📐 Key Intraday Structure Zones
Zone Type Price Range Notes
🔼 Sell Zone #1 3350 – 3365 H1 OB + supply flip + fib confluence
🔼 Sell Zone #2 3378 – 3390 M15 premium sweep + LH trap
🟣 Flip Zone 3324 – 3332 BOS origin + minor FVG — reactive zone
🔽 Buy Zone #1 3275 – 3260 Discount OB + imbalance cluster
🔽 Buy Zone #2 3238 – 3225 Deep structure demand + M30 liquidity pool
🔹 3. 📊 EMA Alignment
EMA5/21 crossed bearish
Price is under EMA50, 100, and 200 → full bearish EMA pressure
Retracements into premium = opportunities to sell with trend
🔹 4. 🧠 Sniper Flow Commentary
Price is currently tapping weak low zone (3308–3300)
If 3314–3332 acts as resistance, we’re in for continued downside flow
Cleanest sell comes from 3350–3365, but any valid rejection from flip zone is still playable short
Only buy if deep discount zones are hit with confirmation — don’t rush longs in bearish flow
⚔️ Intraday Sniper Plan – June 7, 2025
🔼 Sell Zones
3350–3365 → Premium OB and fib rejection zone
3378–3390 → Final sweep zone above LH
🔽 Buy Zones
3275–3260 → First structural OB in deep discount
3238–3225 → Major support from HTF demand stack
🟣 Flip Zone
3324–3332 → Watch for reaction and possible rejections
✅ GoldFxMinds Final Note
It’s not about predicting — it’s about preparing.
Sell the traps. Buy only strength in structure. Let price prove itself before entry.
Stay focused and confident!💬 Drop your chart view below ,follow for more
— GoldFxMinds view💡