Community ideas
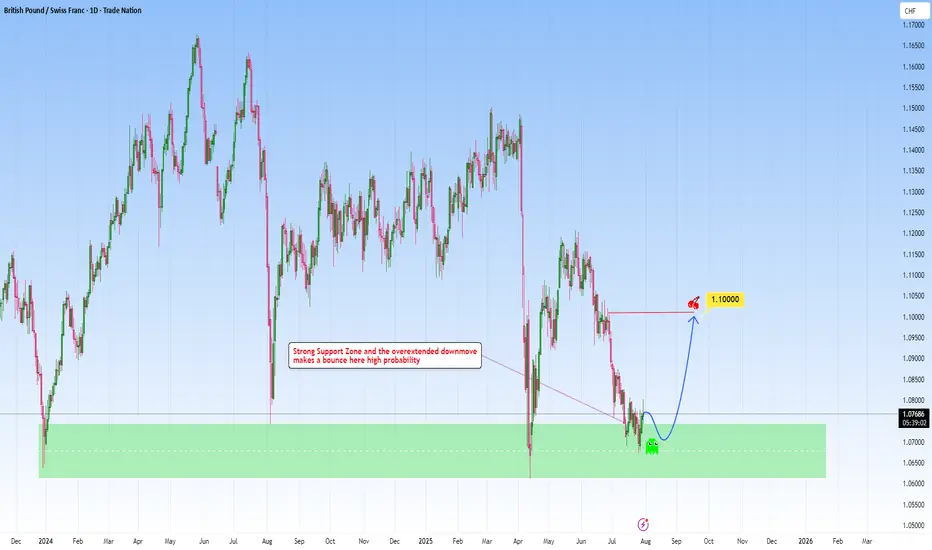
GBPCHF meets strong support: A reversal here is high probabilityLooking at GBPCHF and how it fits within my approach to structure-based trading, this one is really speaking my language.
Price has come down into a key higher-timeframe support zone: a zone that’s proven itself multiple times in the past. Now, price has shown some initial rejection there, making my long position towards 1.1000 a clear, rational target.
What makes this setup different could be the patience behind it. As we let the market complete its downward leg, waited for price to revisit a reliable zone, and now anticipating a bounce back. It’s a move that I’ve captured across my previous charts again and again.
Let me know in the comments what you think
Disclosure: I am part of Trade Nation's Influencer program and receive a monthly fee for using their TradingView charts in my analysis.
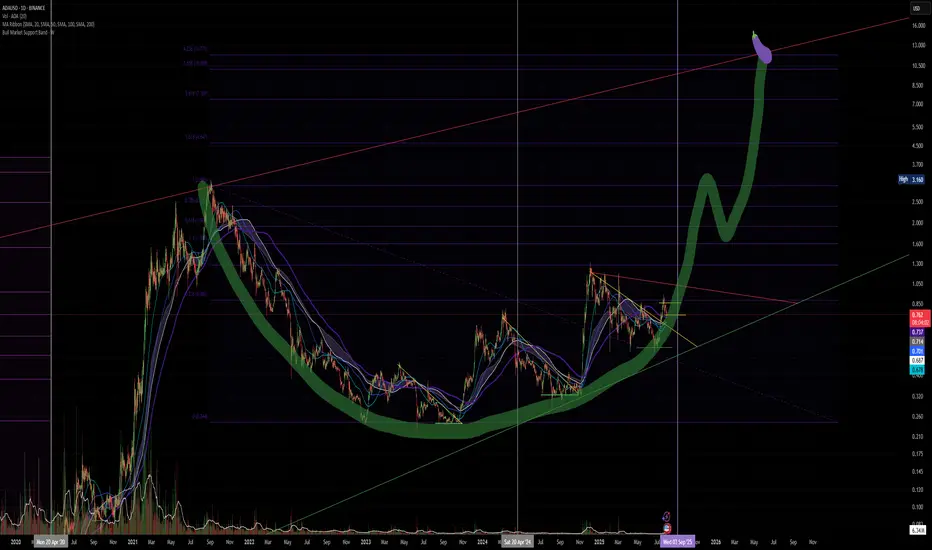
$ADA about to popCRYPTOCAP:ADA currently sits at strong support. and is technically repeating the exact pattern from previous Bull Runs, this does not guarantee repetition but I extrapolate the phrase, the trend is your friend and feel it applies macro scale.
ETF soon
Crypto laws passed
Leios inbound
Glacier drop inbound
CRYPTOCAP:BTC DEFi Inbound
Interoperability expanding
QE inbound
And CRYPTOCAP:ADA IMO is one of the easiest UI and is also among the most cost effective Blockchains to use on a daily basis.
This Chart is a thesis and I like Crayons.
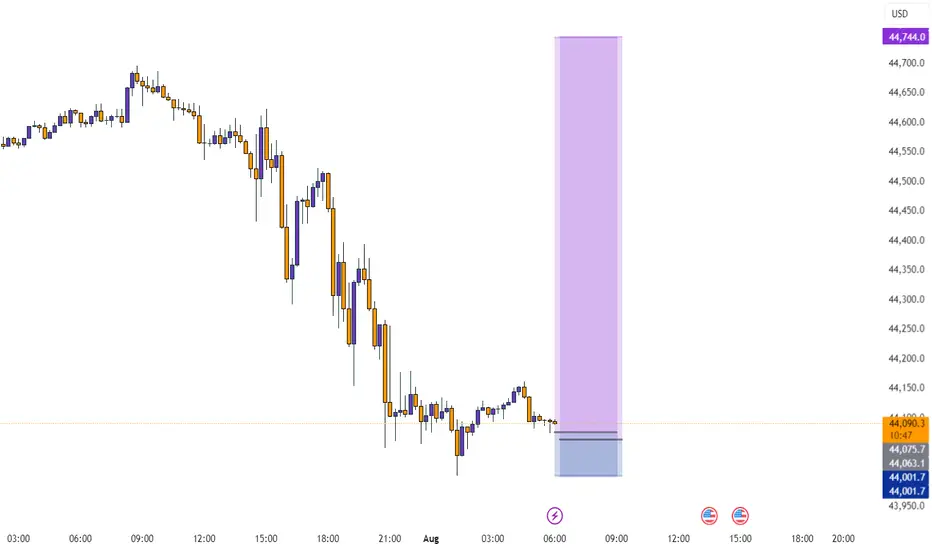
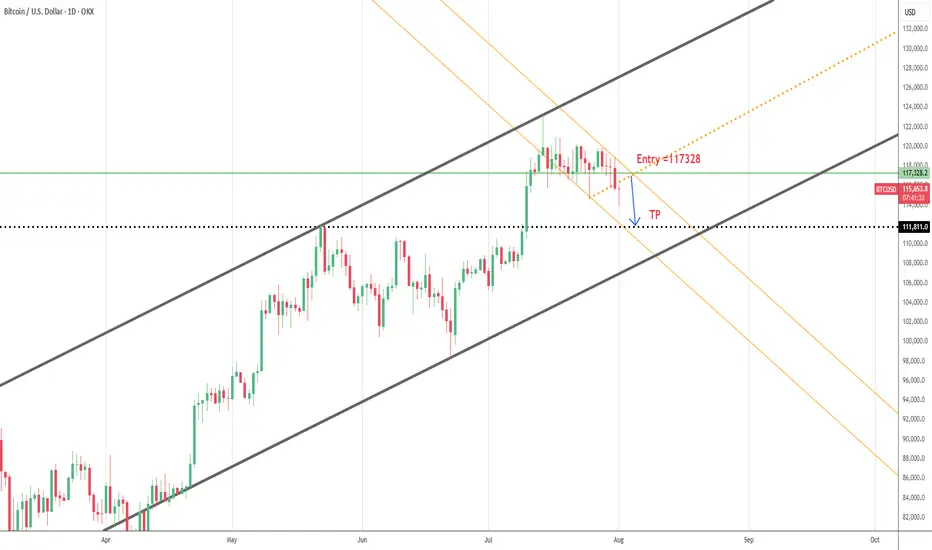
BTCUSD--SHORT---short term SELL possibility
--entry is around green horizantal line
--TP is around black dotted line which is monthly support
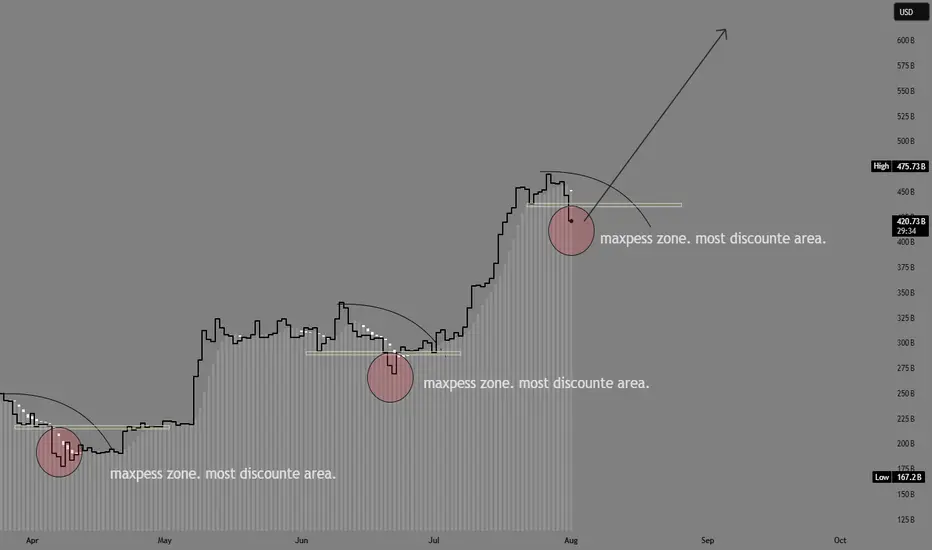
ETH accumulation season 3 has begun at 3.4k. Start loading up!!!ETH has seen impressive price growth for the past few weeks from our original spot at 2.4k -- and it run as high as 3.9k -- almost at our target of 4k.
Now, as with any parabolic moves, eth has to hibernate a bit for that well deserved recharge. This healthy correction at current levels is warranted. 23.6%, 38.2% FIB taps are usually ETHs favorite zone area. This is where most buyers converge as far the most bargain area to position. And we are now at that elusive zone.
A seed from this area is ideal. From our current diagram, you can see we are now on season no.3. This has been doin the same behavior since 160B mcap, and for this next phase, ETH is eyeing 600B mcap from here.
This is in line with our original forecast.
We are now on Month no. 3 as we entered August, my predicted cycle duration would be 17 bullish months till December 2026.
-----------
STONG BUY HOLD at this area. We got a rare elusive season of accumulation that doesnt come very often.
Happy profiting everyone
See you up there.
Spotted at 3.4k
Mid target 5k.
Long term target. 10k.
TAYOR.
Trade safely.
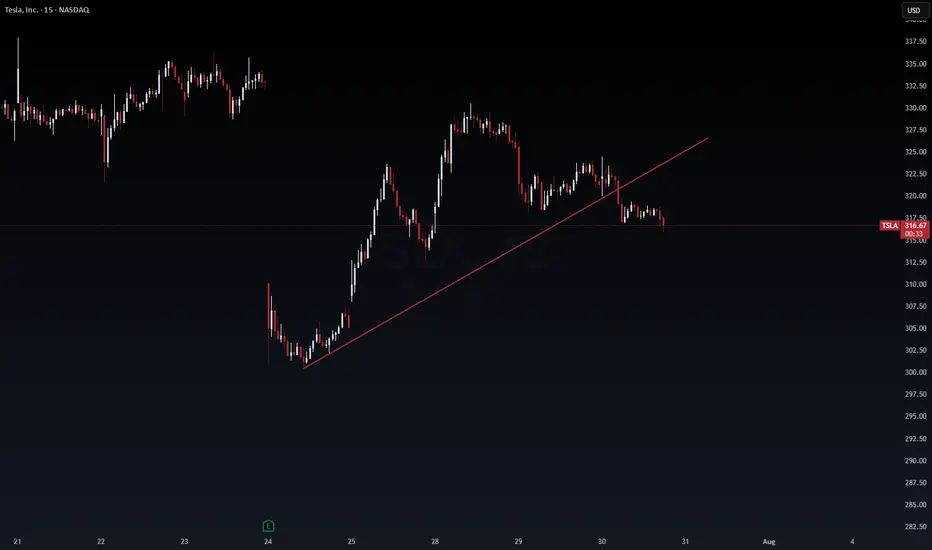
TSLA: Watching for short. I think there might be sell off, looking at the chart. I could be wrong so ll observe for now. I will go in if the momentum towards downward accelerate.
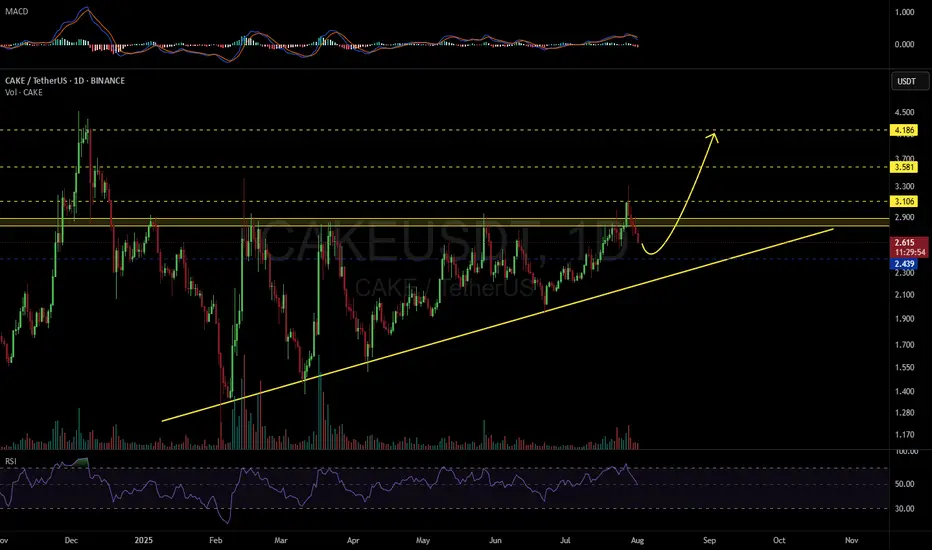
CAKEUSDT 1D#CAKE broke above the ascending triangle resistance, but due to Bitcoin's drop, it pulled back inside the triangle.
📌 If you're looking to enter, consider placing a buy order near the support level at $2.439.
In case of a bounce and a breakout above the triangle resistance, the upside targets are:
🎯 $3.106
🎯 $3.581
🎯 $4.186
⚠️ As always, use a tight stop-loss and apply proper risk management.

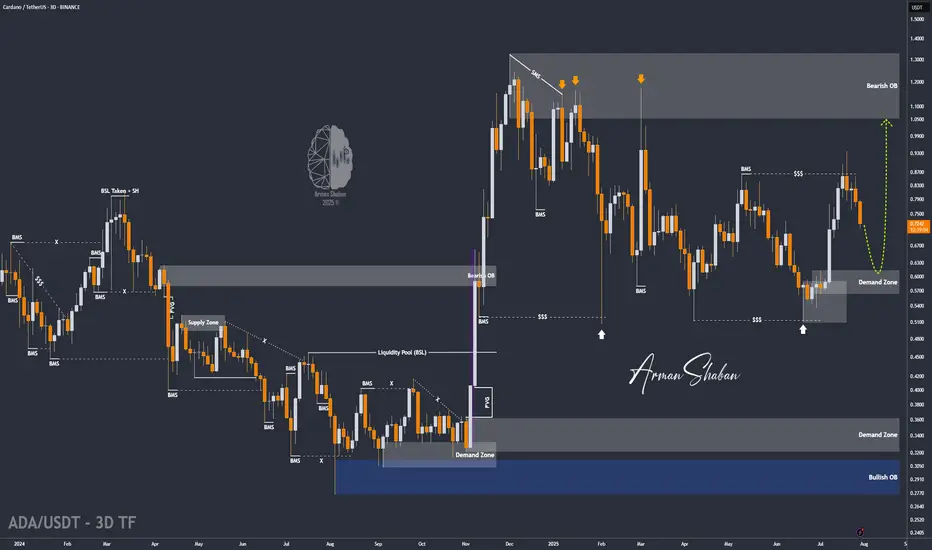
ADA/USDT | ADA Slips Below Support – Watching $0.61 for Support!By analyzing the Cardano chart on the 3-day timeframe, we can see that the price failed to hold above the $0.75 support and is currently trading around $0.72. Given the current momentum, a deeper correction for ADA seems likely. If the price fails to stabilize above $0.69, we could see a sharp drop toward the $0.61 zone. If ADA reaches this key support area, keep a close eye on it — a strong bullish reaction could lead to the next big upside move!
Please support me with your likes and comments to motivate me to share more analysis with you and share your opinion about the possible trend of this chart with me !
Best Regards , Arman Shaban
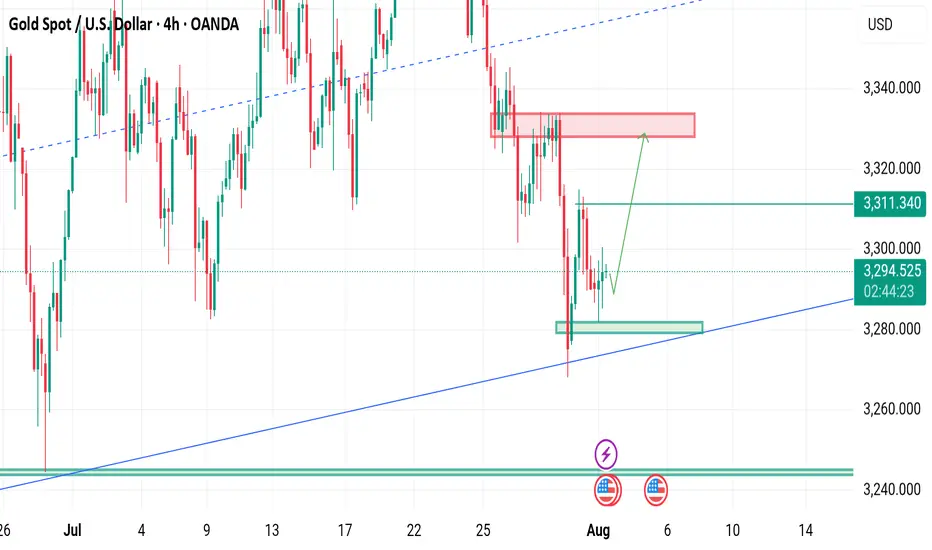
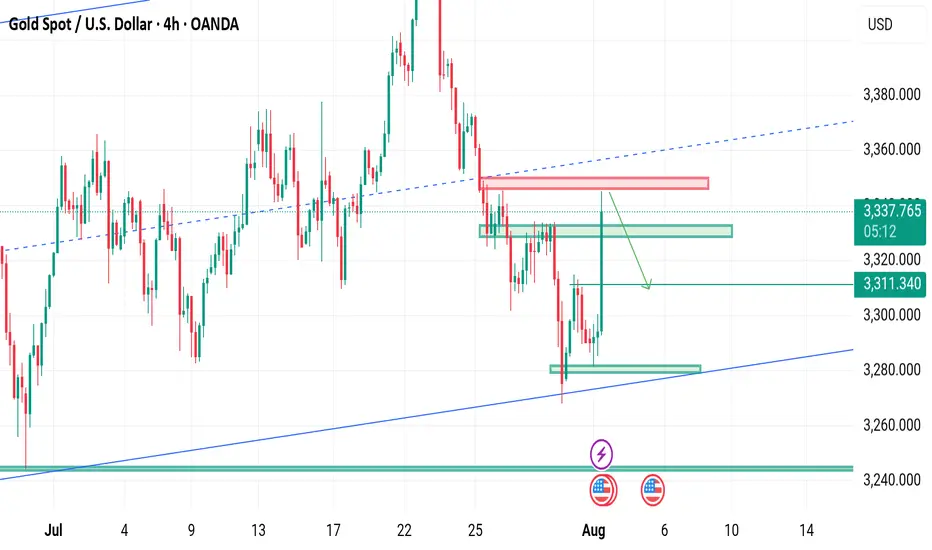
NFP ON DECK TODAY Gold is currently holding the Range of 3275-3310.
What's possible scanarios we have?
we have NFP data on deck today, expect potential volatility.
Until the release, gold may continue to range between 3275 and 3315.
This trade is totally unexpected how can gold react on numbers.
•If the H4 & D1 chart breaks below 3270, we could see a further drop toward the 3250 zone.
• Ifthe H4 & D1 chart flips above 3310, we could see a further Upside climb the 3335 -3345 zone.
Stay alert. Key levels in play.
#XAUUSD

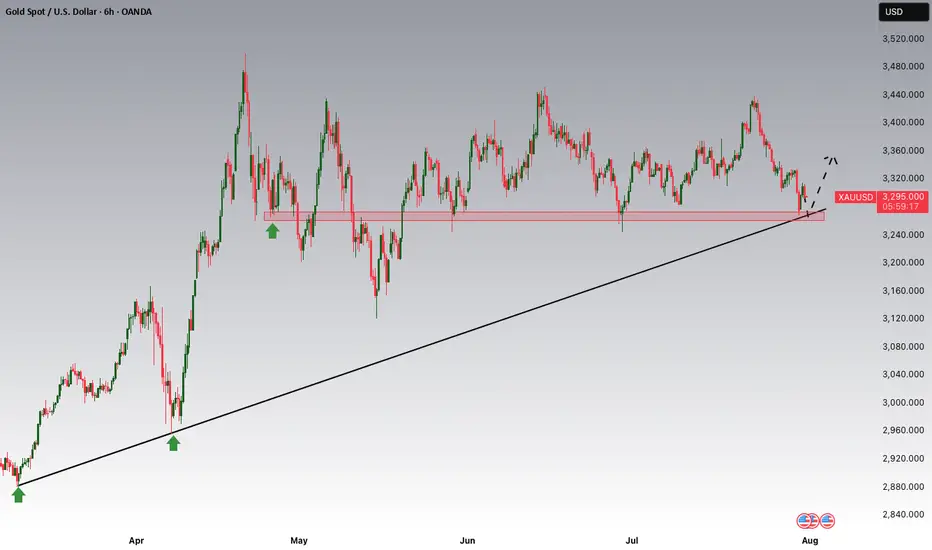
Gold Potential UpsidesHey Traders, in today's trading session we are monitoring XAUUSD for a buying opportunity around 3,270 zone, Gold is trading in an uptrend and currently is in a correction phase in which it is approaching the trend at 3,270 support and resistance area.
Trade safe, Joe.
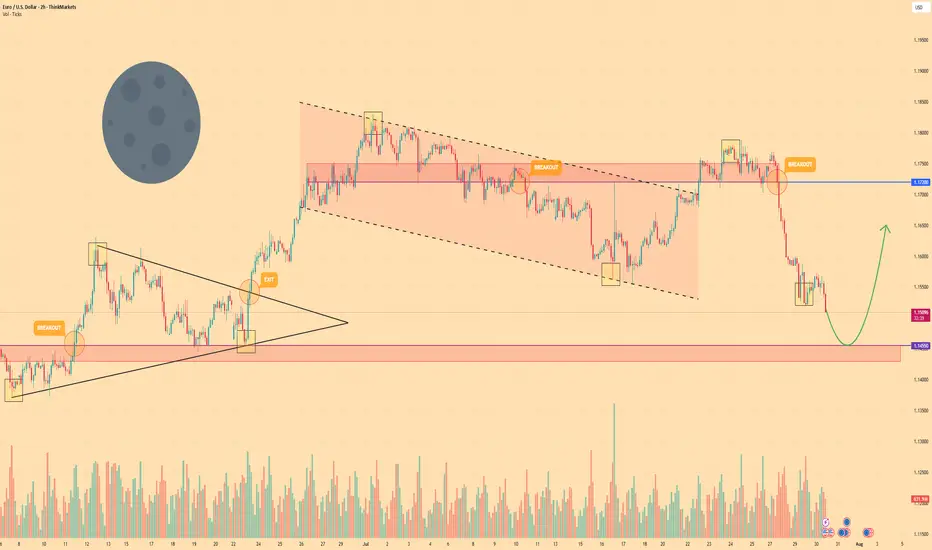
EURO - Price can turn around of support level and rise to $1.165Hi guys, this is my overview for EURUSD, feel free to check it and write your feedback in comments👊
The market structure shifted after a breakout from a prior triangle pattern pushed the price higher.
This rally met resistance, and a new bearish trend emerged, creating a distinct falling channel.
The asset made several rotations inside this channel, with the most recent upswing failing at the $1.1720 resistance zone.
That failure to break higher initiated the current strong bearish impulse driving the price down.
Euro is now approaching a critical area of demand, the horizontal support zone near $1.1455.
I expect that buyers will defend the $1.1455 support level, causing a reversal that will carry the price towards the $1.1650 target.
If this post is useful to you, you can support me with like/boost and advice in comments❤️
Disclaimer: As part of ThinkMarkets’ Influencer Program, I am sponsored to share and publish their charts in my analysis.
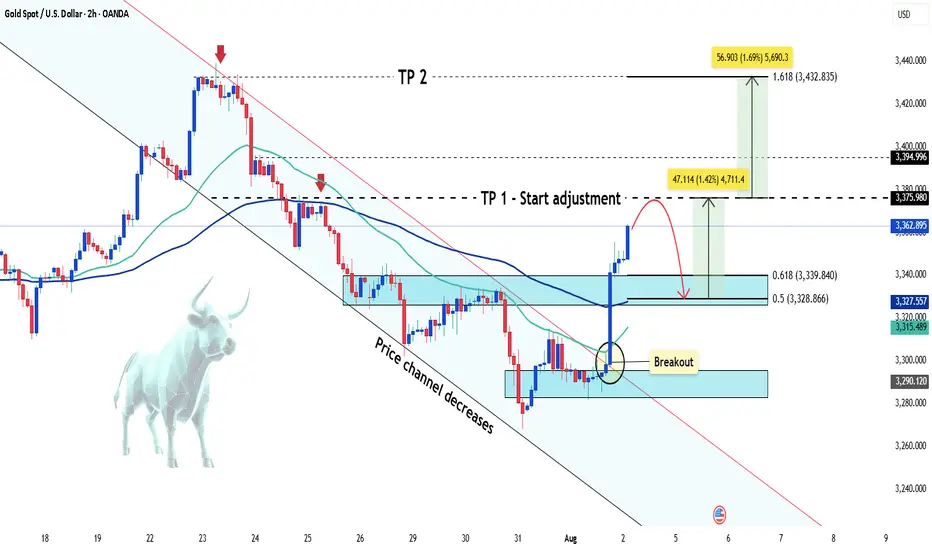
Gold suddenly increased sharply Hey everyone, let’s dive into what’s happening with XAUUSD!
Gold is experiencing a remarkable rally this weekend, skyrocketing from the $3,285 zone to around $3,362 — gaining over 700 pips. This sharp move comes amid weakening U.S. labor market data, which has fueled speculation that the Federal Reserve may begin cutting interest rates as early as September.
According to the U.S. Bureau of Labor Statistics (August 1st), non-farm payrolls rose by just 73,000 jobs in July — well below economists’ expectations of 106,000. The disappointing figures have shaken confidence in the U.S. economy and placed pressure on the U.S. dollar, as markets increasingly anticipate a dovish shift from the Fed.
For gold, this weak jobs report reinforces its role as a safe-haven asset, driving strong demand as investors seek protection from economic uncertainty. At the same time, lingering fears around global trade tensions and new tariffs imposed by President Donald Trump continue to support the flight to safety.
From a technical perspective, gold has broken out of its descending price channel and is moving fast. According to Dow Theory, a short-term correction may occur soon, but if price holds above key support levels, the rally could extend toward the $3,432 region — the 1.618 Fibonacci extension zone.
This move might mark the beginning of a new bullish phase after weeks of consolidation.
What do you think — is gold just getting started?
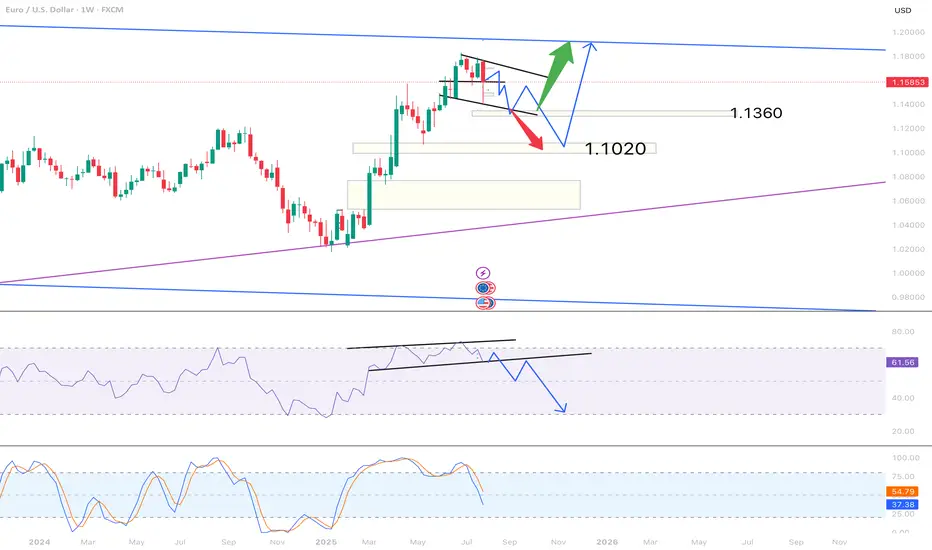
SHORT EURUSD Possible scenarioWeekly chart of EURUSD show potential short coming next coming weeks . MOMENTUM IS UP but the price is declining ,
Two possiblities AT the moment that can play IF ( BIG IF) the price decide to down in the coming days ,
Green arrow show a bounce from 1.1360 area and red arrow show a possiblity for further down to 1.1090.
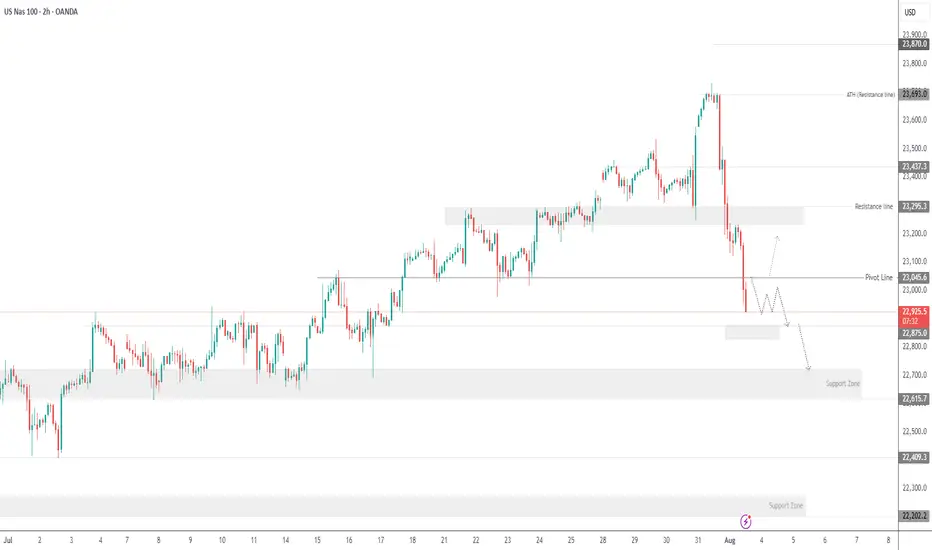
USNAS100 - Tech Weakness & Tariffs Drag NASDAQ LowerTariff Day Pressure Builds as Amazon Miss Weighs on Markets
Markets were hit by a wave of risk-off sentiment on Friday as renewed tariff headlines, weakness in pharma stocks, and a disappointing earnings report from Amazon clouded investor confidence. All this comes just ahead of the U.S. jobs report, which is expected to challenge the market's already diminished expectations for Fed rate cuts.
While macro markets appeared resilient earlier in the week, Wall Street futures and global equities turned cautious as sentiment deteriorated.
NASDAQ – Technical Outlook
The NASDAQ has dropped nearly 850 points from its recent all-time high of 23690, as anticipated in previous updates. The index remains under bearish pressure.
For today, the market is expected to remain sensitive due to recent macro and earnings-driven volatility.
If the price breaks below 22875, the decline is likely to extend toward 22710, with a deeper support zone at 22615.
To shift back to a bullish bias, the index must break and close above 23045 on the 1H chart.
Support Levels: 22875 • 22710 • 22615
Resistance Levels: 23140 • 23240 • 23320
Bias: Bearish while below 23045
Bullish confirmation: 1H close above 23045
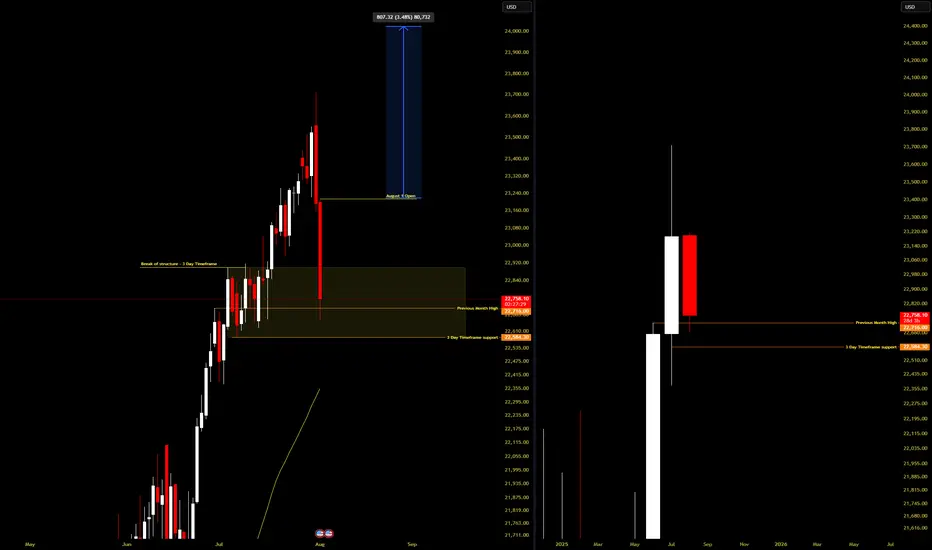
SWING TRADE NASDAQIs this another case of Trump moving the markets so his buddies can get better entries? 👀
Not saying anything... but July candles were way too friendly in that yellow box. Institutions were loading up like it was Black Friday.
I jumped in too—snagged a clean 10RR 😎📈
Now, with seasonality (August 3.5% average past 10 years) + Commitment of traders data backing me up( July COT is heavy longs), I’m risking light for a tiny 27RR setup.
Will it work? No clue.
Will I be dramatic about it? Absolutely. 🎭📉📈
Selling activated ▪️I'm expecting selling at 3345-3348 from my zones although I took a small risk of sell at 3342
And my Targets will be 3333-3324
▪️Secondly if H4 candle closing below 3250 I will not sell till next stability
This trade is based on liquidity sweeps
#XAUUSD
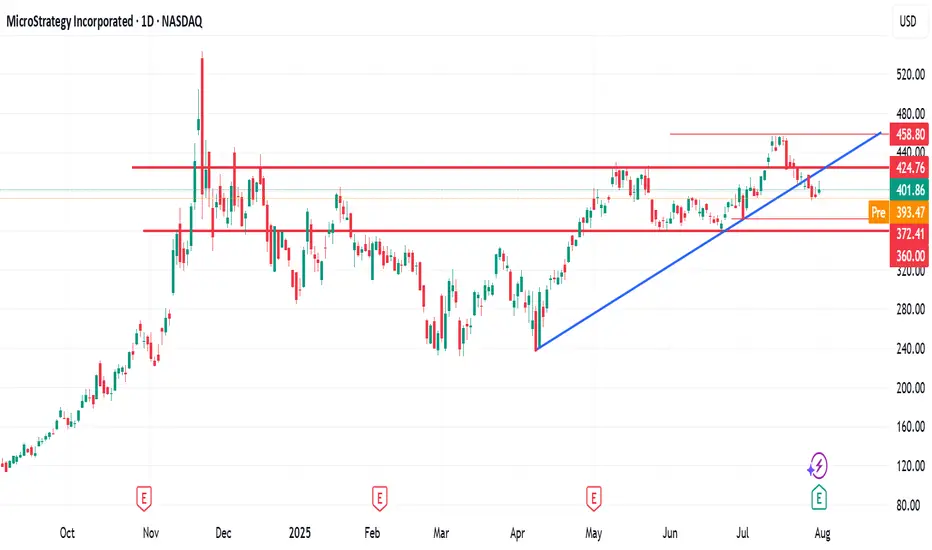
$372 - $360 is imminent$372 - $360 is imminent.
Following a break below the highlighted key support TL, MSTR fall to as low as $370 to $360
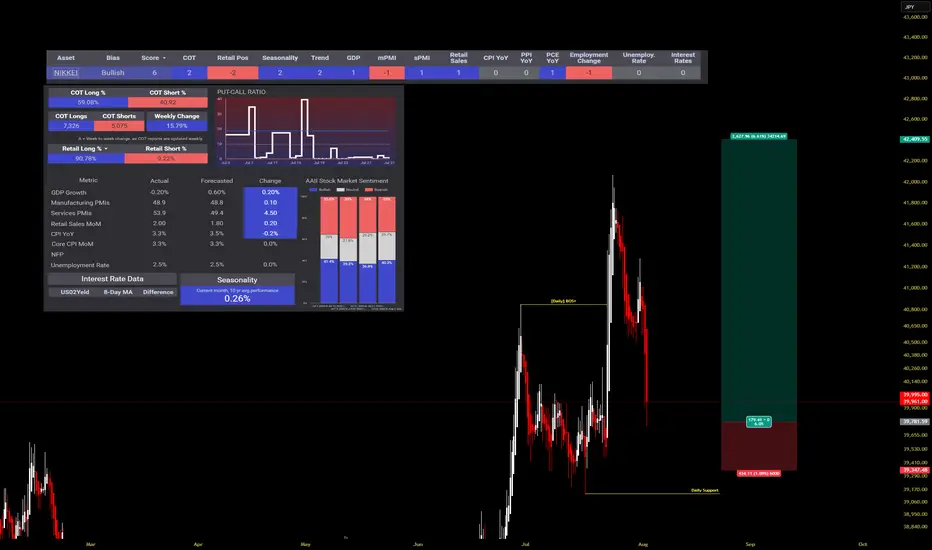
NIKKEI: Strong Bullish Momentum Driven by Favorable IndicatorsData analysis indicates a "Bullish" bias for the NIKKEI, with a strong overall score. This positive outlook is supported by a confluence of factors, including Commitments of Traders (COT) data, retail positioning, seasonality, and trend. While some economic data points show neutrality or slight negativity, the overriding sentiment and key technical factors suggest a continued upward trajectory for the NIKKEI.
Key Supporting Factors (Bullish):
Strong Technicals/Momentum: The "Trend" and "Seasonality" scores of 2 each suggest strong underlying bullish momentum and favorable seasonal patterns for the NIKKEI.
COT & Retail Positioning: Positive scores in "COT" and "Retail Pos" (both 2) often indicate that institutional money and retail traders are aligned in a bullish direction, providing a strong foundation for upward movement.
GDP, SPMI, Retail Sales: These economic indicators, with scores of 1, are contributing positively to the overall bullish bias, indicating healthy economic activity.
DXY LONGi am looking to go long on DXY from this level of breaker block.. a possible pullback to this level we will engage on the buy and use itr as cross reference for our dollar pairs ..

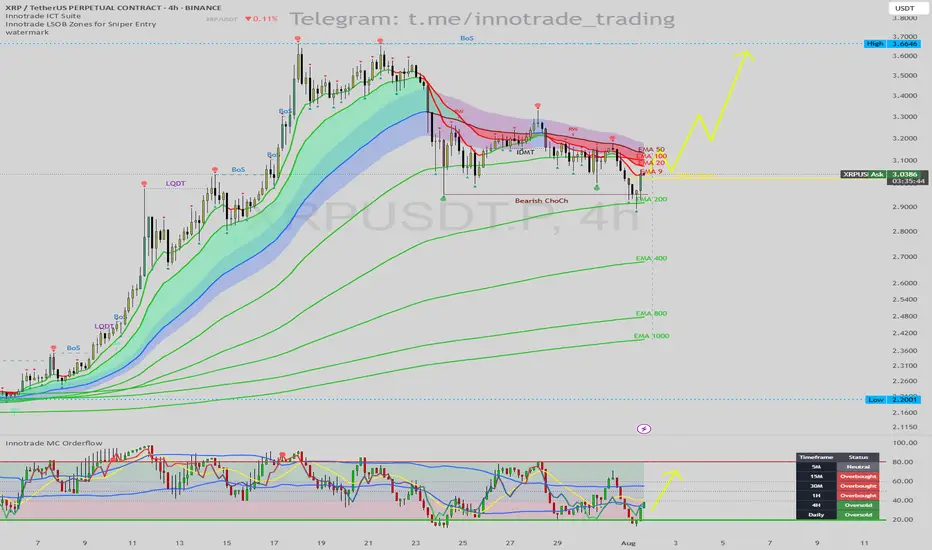
XRP/USDT: Bullish Reversal Setup at EMA 200 & Daily OversoldHello traders,
I'm seeing a compelling long setup forming on the XRP/USDT 4H chart. While the immediate trend has been bearish, multiple key indicators are now signaling that a significant bounce or reversal is highly probable.
1. Trend & Context (The "Why")
After a strong uptrend, the price has experienced a pullback, confirmed by a Bearish Change of Character (ChoCh). However, the price has now reached a critical support level where we can look for long opportunities.
Key Price Action Support: The price is currently finding support directly on the EMA 200. This is a major long-term moving average that frequently acts as a strong floor for price during a pullback.
Momentum Exhaustion Signal: The Innotrade MC Orderflow oscillator is giving a powerful confirmation for a potential bottom:
The oscillator is deep in the OVERSOLD zone (below 20), indicating that selling pressure is exhausted.
CRITICAL MTF CONFLUENCE: The Multi-Timeframe Cycle Table is the key to this trade. It shows that both the 4H and Daily timeframes are "Oversold". When higher timeframes like the Daily show exhaustion, it significantly increases the probability of a strong reversal on lower timeframes.
2. Entry, Stop Loss, and Targets (The "How")
This setup provides a clear, high-probability trade plan with a good risk-to-reward ratio.
Entry: An entry around the current price ($3.03 - $3.05) is viable as we are at the EMA 200 support. For a more conservative entry, wait for the MC Orderflow oscillator to cross back above its yellow MA.
Stop Loss (SL): $2.89. This places the stop loss safely below the recent swing low and the EMA 200. A break below this level would invalidate the bullish thesis.
Take Profit (TP) Targets:
TP1: $3.25 (Targeting the cluster of short-term EMAs and the recent swing highs).
TP2: $3.40 (The next logical area of resistance from the previous price structure).
TP3: $3.66 (The major swing high, a longer-term target if the bullish trend resumes).
Conclusion
This trade idea presents a strong case for a long position. The combination of a major technical support level (EMA 200) with a confirmed multi-timeframe momentum exhaustion signal (Daily Oversold) creates a high-probability environment for a bullish reversal.
Disclaimer: This is not financial advice. This analysis is for educational purposes only. Always conduct your own research and manage your risk appropriately.
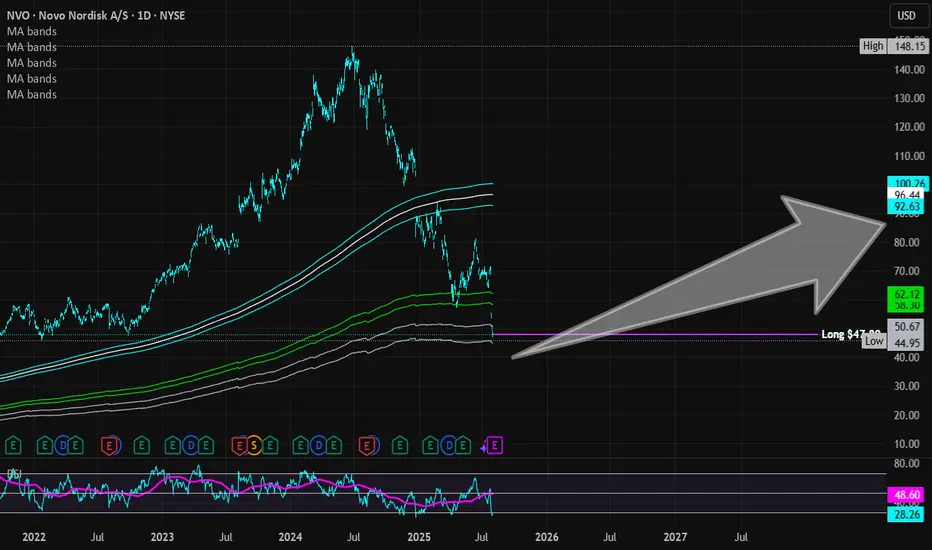
Novo Nordisk (Revised) | NVO | Long at $47.78**This is a revised analysis from February 5, 2025: I am still in that position, but added significantly more below $50**
Novo Nordisk NYSE:NVO is now trading at valuations before its release of Wegovy and Ozempic... From a technical analysis perspective, it's within my "major crash" simple moving average zone (gray lines). When a company's stock price enters this region (especially large and healthy companies) I always grab shares - either for a temporary future bounce or a long-term hold. While currently trading near $47 a share, I think worst case scenario here in 2025 is near $38-$39. Tariffs may cause a recession in the second half of 2025, so no company would be immune.
As mentioned above, I am still a holder at $86.74. However, I went in much heavier within my "major crash" simple moving average band and have a final entry planned near $38-$38 (if it drops there). My current cost average is near $55.00.
Why do I still have faith in NYSE:NVO ? Because no one else does right now, yet it generated $42 billion in revenue, $14 billion in profits, and has significant cash flow YoY. The company has a massive pipeline, despite Wegovy and Ozempic competition, and I think the market is undervaluing its position in the pharmaceutical industry.
Revised Targets in 2028:
$60.00 (+25.6%)
$70.00 (+46.5%)
$80.00 (+67.4%)