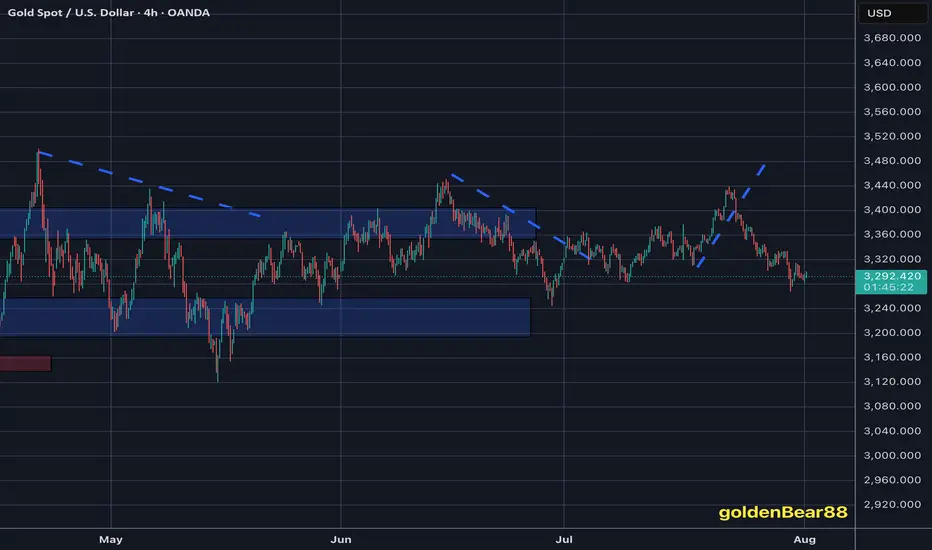
I maintain my #3,277.80 and #3,252.80 TargetsI didn't engaged any re-Sell orders throughout yesterday's session and re-Sold Gold on #3,295.80 ahead of Asian session, with plan to keep orders over-night. However due NFP, Gold might be stationary / ranging until the news as I closed both of my orders on #3,291.80 / each #9.000 Eur Profit and my #3,300.80 pending Sell limit has been triggered over-night which is now running in Profits with Stop on breakeven. I do expect #3,277.80 and #3,252.80 Targets to be met within #1 - #3 sessions and if there aren't NFP numbers, I would keep all three orders / set of Selling orders maintaining my first #3,277.80 Target. Due the news, Gold might fluctuate within Neutral Rectangle until the news.
Technical analysis: My earlier Selling configuration / Technical expectations was confirmed on Hourly 4 chart under prolonged weakness and Price-action respecting the trend-line guarding the downtrend (very Bearish formation) as Hourly 1 chart is already an aggressive Descending Channel (width opened on Williams) that should reach it’s next local Low’s (currently Trading slightly below Double Bottom) and Oversold state near my take Profit of #3,252.80 benchmark. If the bands are widened Traders may witness #3,277.80 test, also if gets invalidated and #3,270.80 gives away, #3,252.80 mark extension test is inevitable. In any case I will update my Targets or levels of Profit taking if I decide to exit earlier than #3,252.80 benchmark to be in accordance with the Daily chart’s period / I already ride Selling wave since #,3,300's and my Profit will be already good to ignore.
My position: DX is soaring, Gold is under Bearish Technical developments and #3,252.80 benchmark is my final Target of current Selling leg. Only factor which can reverse this Intra-day but not postpone is NFP. I expect downside Jobs surprise which may reverse DX from local High's however hot upside surprise will make Gold test #3,252.80 Intra-day. NFP or not I do believe Gold is Bearish. Trade accordingly.
Community ideas
Gold non-farm payrolls are bullish, long and short positions ana
Rather than envying the fish by the river, it's better to retreat and weave your net. We often envy the wealth others can earn by investing in the gold market. We often watch them enthusiastically investing, but we ourselves are afraid to enter the market. The two major factors that drive the market, technology and news, are a topic of constant debate among investors. To navigate the market, one must master the art of attack and defense to remain rock-solid while remaining at the forefront. As the saying goes, trust me, and I will reward you with profits!
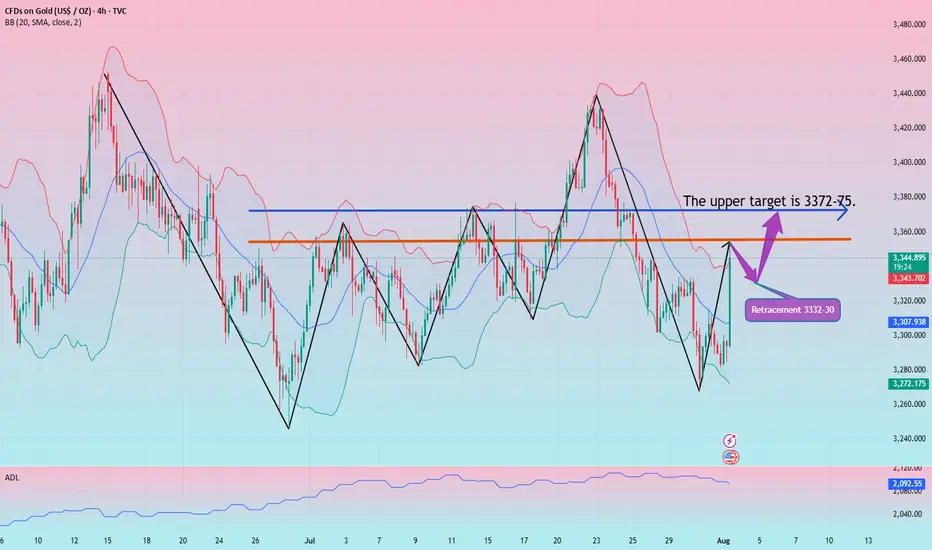
Gold Data is Bullish!
The positive non-farm payroll data sent gold soaring, with gains completely erasing all of the week's losses. Currently, gold's trend has reversed the stagnant bullish and bearish trend. After breaking through the 3300 mark and rising all the way to 3348, it shows no signs of stopping. A further test of the 3370 level is not out of the question!
Due to the strong bullish data, if you don't immediately chase longs or place a breakout long order during the first wave, you'll likely have little chance of a pullback. Therefore, you should remain aggressive in your trading strategies. We recommend a pullback to the 3332-30 level to continue the bullish trend. Upward pressure is expected at 3372-75! The market fluctuates violently, and more real-time entry and exit points are mainly based on Yulia's real-time guidance!
Pudgy Penguins (PENGU): Huge Volatile Movement IncomingPengu coin seems to be in a pretty dangerous zone; while we are hovering near the ATH and seeing some smaller pullback prices, we are yet to see the potential huge breakout take place or breakdown happen.
We have marked 2 zones to keep an eye on; if either of those zones is broken, a huge volatile movement will happen so be careful!
As long as we are above the Sell Zone, we are going to look for more MSB areas for smaller long scalps!
Swallow Academy

Gold long from 3295I think this might be the bottom .
Next week gold will be sitting at 3400$ level.
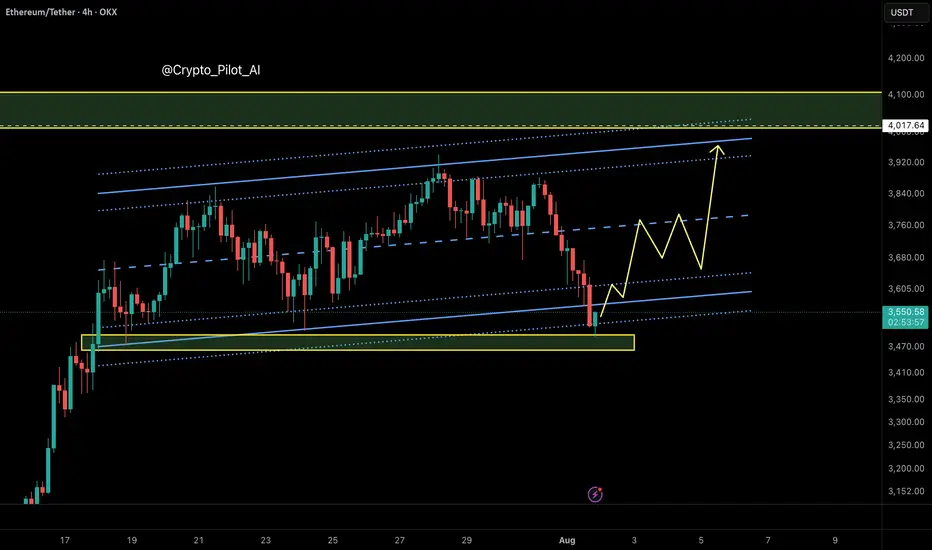
Ethereum: Smart Money Reversal After Stop Hunt?In the previous update, we warned that Ethereum might drop lower before any meaningful bounce — especially if it failed to hold the midline of the ascending channel. That scenario played out exactly as anticipated.
🟡 Price action summary:
ETH broke below the midline of the weak ascending channel, hunted the liquidity below recent lows, and tapped into the key bullish order block near $3,490 – $3,520. Price is now reacting to this zone with early signs of a reversal.
📌 Key observation:
Midlines of weak or low-momentum channels often act as liquidity traps in smart money models. Buying at these levels can be extremely risky — especially during corrective or distribution phases.
⸻
📚 Educational Note:
Never enter long positions solely at the midline of a weak ascending channel, especially when there’s a high probability of liquidity sweep below. Smart entries usually occur at order blocks formed after stop hunts.
⸻
🎯 Next steps:
Wait for confirmation (such as internal BOS or FVG closure) before entering longs. The structure suggests a potential move back toward the upper boundary of the channel if this OB holds.
⸻
🔗 Save this analysis and share it with fellow traders.
💬 Thoughts? Drop your view in the comments.
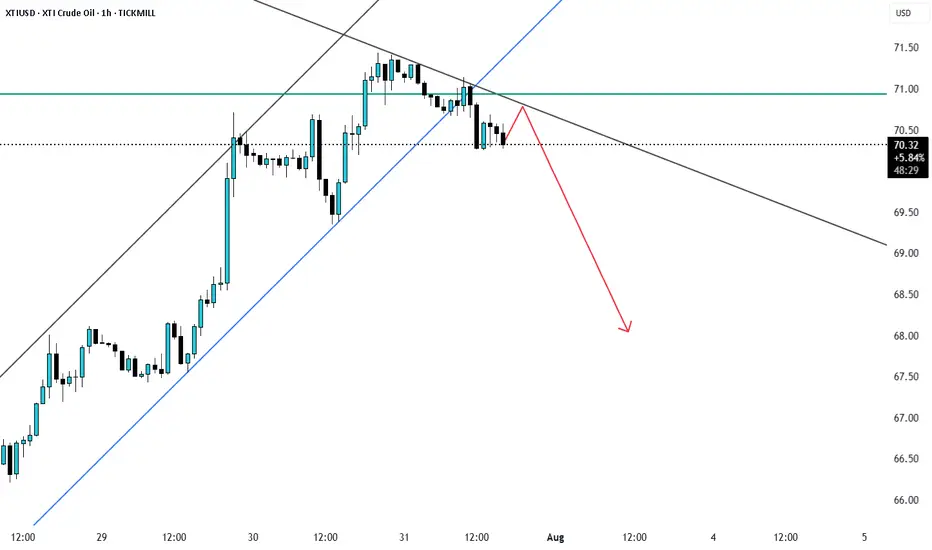
XTIUSD rejection from fib 0.5 XTIUSd recently pulled back to fib0.5 level and is currently looks to be reversering as support trendline broke and price may reject from here.
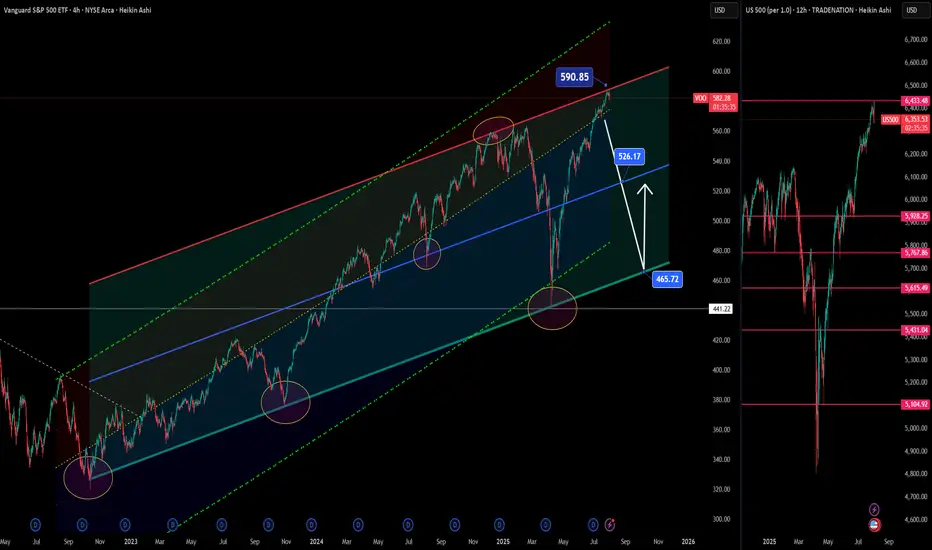
S&P 500 ETF & Index– Technicals Hint at a Possible Correction📉📊 S&P 500 ETF & Index at Resistance – Technicals Hint at a Possible Correction 🔍⚠️
Everything here is pure technicals— but sometimes, the market whispers loud and clear if you know how to listen. 🧠📐
The VOO ETF, which tracks the S&P 500 , has now reached the upper boundary of a long-term ascending channel, once again brushing against resistance near 590.85. This zone has consistently led to major pullbacks in the past.
On the right panel, the US500 Index mirrors this move—pushing toward all-time highs, right as broader sentiment turns euphoric. Technically, both charts are overextended and pressing into key zones.
👀 Potential Path:
🔻 Rejection from current zone ➝ Down toward 526.17, then 465.72 (green support channel)
🔁 Possible bounce after correction — trend still intact long term
And while we’re keeping it technical, it’s worth noting that the Buffett Indicator (Stocks-to-GDP) i s currently screaming “overvaluation.” This doesn't predict timing—but it adds macro context to an already overheated chart setup.
The lesson? Price respects structure. Whether or not the fundamentals are in agreement, the charts are warning that now may not be the time to chase.
History doesn’t repeat, but it often rhymes. Stay sharp, stay technical. 🎯
One Love,
The FX PROFESSOR 💙
ps. the beauty of these levels? Tight Stop loss- excellent R/R
Disclosure: I am happy to be part of the Trade Nation's Influencer program and receive a monthly fee for using their TradingView charts in my analysis. Awesome broker, where the trader really comes first! 🌟🤝📈
GBPUSD: Bearish Momentum vs. Fundamental Repricing – Key LevelsGBPUSD is at a critical juncture, balancing a clear technical breakdown with a fundamental backdrop favoring near-term volatility. The pair has slipped from its rising wedge structure and is now testing key retracement zones while markets reprice expectations for Fed rate cuts after weak US jobs data. Traders are closely watching whether this bearish momentum will extend toward the 1.3128 support or if a rebound from oversold conditions could trigger a corrective bounce.
Technical Analysis (8H Chart)
Pattern: Clear breakdown from a rising wedge, confirming bearish bias.
Current Level: Price sits near 1.3278, struggling to reclaim the 1.3300 resistance zone.
Key Support Zones:
1.3128 (61.8% Fibonacci retracement) – main bearish target.
1.2945 (78.6% retracement) – extended downside target if selling pressure deepens.
Resistance Levels:
1.3300 (immediate resistance, prior support now flipped).
1.3380 (secondary resistance if a retracement rally occurs).
Projection: Likely bearish continuation toward 1.3128, with a potential retest of 1.3300 before continuation.
Fundamental Analysis
Bias: Bearish in the short term, but Fed policy and risk sentiment remain key drivers.
Key Fundamentals:
USD: Weak NFP (73K), higher unemployment (4.2%), and downward revisions boost Fed cut bets (~75% for September), typically a USD-negative factor.
GBP: BOE maintains a cautious stance due to sticky inflation but lacks clear hawkish conviction as growth slows.
Tariffs: US tariffs add a mild negative weight on GBP trade sentiment.
Risks:
Hot US CPI could slow Fed cut bets, supporting USD.
Hawkish BOE comments could limit GBP downside.
Global risk sentiment shifts could either favor USD (risk-off) or weaken it further (risk-on).
Key Events:
US CPI and PPI for USD direction.
BOE policy updates and UK CPI.
US jobless claims and Fed commentary.
Leader/Lagger Dynamics
GBP/USD is a lagger, mainly reacting to USD shifts. However, its moves directly influence GBP crosses such as GBP/JPY and GBP/CHF.
Summary: Bias and Watchpoints
GBP/USD remains in a bearish phase, targeting 1.3128 with a potential corrective bounce toward 1.3300 first. The primary driver is the technical breakdown, while fundamentals add volatility around US CPI and BOE policy. If CPI surprises lower, the bearish outlook could reverse into a short-term rebound; if CPI is hot, downside momentum could extend. You should monitor USD-driven events closely as GBP/USD sets the tone for broader GBP movements.

Let's buy BTCUSD on correction!I found interesting opportunity in BTCUSD right now.
It has been moving in consolidation channel after recorded its all time high.
Based on Elliot Wave count, the price right now is making it's wave 4.
The next possible target is 120-125k.
CHEEEERRRSSS..!!!
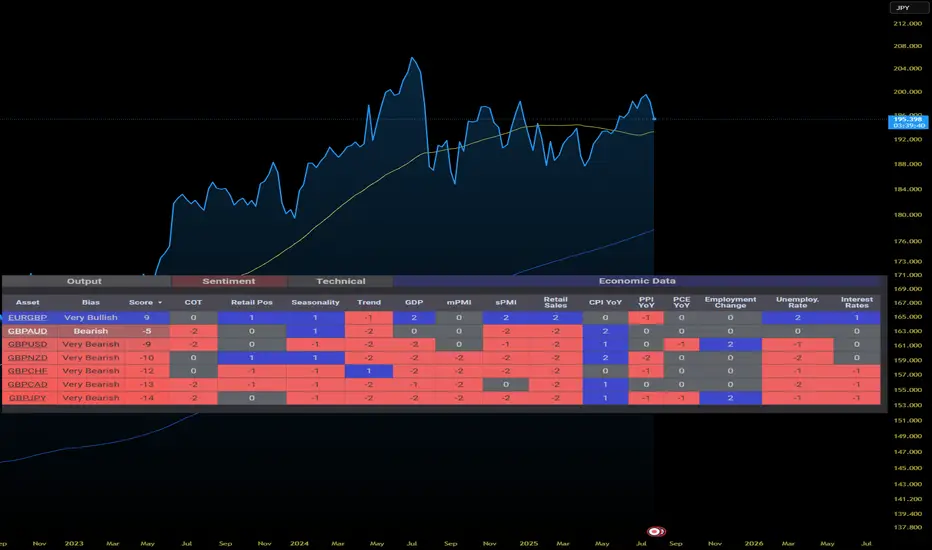
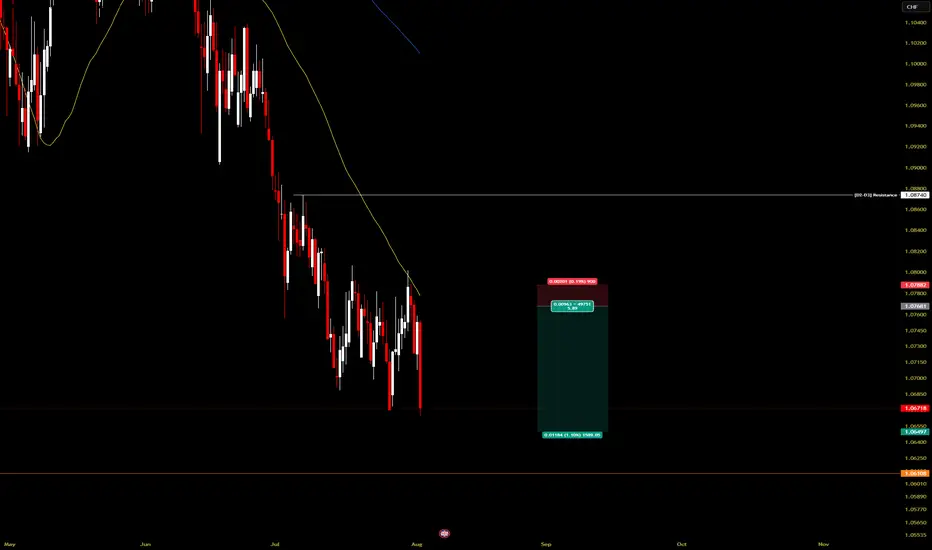
GBPCHF RETAINS BEARISH MOMENTUMInstitutional (COT) data shows a net reduction in GBP exposure, suggesting big money is pulling out of the pound. Retail sentiment also leans heavily against the trend, with traders buying the dip — another contrarian bearish signal. Seasonality does not favor the pair in August either, with historic trends leaning against GBP performance this time of year.
On the macro side, UK economic data continues to weaken. Both manufacturing and services PMI are deteriorating, indicating contraction across sectors.
Retail sales and GDP growth are negative, while inflationary pressure is easing — all of which reduces the urgency for further BOE tightening. Employment metrics are also weak, with poor job creation and falling labor market momentum.
Meanwhile, Switzerland is showing relative macro strength. The SNB is benefiting from stable inflation and its traditional safe-haven appeal, which is further boosted by rising global risk-off sentiment. Interest rate expectations are neutral for CHF but increasingly dovish for the UK, creating clear policy divergence in CHF’s favor.
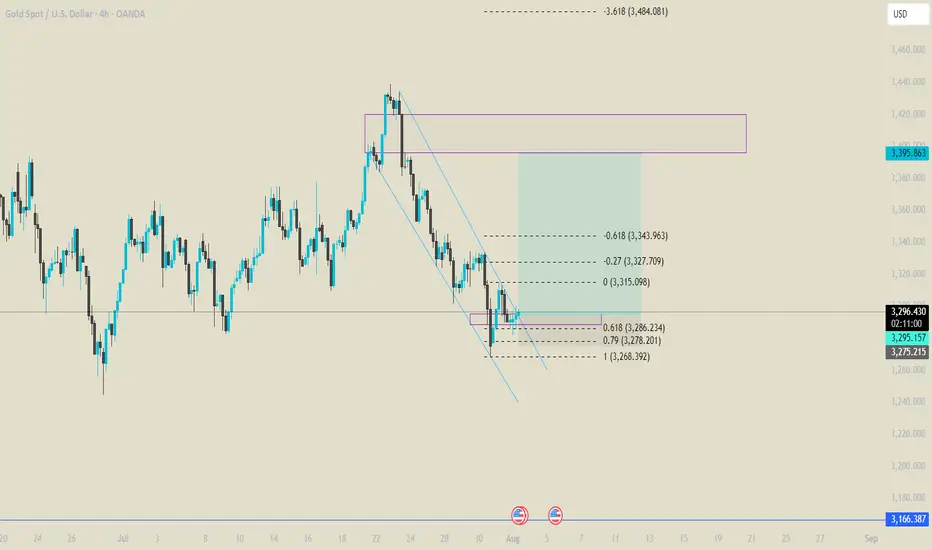
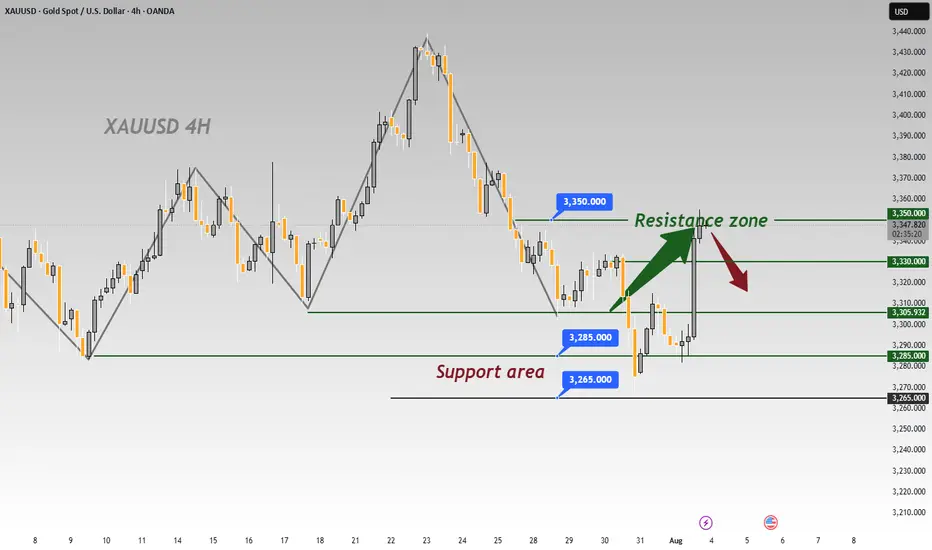
Gold Surges on Non-Farm Data; 3330 Key Next WeekGold was strongly boosted by the significantly bullish non-farm payroll data, surging sharply like a rocket 🚀, with gains that completely "wiped out" all the weekly losses. The current gold trend, as if injected with super momentum, has completely broken the previous long-short stalemate. Starting from the 3300 level, it has been breaking through obstacles all the way up to 3350. At present, 3330 is like a critical "battleground" ⚔️ fiercely contested by both long and short sides.
This week, when gold was still "lingering" below 3300, I emphasized repeatedly that a rebound was inevitable – we just needed to stay calm and wait for the opportunity. As it turns out, our judgment was spot on, and we successfully took profits around 3340, reaping good gains 💴. Now, gold prices are oscillating back and forth in the 3340-3350 range. Based on a comprehensive analysis of the current trend, I boldly predict that gold is likely to pull back to around 3330 next week, so everyone can prepare in advance 🤗
⚡️⚡️⚡️ XAUUSD ⚡️⚡️⚡️
🚀 Sell@ 3350
🚀 TP 3330 - 3320 - 3310
🚀 Buy@ 3300 -3310
🚀 TP 3320 - 3330 - 3340
Daily updates bring you precise trading signals 📊 When you hit a snag in trading, these signals stand as your trustworthy compass 🧭 Don’t hesitate to take a look—sincerely hoping they’ll be a huge help to you 🌟 👇
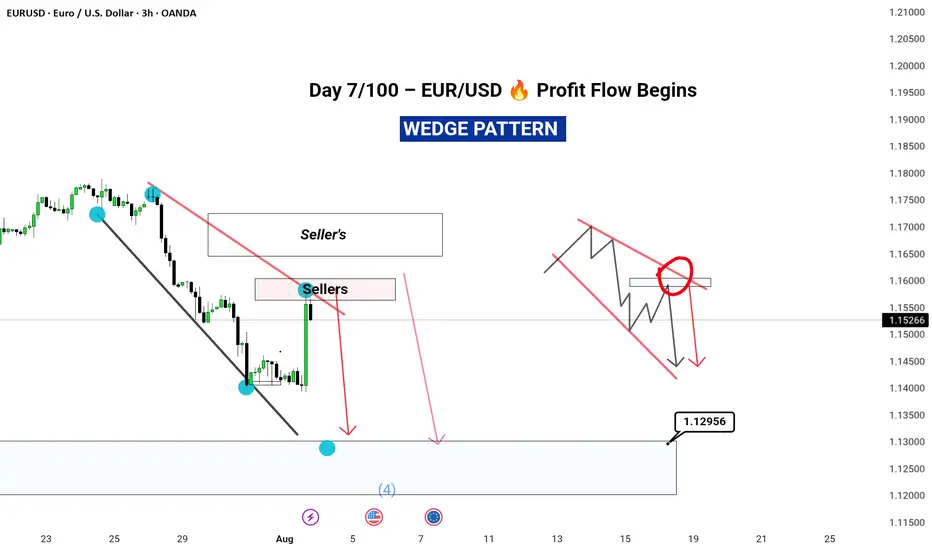
“Exactly What I Saw” promises value and transparency.
In today's analysis, I’ve identified a clear completion of Wave D, securing a 3% ROI across just two trades – all before the move unfolded.
🔍 What’s inside this breakdown?
• Multi-timeframe analysis: Weekly ➝ Daily ➝ 4H ➝ 1H
• Elliott Wave structure with confluence zones
• Trade psychology at key turning points
• Exact entry & exit insights explained
• Risk management for consistent returns
---
⚡ Highlights:
Precise reversal spotted before it was obvious
No indicator clutter – just clean, confident price action
Part of my 100-day breakdown series: real, raw, and repeatable setups
---
👣 Day 7 of 100 is just the beginning.
Tap Follow to stay ahead of the market – one wave at a time.
#EURUSD #ForexAnalysis #ElliottWave #Forex #TradingViewUK #SwingTrading #PriceAction #RiskReward #FXMindset #ForexTradersIndia #ForexEducation
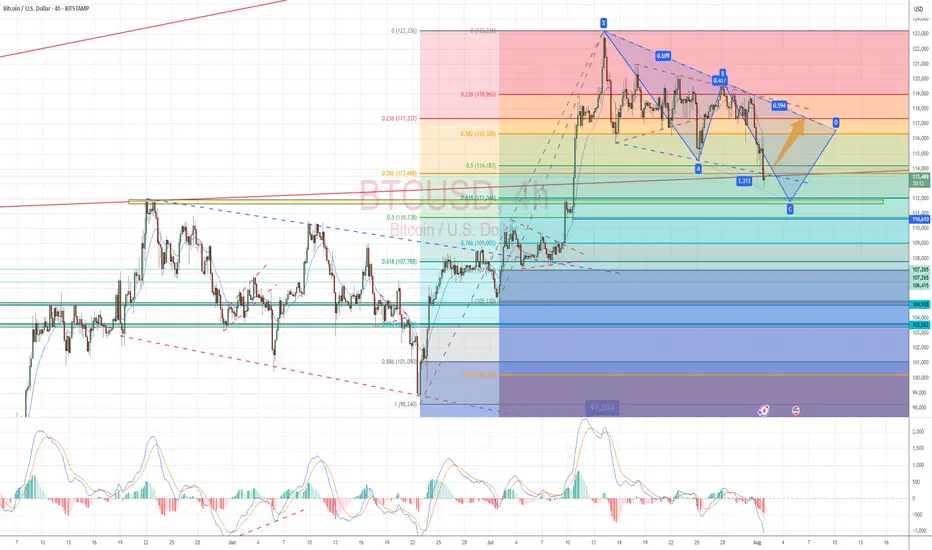
Bitcoin Long: Completion of wave 4 (5-wave instead of 3-wave)In this video, I updated the wave counts for Bitcoin, primarily the change is in wave 4 where I believed that it has formed in 5-waves instead of 3-waves.
Because of the new low, both our stop loss and take profit are now lowered:
SL: $113,858.
TP: $124,000
Good luck!

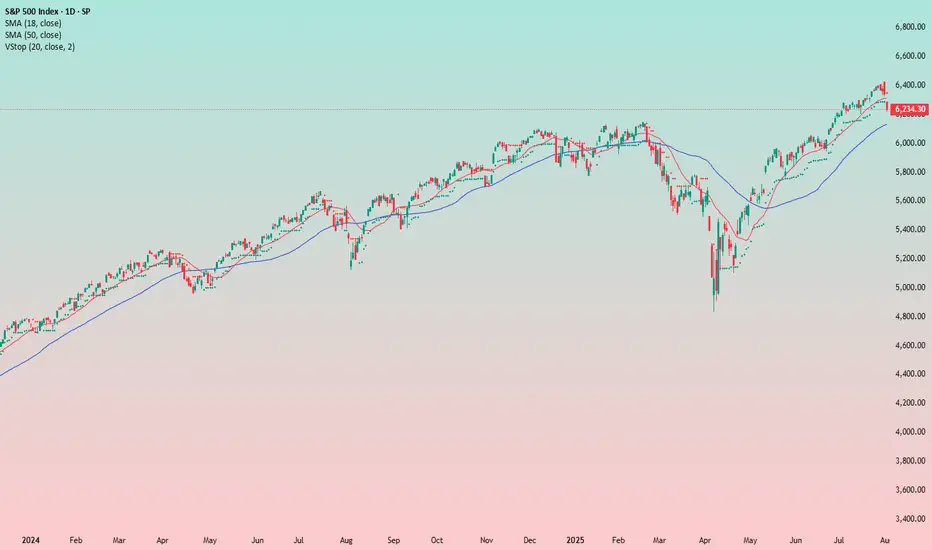
Is This the Start of a Market Drop?So, is the drop beginning? It kind of looks that way, but there’s still no solid setup for entering a short position — and there hasn’t been so far.
The trend is still upward for now, and this current pullback might just be temporary.
What I like about the short idea is that August is traditionally a weak month for stocks .
Could this be the start of a big correction on the market? Yes, it’s possible.
It’s just a pity there’s no clean setup for a short. I’d like to enter, but I’d prefer to see a bit more confirmation on the chart itself.
In general, trading the index off of chart setups isn’t easy — perfect entries are rare. That’s exactly the case now. I’m watching and wondering how and when to catch the downside. Maybe I’ll end up sitting through the entire drop without a position :)
Overall, I’m in favor of the short — but for now, I just don’t see a clear entry point.
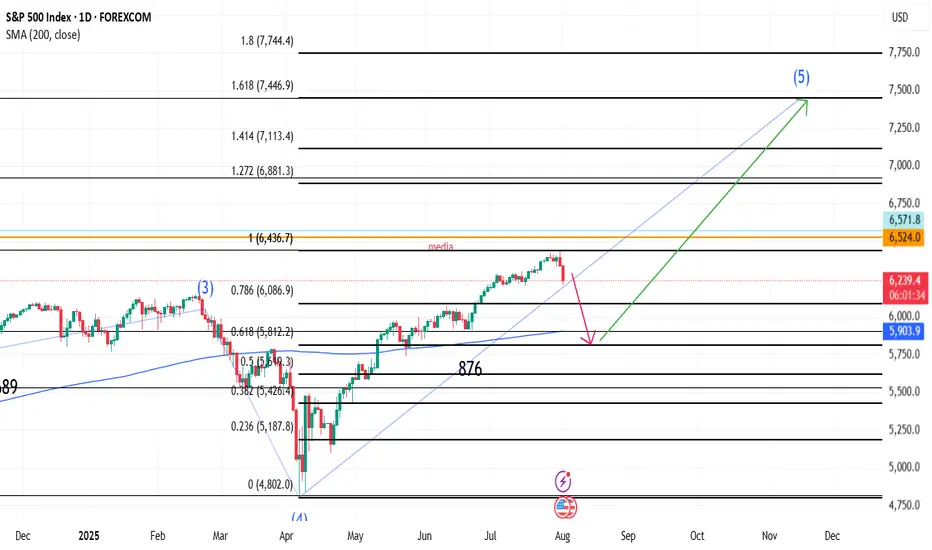
SPX correction to 5800 then 7445In my view current correction could stop in 5800 area where bullish trend could resume to target 7445 area in November
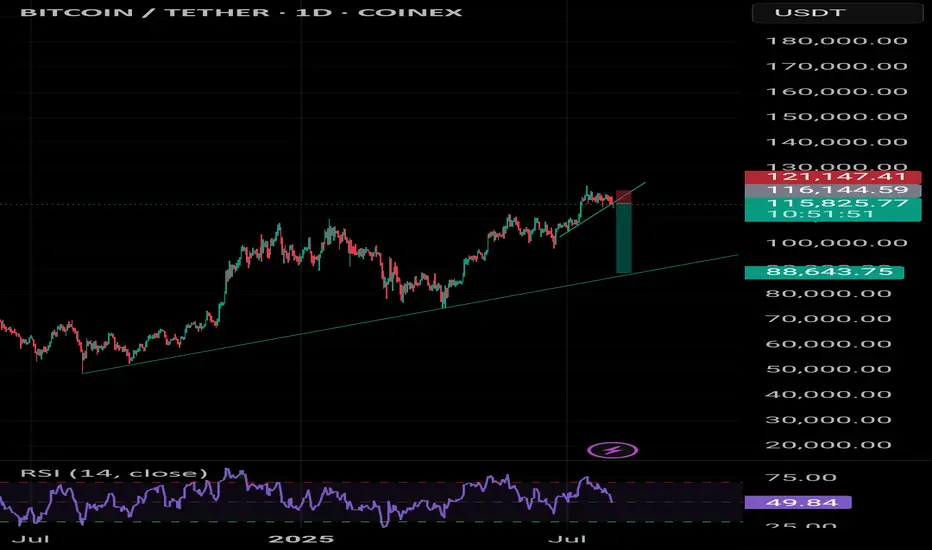
Bitcoin Go 89kBe prepared for a market correction. BIT has a negative divergence on the weekly timeframe.
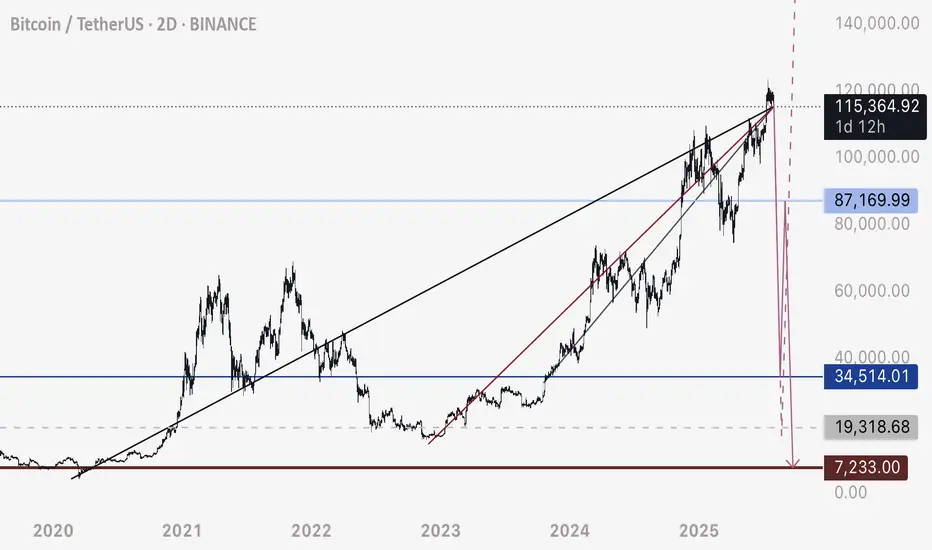
BTC - Not the End of the DropRather the beginning. Bitcoin has fallen below this bearish intersection. Anticipating price to fall rapidly on one of these two pathways to the Uber low liquidity levels.
DXY is retesting a major bearish breakdown - this is the conduit that will justify a flash crash of this magnitude prior to a 3-5 year bull run.
Happy trading.
7/31/25 - $birk - PSA from a $DECK owner...7/31/25 :: VROCKSTAR :: NYSE:BIRK
PSA from a NYSE:DECK owner...
- not as close to this one as NYSE:DECK
- but it's hard enough to own names NYSE:DECK (reported nice beat and good indiation on 2H) and NASDAQ:LULU that reports end of aug with 6+% fcf yields and trading in the mid teens
- i "get" birkenstock is a great brand
- but should it trade high 20s when, honestly, it's not 2x-ish the quality of say "hoka" or "lululemon" brands? tough one
- it's more of a recent IPO too, which means still mkt (generally) has had less time to fully understand it... say over the period of time as it has NYSE:DECK and NASDAQ:LULU nevermind other stuff.
- i'm not suggesting this is a short
- but if i owned it, id probably swap it for one of the two above
- flagging this consideration for anyone before they FAFO
V

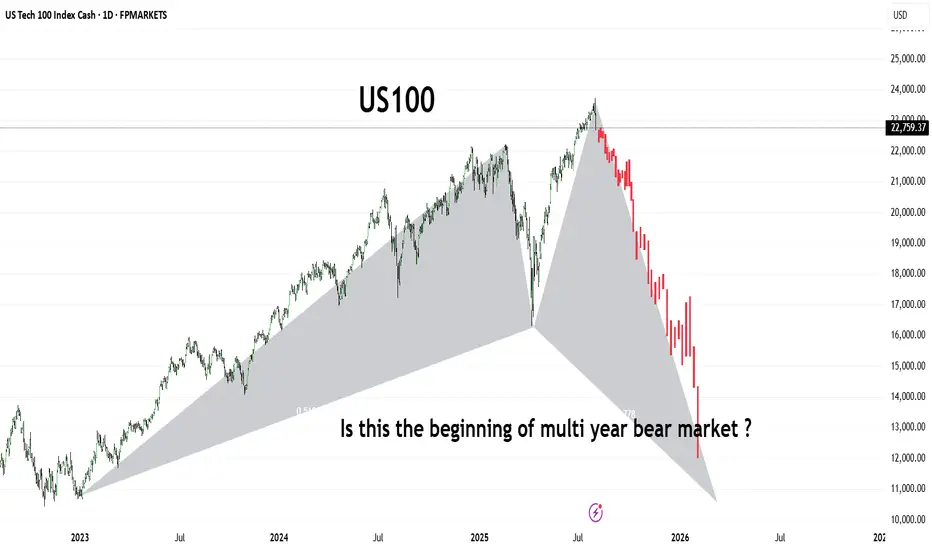
US100The US100 (Nasdaq 100) has shown a dramatic shift in trend, forming what appears to be a large-scale bearish harmonic pattern or potential M-top structure. After reaching its peak in mid-2025, the index has entered a sharp downward trajectory, shedding significant value in a short span.
This chart raises a critical question for long-term investors and traders:
Are we witnessing the early phase of a prolonged bear market that could stretch into 2026 and beyond?
🔻 Key Observations:
Bearish structure developing with aggressive selling pressure.
Potential breakdown from long-term support trendlines.
Momentum suggests institutional risk-off behavior.
Stay alert for macroeconomic cues, interest rate policy, and earnings season signals. A break below 13,000 could confirm a deeper bear cycle
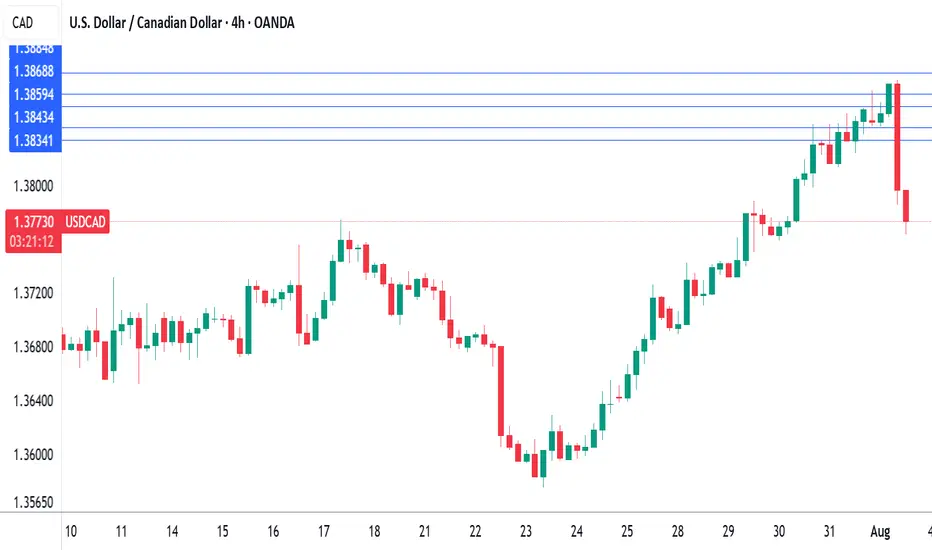
Canada's GDP contracts, US nonfarm payrolls misses forecastThe Canadian dollar continues to lose ground against its US counterpart and is trading at two-month lows. In the European session, the Canadian dollar is trading at 1.3875, down 0.13% on the day. USD/CAD has risen for six straight days, climbing 1.9% during that time.
US nonfarm payrolls for July were softer than expected at 73 thousand, compared to the forecast of 110 thousand. The June report was revised sharply downwards to 14 thousand from an initial 147 thousand.
Canada's GDP posted a small decline of 0.1% m/m in May, matching the market estimate. This followed an identical reading in April, as the economy is essentially treading water. A drop in retail trade was a significant factor in the weak GDP reading, particularly in motor vehicles and parts.
The decline in GDP in April and May can be squarely blamed on the trade war with the US, which has put a chill in economic activity. The markets are expecting a slight improvement in June, with an estimate of a 0.1% gain.
The Bank of Canada held the benchmark rate at 2.75% on Thursday for a third consecutive meeting. The rate statement noted that US trade policy remains "unpredictable" and Governor Macklem reiterated this at his press conference, saying that "some level of uncertainty will continue" until the US and Canada reach a trade agreement.
Meanwhile, the trade war between the two sides is heating up. President Trump announced on Thursday that the US was slapping 35% tariffs on Canadian products, effective Aug. 1. The new tariff will not apply to goods covered under the US-Mexico-Canada Agreement.
Canada's Prime Minister Mark Carney said he was "disappointed" with the US decision and vowed that "Canadians will be our own best customer". These are brave words, but Carney will be under pressure to reach a deal with the US, as 75% of Canadian exports are shipped to the US and Canada can ill-afford a protracted trade war with its giant southern neighbor.
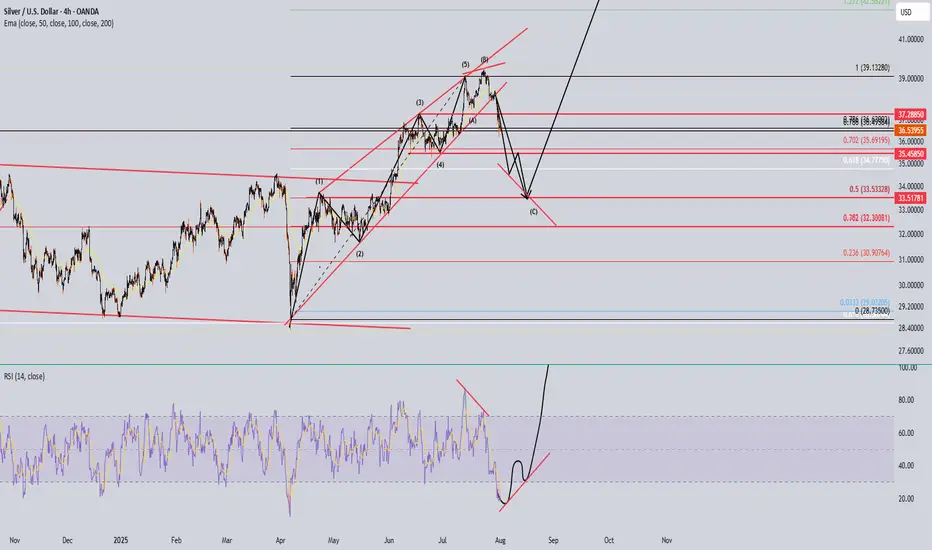
Wait SIlverLook at the RSI to form something like this in combine with the last 2 waves down. Then hopefully that power move to the 600?? Macro on the monthly its forming a cup and handle. If plays out silver will be super pricy
GBP weakness + USD gaining bullish momentumFX:GBPUSD 🧠 What’s Driving GBP Weakness?
❄️ Cooling Inflation: Slows BoE policy tightening
🔻 Contracting Manufacturing: PMI deep in the red
🛍️ Falling Retail Sales: UK consumers are pulling back
💼 Labor Market Cracking: Recent jobs data may be peak
💣 BoE Dovish Pivot Incoming: Markets are anticipating future cuts in 2025
🇺🇸 USD Strength: Fed holding steady, US macro much stronger than UK
🧭 Extra Confluence: USD Strength
USD is being supported by:
Strong US labor market 🟢
Higher for longer Fed 🟢
Global risk-off sentiment 🟢
Positive divergence in US CPI and Retail Sales 🟢
📌 GBPUSD is not just a GBP short — it’s a USD long play too.
🧩 Historical Price Action Pattern
In 2023 Q3, GBP/USD dropped nearly 700 pips in 6 weeks during similar macro shifts — soft BoE + strong USD.
We may be setting up for a repeat pattern now.
🗣️ What’s Your Take?
Are you looking to short GBP/USD this month?
Where’s your target or trigger zone?
Let’s compare setups ⤵️
I’m sharing more breakdowns weekly — follow for macro + technical convergence trades.

GBPJPY Fundamentally Bearish🧠 Macro-Fundamental Breakdown
🇬🇧 GBP (British Pound)
🔻 GDP Shrinking: UK growth has stalled with below-trend GDP prints 3 quarters in a row.
📉 PMI Weakness: Manufacturing and Services PMIs both under 50 = economic contraction
🧊 Retail Sales Down: UK consumer confidence and demand are cooling
💼 Labor Trouble: Unemployment ticking higher + BoE hinting at peaking rates
🪙 BoE Dovish Pivot?: Market now pricing possible cuts into early 2025.
🇯🇵 JPY (Japanese Yen)
🟢 Inflation is ticking higher
🔄 BoJ is cautiously shifting from ultra-loose policy
🛡️ Yen often strengthens in risk-off environments (which aligns with current market volatility)
🇯🇵 Tokyo CPI surprises have reinforced JPY support