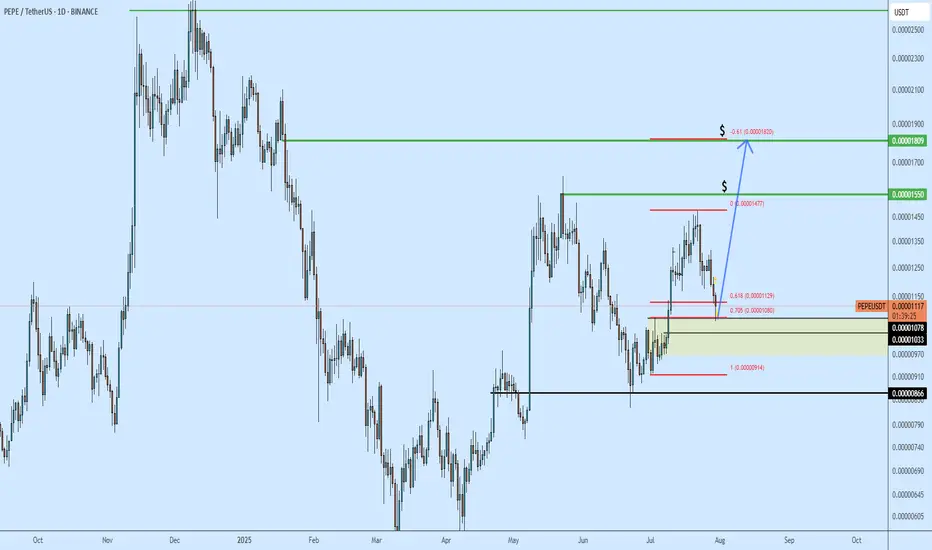
PEPE Uptrend continuation?PEPE has been trending higher over the last few weeks. Today it hit the fib level - seems to be getting a reaction. PEPE is a good hold for upside targets labeled ($).
I would keep thi bias unless we start invalidating (closing-below) 0.00000918
Community ideas
AUDUSD TRADE RECAPIn this video I explained the reasons as to why I didn't take AUDUSD and why I opted to trade GBPUSD! This can be the video that you need to watch before you close up the week. Wishing a good weekend guys

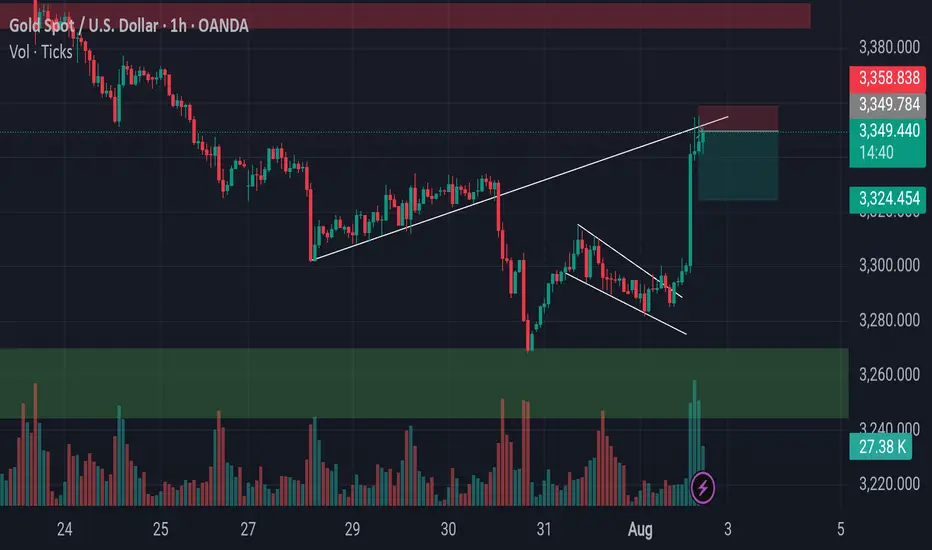
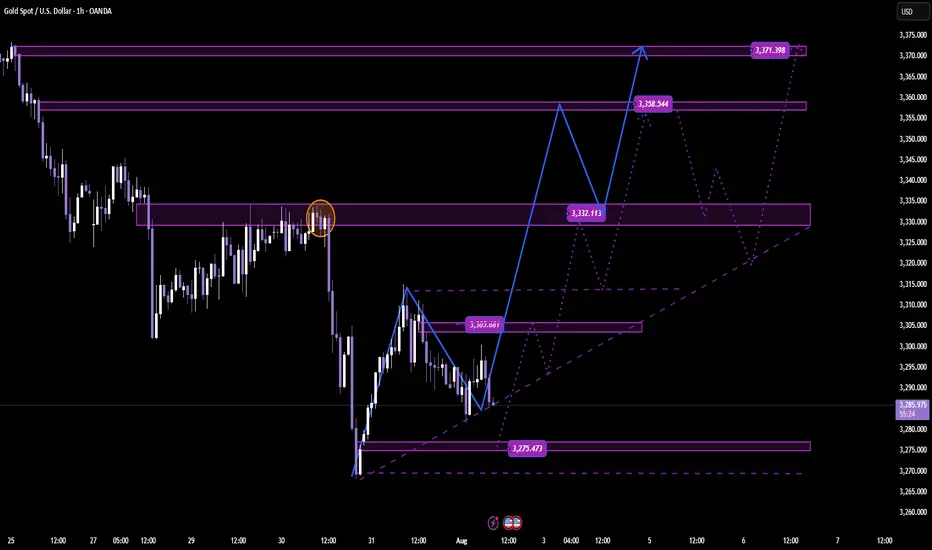
Gold Approaches Key Reversal Zone After Liquidity Sweep.Gold has recently broken out of a parallel channel during the New York session, followed by a strong upward move triggered by the NFP (Non-Farm Payroll) news event. Currently, the market is trading near a key trendline resistance zone. In this area, the price has also swept the liquidity residing above recent highs, indicating that potential buy-side liquidity has been taken out.
This level now becomes critical for observation. If the market forms a Market Structure Shift (MSS) or provides any valid bearish confirmation — such as a strong rejection candle, bearish engulfing, or a break of lower timeframe support — then there is a high probability that a downward move may follow from this zone.
As always, conduct your own research (DYOR) and wait for price action to confirm the bias before executing any trades. Acting on confirmation rather than assumptions protects both capital and strategy.
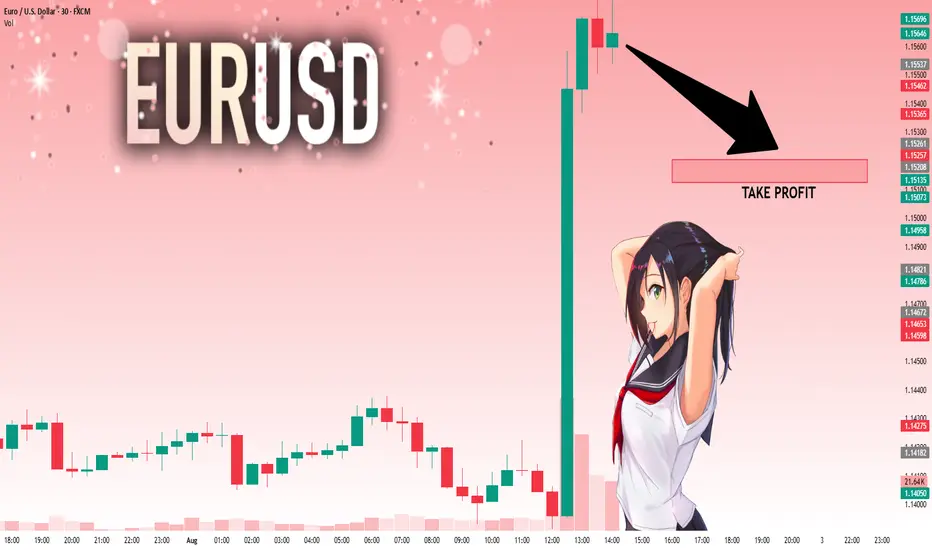
EURUSD: Move Down Expected! Short!
My dear friends,
Today we will analyse EURUSD together☺️
The price is near a wide key level
and the pair is approaching a significant decision level of 1.15337 Therefore, a strong bullish reaction here could determine the next move up.We will watch for a confirmation candle, and then target the next key level of 1.15208.Recommend Stop-loss is beyond the current level.
❤️Sending you lots of Love and Hugs❤️
Gold continues to go long in the 3280-3300 range.Gold continues to go long in the 3280-3300 range.
Today, we remain firmly bullish on a bottom in the 3280-3300 range.
On August 1st, the Federal Reserve, while keeping interest rates unchanged, acknowledged slowing economic growth, triggering a repricing of expectations for a rate cut.
This led to a rebound in gold prices, but of course, this was just a pretext for the price increase.
Recently, gold prices experienced a four-day decline (July 23-28), falling from $3431 to $3268, as progress in trade negotiations and a rebound in the US dollar dampened safe-haven demand.
Non-farm Payrolls
Here are the key takeaways:
Today's US July non-farm payrolls data (expected to increase by 110,000, compared to 147,000 previously) will determine expectations for a September rate cut by the Federal Reserve.
A weak reading (e.g., below 100,000) could push gold prices back towards $3,400;
A strong reading (above 150,000) would remain bearish for gold. Gold prices continue to decline, and we are long in the 3280-3300 range.
Today, we remain firmly bullish on gold bottoming in the 3280-3300 range.
On August 1st, the Federal Reserve, while keeping interest rates unchanged, acknowledged slowing economic growth, triggering a repricing of rate cut expectations in the market.
This led to a rebound in gold prices, but of course, this was just a pretext for the price increase.
Recently, gold prices experienced a four-day decline (July 23-28), falling from $3431 to $3268, as progress in trade negotiations and a rebound in the US dollar dampened safe-haven demand.
Non-farm Payroll Data
Here are the key takeaways:
Today's US July non-farm payroll data (expected to increase by 110,000, compared to 147,000 previously) will determine expectations for a September rate cut by the Federal Reserve. A weak reading (e.g., below $100,000) could push gold back to $3,400.
A strong reading (above $150,000) would continue to be bearish for gold.
Technical Analysis and Trading Recommendations
Key Levels:
Support:
$3,270 (100-day moving average)
$3,248 (June low);
Resistance:
$3,300 psychological level
$3,340 (21-day/50-day moving average crossover).
Trading Strategy:
Short-term:
1: If the price holds above $3,300, initiate a long position with a target of $3,330-3,350.
2: If the price falls below $3,270, a drop to $3,248 is possible.
3: Focus on the key watershed at $3,300
4: Key Point:
As long as the gold price is above $3,300, I believe it's a good time to buy the dip. Following the upward trend in gold prices is a very wise choice.
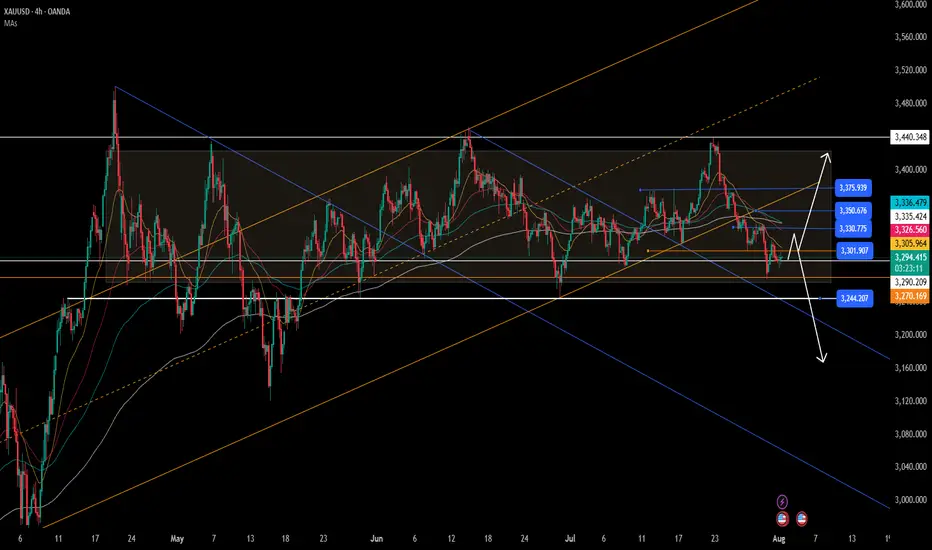
As shown in Figure 4h:
The potential for gold prices to rebound is becoming increasingly clear.
The lower edge of the wide fluctuation range is slowly stabilizing.
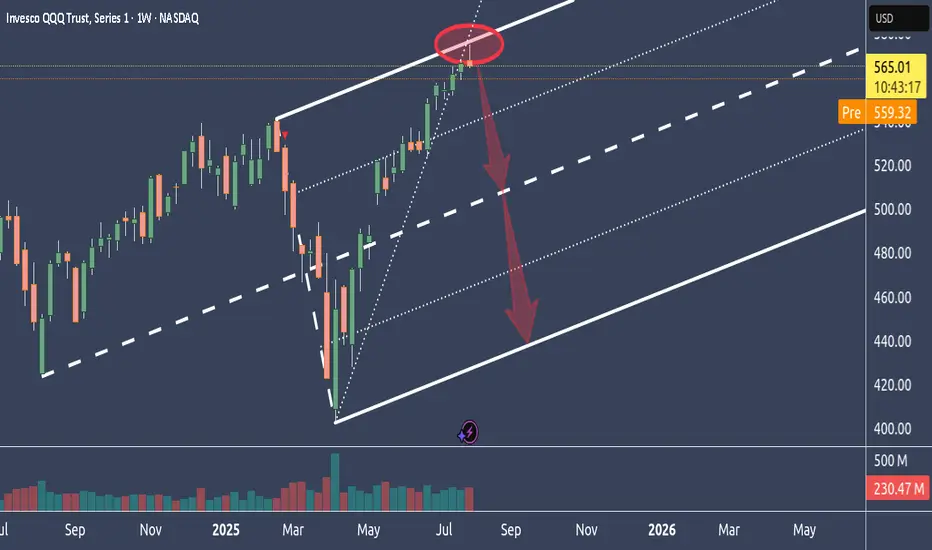
Why NQ is probably tanking big timeIn this weekly chart, we see QQQ, which represents the Nasdaq.
As we can see, it had a hell of a run up.
Too far too fast IMO, and it reached the stretch level at the Upper Medianline Parallel.
The natural move is now to let go, take a breath and trade down to center again, which is the Centerline.
After all the most major and most important earnings results are over, and Funds have pumped up their gains through manipulative Options plays, it's time to reap what they have planted and book the gains.
It's all in line with, all moves are at the point, and everything is showing in a simple chart.
Unless price is opening and closing outside of the U-MLH, it's time to load the Boat and sail to the South.
THE STOCK MARKET IS BULLISH BUT NEEDS A SMALL CORRECTIONIn this video, we look at the weekly chart of the S&P 500 to determine if a correction is near and spoiler alert. Yes, it is. Here's what happens.

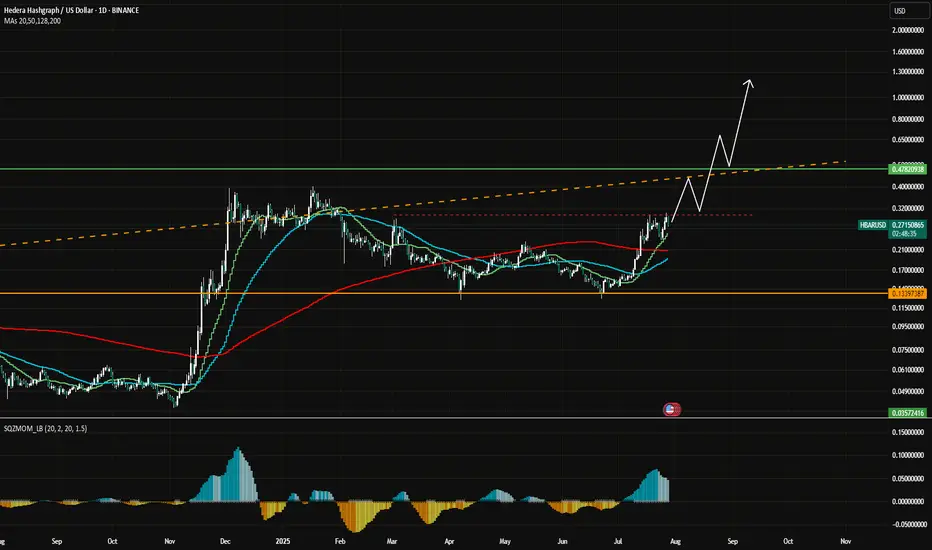
HBAR Momentum Hbar has gained some momentum lately. This is the ideal rally setup.
It has also yet to see real price discovery past .5
Large trade already opened.
DYOR, I believe this coin has a ton of potential.
Hederas' Council consists of entities like Google, IBM, Boeing Through VentureX, Standard bank.. Just to name a few.
But you all don't care about that.
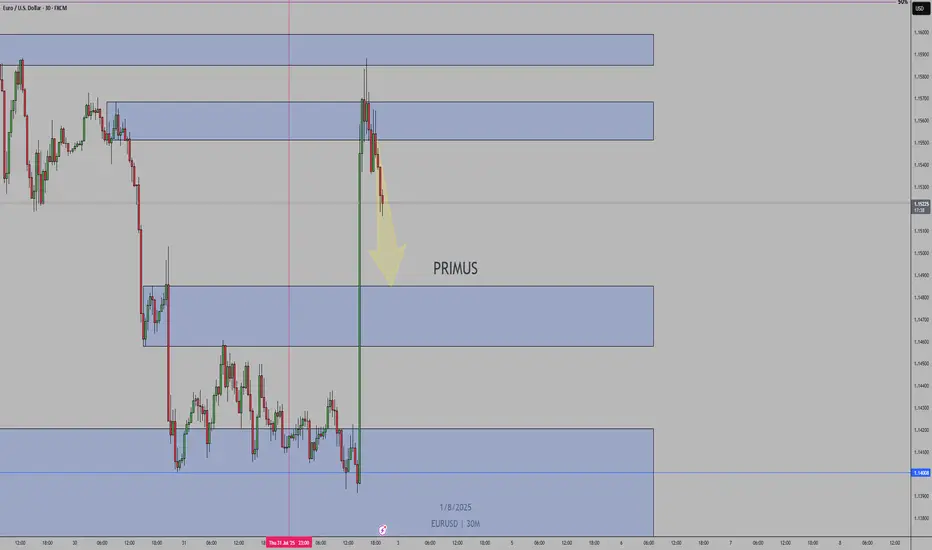
EURUSDPrice rejecting supply; structure showing lower highs/lows. COT supports USD strength — expecting further downside.
EUR/USD (Bearish)
Price rejecting supply; lower highs/lows forming with COT backing USD strength. Bias remains bearish toward next support.
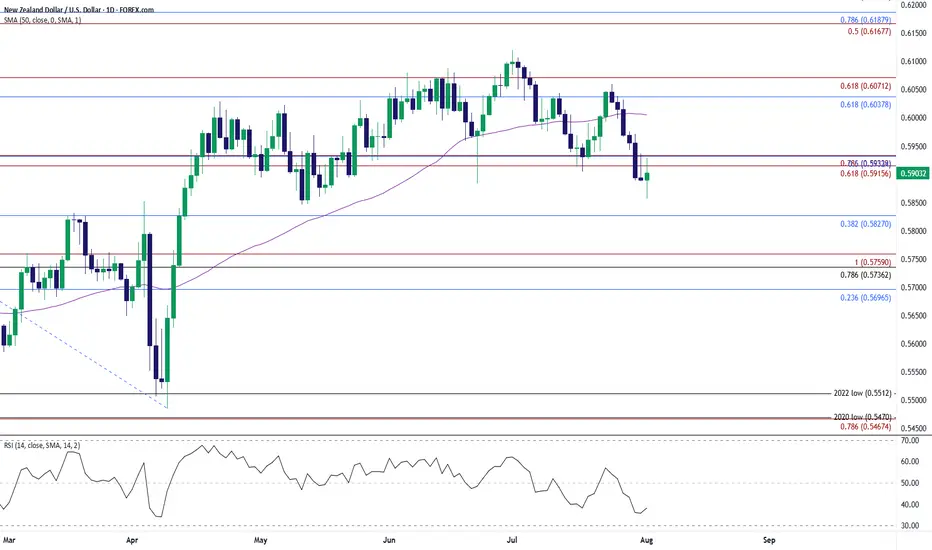
NZD/USD Holds Above May LowNZD/USD halts the decline from earlier this week to hold above the May low (0.5847), with a move/close above the 0.5920 (61.8% Fibonacci extension) to 0.5930 (78.6% Fibonacci extension) region bringing the 0.6040 (61.8% Fibonacci retracement) to 0.6070 (61.8% Fibonacci extension) zone on the radar.
Next area of interest comes in around the July high (0.6120), but the rebound in NZD/USD may turn out to be temporary if it struggles to trade back above the 0.5920 (61.8% Fibonacci extension) to 0.5930 (78.6% Fibonacci extension) region.
A breach of the May low (0.5847) opens up 0.5830 (38.2% Fibonacci retracement), with the next area of interest coming in around 0.5740 (78.6% Fibonacci retracement) to 0.5760 (100% Fibonacci extension).
--- Written by David Song, Senior Strategist at FOREX.com
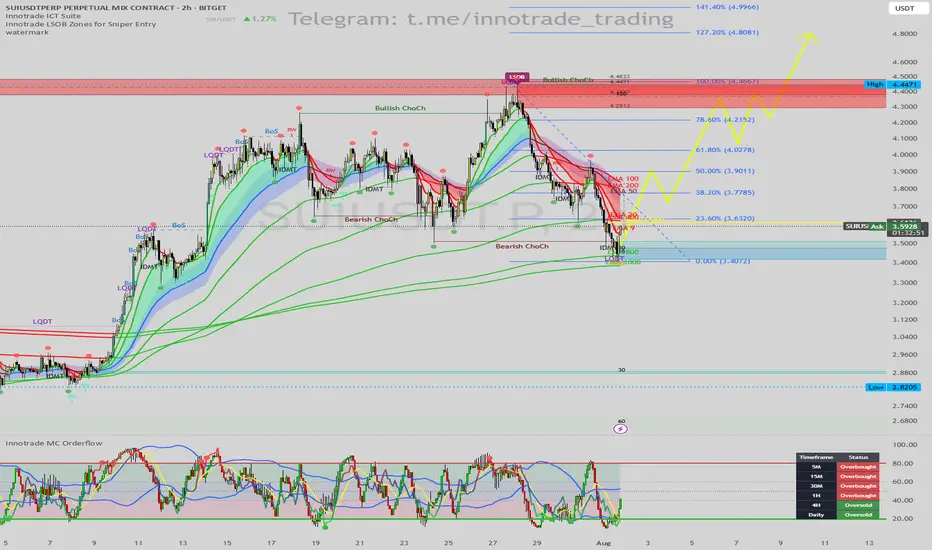
SUI/USDT: Prime Long Setup from LSOB Demand & Daily OversoldHello traders,
This analysis highlights a high-probability long setup on SUI/USDT (2H Chart). The current price action presents a classic institutional-style reversal pattern, strongly confirmed by momentum indicators signaling a bottom may be in.
1. Trend & Context (The "Why")
While the short-term trend has been corrective after a "Bearish ChoCh," price has now entered a major area of interest where a powerful bullish move could originate.
Here is the confluence checklist:
Primary Signal (LSOB Zone): Price has tapped into a key Bullish LSOB (Liquidity Sweep Order Block). This is a critical demand zone where smart money is likely to absorb selling pressure and initiate long positions.
Liquidity Sweep Confirmation: The price action confirms this with a clear Liquidity Sweep (LQDT), where the price wicked down to take out stops below the previous lows before reversing. This is a very strong bullish signal.
Momentum Exhaustion (MC Orderflow): This is where the setup gains its highest conviction:
The MC Orderflow oscillator is in the EXTREME OVERSOLD territory, indicating that sellers are exhausted.
CRITICAL MTF CONFLUENCE: The Multi-Timeframe Cycle Table is showing that both the 4H and Daily timeframes are "Oversold." This alignment of higher timeframe momentum with our 2H demand zone is the most powerful confirmation for this trade.
2. Entry, Stop Loss, and Targets (The "How")
This confluence provides a clear and structured trade plan with excellent risk-to-reward potential.
Entry: An entry around the current price ($3.50 - $3.58) is ideal, as we are in the LSOB demand zone. For a more conservative entry, one could wait for the 2H candle to close bullishly.
Stop Loss (SL): $3.38. This places the stop loss just below the low of the liquidity sweep wick. If this level is broken, the bullish setup is invalidated.
Take Profit (TP) Targets:
TP1: $3.90 (Targeting the cluster of short-term EMAs and the recent swing high).
TP2: $4.28 (The next major structural resistance).
TP3: $4.45 (The major swing high, which is also a Bearish LSOB supply zone).
Conclusion
This trade presents a superb opportunity due to the powerful combination of a price-action sweep into a key demand zone (LSOB), confirmed by severe multi-timeframe momentum exhaustion. This alignment across indicators points towards a high-probability bullish reversal.
Disclaimer: This is not financial advice. This analysis is for educational purposes only. Always conduct your own research and manage your risk appropriately.
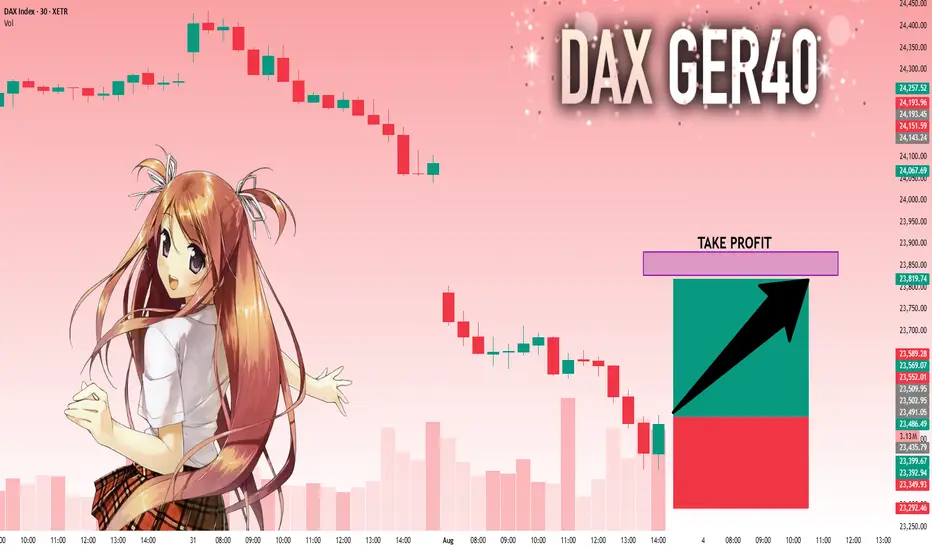
DAX: Next Move Is Up! Long!
My dear friends,
Today we will analyse DAX together☺️
The in-trend continuation seems likely as the current long-term trend appears to be strong, and price is holding above a key level of 23,502.95 So a bullish continuation seems plausible, targeting the next high. We should enter on confirmation, and place a stop-loss beyond the recent swing level.
❤️Sending you lots of Love and Hugs❤️
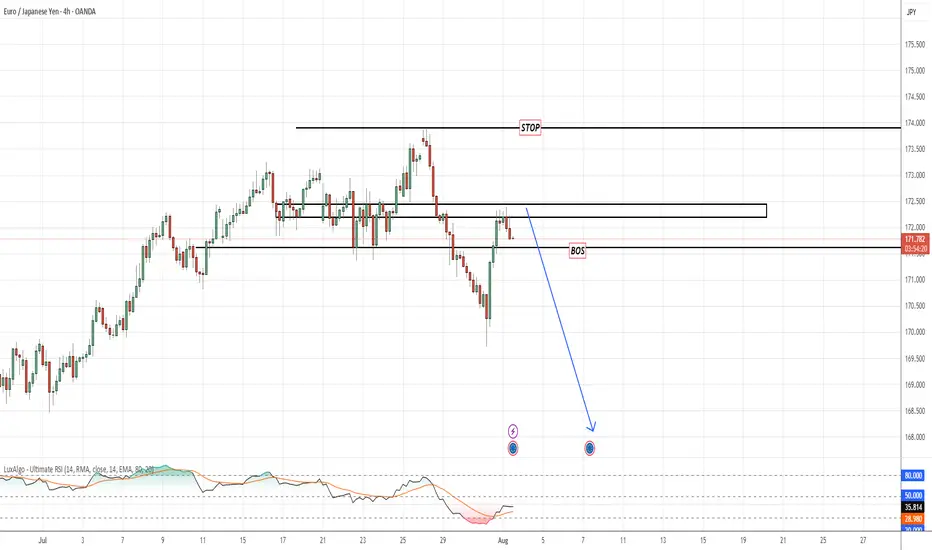
EURJPYPrice just broke key internal structure with a clear BoS (Break of Structure) after liquidity sweep above the previous highs. We're now watching for a clean retracement to the supply zone to execute a sniper short.
📍 Setup Details:
BoS Confirmed: 172.00 level cleanly broken
Area of Interest: Supply zone 172.90–173.60
Stop: Above liquidity zone ~174.55
Target: Downside continuation toward 168.00–167.00
📉 RSI shows momentum weakness on the pullback
GOOGL Slips into Bearish Gamma Territory. 8/1GOOGL Slips into Bearish Gamma Territory — Eyes on $190 Defense or Slide to $187.50
🔍 GEX & Options Flow Insight (1st Image Analysis)
GOOGL has broken down from its recent consolidation and is now testing the $190–$192 gamma support band. The GEX profile shows heavy negative gamma just below current price, increasing the risk of accelerated selling if $190 fails.
* Call Walls & Resistance:
* 📍 $194.91–$196.53 → First resistance zone
* 📍 $197.85 → Highest positive NET GEX / Gamma Wall
* 📍 $202.50+ → Out of immediate range unless a strong reversal occurs
* Put Walls & Support Zones:
* 🛡️ $190.50 → Current gamma pivot
* 🚨 $187.50 → 2nd Put Wall / Hard gamma floor
* 📉 Below $187.50 opens the door to $185–$182
* Volatility Insight:
* IVR 18.9, IVx Avg 32.5 → Slightly elevated IV
* Call flow 11.2% → Bearish leaning
* GEX sentiment: 🔴🔴🔴 = Negative gamma environment → more volatility to downside
✅ Option Trading Suggestion:
Bias: Bearish unless reclaiming $194+
Strategy: Bear put spread
* Entry Idea: Buy 190P / Sell 185P for Aug 2 or Aug 9 expiry
* Invalidation: Close above $194.91
* Target: $187.50 → $185
Why this works: Dealers in negative gamma hedge by selling into weakness, which can accelerate moves lower. Losing $190 likely brings $187.50 quickly into play.
🧠 Technical Analysis (1H Chart) (2nd Image Analysis)
Market Structure & SMC:
* 🟥 CHoCH confirmed after rejection from $197.85 supply
* ❌ Price broke BOS support from $194.91 area
* Trading in a descending structure toward $190 support
Trendline Dynamics:
* Broke short-term uptrend
* Now respecting a lower parallel channel toward $187.50
SMC Zones:
* 🟩 Demand Zone: $190.50–$187.50 → First defense zone
* 🟥 Supply Zone (Purple Box): $194.91–$197.85 → Immediate resistance
🔄 Price Action & Key Levels
* Support:
* ✅ $190.50 → Current hold line
* ✅ $187.50 → Gamma floor
* 🚨 Below $187.50 → $185 → $182
* Resistance:
* 🚩 $194.91 → First reclaim level for relief rally
* 🚩 $196.53–$197.85 → Supply + Gamma Wall
🧭 Scalping / Intraday Trade Setup
🟥 Bearish Setup (Preferred):
* Entry: Failed bounce at $194–$195
* Target 1: $190.50
* Target 2: $187.50
* Stop: Above $196
🟩 Bullish Reversal Setup:
* Entry: Strong reclaim of $196.50 with volume
* Target 1: $197.85
* Target 2: $200+
* Stop: Back under $194
🔁 Summary Thoughts
* GOOGL has shifted from neutral to negative gamma, favoring continued downside pressure.
* $190.50 is the short-term line in the sand — losing it risks a swift trip to $187.50.
* Any bounce into $194–$196 is likely to face selling pressure unless backed by volume and a gamma flip.
🚨 Disclaimer:
This analysis is for educational purposes only and does not constitute financial advice. Always do your own research and manage your risk accordingly.

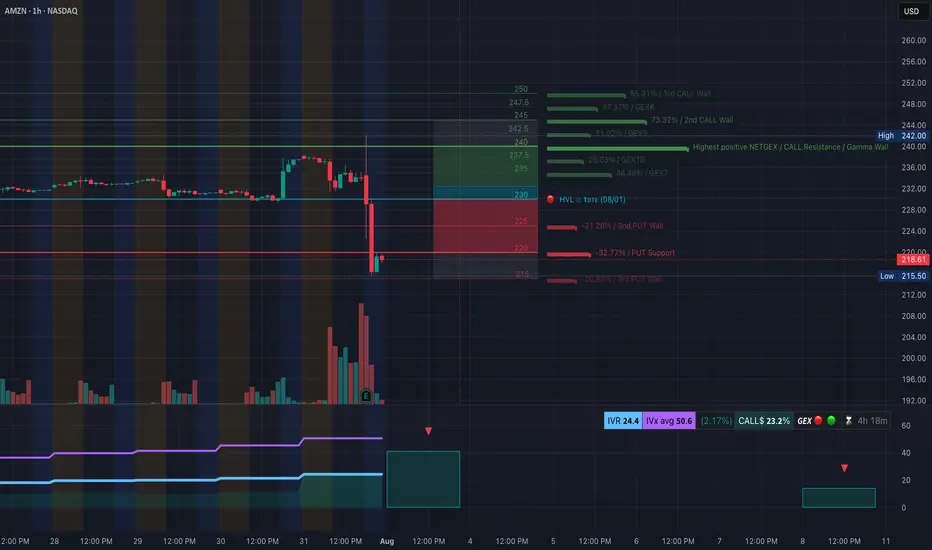
AMZN Earnings Flush — Gamma Flip to the Downside. 8/1AMZN Earnings Flush — Gamma Flip to the Downside, Eyes on $215 Support!
🔍 GEX & Options Flow Insight (1st Image Analysis)
AMZN collapsed post-earnings, breaking through major gamma support levels and flipping into a negative gamma environment. Price is now pressing against a critical $215–218 demand zone, with GEX showing heavy put concentration.
* Call Walls & Resistance:
* 📍 $230.00–$234.00 → Former gamma pivot now acting as strong resistance
* 📍 $237.50 → Prior support zone; now a sell wall
* 📍 $244.00 → Highest Positive NET GEX / Gamma Wall (too far for immediate recovery unless momentum shifts)
* Put Walls & Support Zones:
* 🛡️ $222.18 → 2nd Put Wall resistance-turned-support
* 🚨 $218.00 → Current price — key defense line
* 📉 $215.50 → Hard put wall support — losing this could accelerate selloff toward $210
* Volatility Insight:
* IVR 24.4, IVx Avg 50.6 → Elevated IV post-earnings
* Call flow 23.2% → Bearish options flow bias
* GEX sentiment: 🔴🟡🔴 = Negative gamma = higher volatility risk to downside
✅ Option Trading Suggestion:
Bias: Bearish unless AMZN reclaims $224+
Strategy: Bear put spread
* Entry Idea: Buy 220P / Sell 215P for Aug 2 or Aug 9 expiry
* Invalidation: Strong daily close above $224
* Target: $215 → $210
Why this works: Negative gamma positioning means market makers hedge by selling into weakness, accelerating downside moves. The inability to reclaim $224 confirms the bearish structure.
🧠 Technical Analysis (1H Chart) (2nd Image Analysis)
Market Structure & SMC:
* 🟥 CHoCH confirmed after earnings drop
* ❌ Lost all recent BOS levels in one sharp flush
* Price trapped under former OB resistance at $224–230
Trendline Dynamics:
* Broke out of prior bullish channel to the downside
* New descending channel forming with lower highs
SMC Zones:
* 🟩 Demand Zone: $215.50–$218.00 → Immediate defense
* 🟥 Supply Zone (Purple Box): $224–$230 → Sell wall
🔄 Price Action & Key Levels
* Support:
* ✅ $218.00 → Current defense
* ✅ $215.50 → Last line of gamma support
* 🚨 Below $215.50 → Sell momentum can accelerate to $210
* Resistance:
* 🚩 $224.00 → First reclaim needed for relief rally
* 🚩 $230.00–$234.00 → Heavy resistance
🧭 Scalping / Intraday Trade Setup
🟥 Bearish Setup (Preferred):
* Entry: Failed reclaim of $224
* Target 1: $218.00
* Target 2: $215.50
* Stop: Above $224
🟩 Bullish Reversal Setup:
* Entry: Strong reclaim of $224 with volume
* Target 1: $230.00
* Target 2: $234.00
* Stop: Back under $222
🔁 Summary Thoughts
* AMZN flipped from bullish gamma to negative gamma — puts are now driving price action.
* As long as price stays under $224, rallies are sell opportunities.
* Losing $215.50 risks an accelerated drop to $210 or lower.
* Bears remain in control unless buyers step in aggressively at support.
🚨 Disclaimer:
This analysis is for educational purposes only and does not constitute financial advice. Always do your own research and manage your risk accordingly.
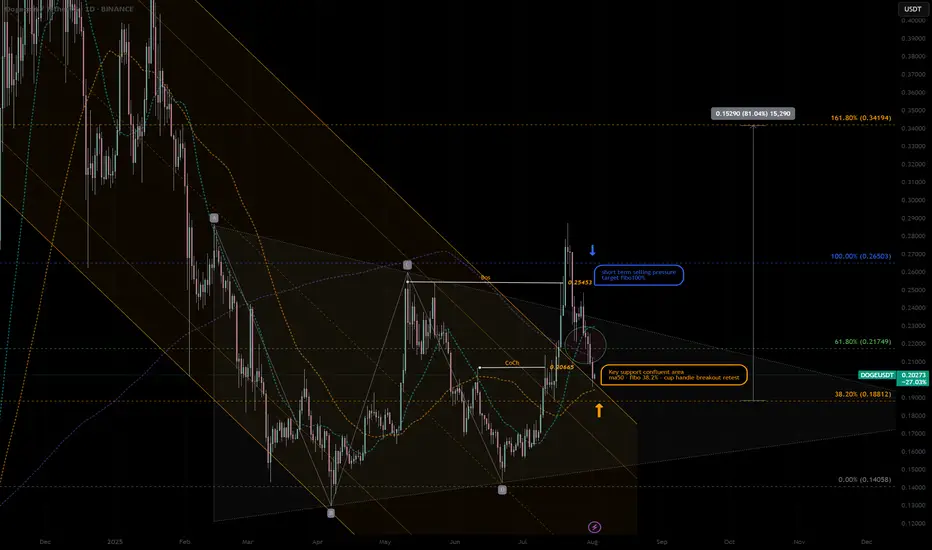
DOGEUSDT|Pullback Confluent Support -cup&handle next ext. +80%DOGE - retraced at the confluent support zone, high potential pullback buy position:
- SMA50 Dynamic support—often attracts mean-reversion buys.
- cup & handle support retest Price retested prior breakout zone—flips resistance to support.
- key 38% Fib “sweet spot” pullback level after corrective moves.
- Previous Change of Character marks shift from bearish to bullish structure—support confluence.
Potential Entry & Risk Management
Entry Zone
- Aggressive: immediate handle breakout support
- Conservative: Wait for liquidity pattern and re-bounce confirmation candle above SMA50
Stop-Loss
-Below Cup Handle low -10% larger position prior swing high RR:2.5/1
-Suggested SL: previous low -0.17 USDT - 5% below entry
Initial Targets
-Key resistance 61.8% Fib retracement — 0.217 USD
-100% Prior swing high — 0.26 USD
-162% Next extended target - 0.35 USD
Trade Rationale
-Mean-reversion into SMA50 and Fib 38.2% zone aligns multiple buyers.
-Pattern support: Cup & handle retest confirms breakout strength.
-Structure flip: CoCh zone indicates bullish regime shift.
Watch-Outs
-Rejection below 0.188 USD erodes support cluster—invalidates setup.
-Rising volume on bounce is crucial—low-volume lifts often fail.
-Beware broader market sell-offs impacting altcoins.
Next Steps:
-Monitor 4-hour candlestick close inside entry zone.
-Check volume spike on reversal candle.
-Adjust risk dynamically if price gravitates toward upper channel resistance.
Always trade with affordable risk and respect your stop..
Ascending Channel Bounce – Long SetupAscending Channel Support Test – Potential Reversal Setup 📈
Price has just tested the lower boundary of the ascending channel and reacted strongly, signaling potential buying interest at this level.
RSI is hovering near the oversold zone, adding confluence to a possible bullish reversal scenario.
Trade Idea:
Entry: 0.89
Target 1: 1.178
Target 2: Previous swing high at 1.69
Stop-loss: Below the channel support breakout
A break and hold above 1.178 could pave the way for a continuation toward the previous high. Watching for volume and bullish candlestick confirmation before adding to the position.
#TechnicalAnalysis #AscendingChannel #RSI #CryptoTrading #ChartPatterns #PriceAction #TradingSetup #BullishScenario #SupportAndResistance #SwingTrade #CryptoSignals

Pattern targetIn the previous analysis, we spotted a head and shoulders pattern and mentioned that if it gets activated, it will hit the pattern target — and that’s exactly what happened.
A clean and beautiful setup.
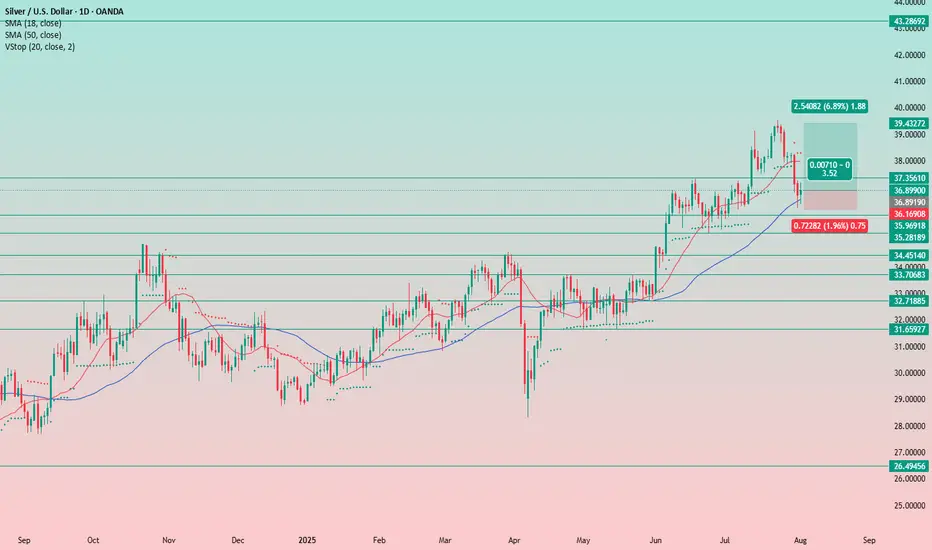
Silver Remains a Buy on DipsIt seems the precious metals market didn’t mourn the Fed’s decision and subsequent press release for long.
The uptrend remains intact, and the previously supportive factors are still in play.
Even amid the negative news, there was no sharp sell-off — everything stayed within the trend. This clearly signals that rate cuts are on the horizon, and metals are likely to continue their upward move.
We only trade from the long side — nothing has changed.
At the moment, we've seen a pullback, and it feels strange not to take advantage of it and add more silver to the portfolio.
Stop-loss is set below yesterday’s candle low at 36.15.
We’ll see how the position develops. For now, the idea is to hold as long as the stop-loss holds. The long-term target is 48. Obviously, we won't reach it quickly, so I’ll trail the stop as the trade progresses — first to breakeven, and eventually into profit.
DAILY SCALPING PLAN | CLINTON SMC STYLE✅ XAU/USD - DAILY SCALPING PLAN | CLINTON SMC STYLE
📆 Date: August 1st, 2025
📍 Strategy: Smart Money Concepts (SMC)
🔑 Focus: Liquidity Sweep | Order Block | BOS | Premium/Discount Model
🔍 Market Overview
Gold (XAU/USD) is currently in a manipulation phase after a strong move down from a premium supply zone. The market has swept key liquidity and is preparing for a high-probability move in both directions based on Smart Money footprints.
Current structure suggests:
Bullish intent forming from a discount demand zone.
Liquidity resting above recent highs – perfect for short-term scalps and intraday swings.
🟢 BUY SETUP – DISCOUNT DEMAND REACTION
🎯 Entry: 3275
🛡️ Stop Loss: 3268
🎯 Take Profits:
TP1: 3285
TP2: 3295
TP3: 3305
TP4: 3315
TP5: 3325
TP6: 3335
Reasoning:
This is a clean bullish OB resting beneath a CHoCH and BOS zone. Price may wick into this area as Smart Money reloads after sweeping early long positions. If held, expect sharp upside expansion toward previous liquidity highs.
🔴 SELL SETUP – PREMIUM SUPPLY REJECTION
🎯 Entry: 3356
🛡️ Stop Loss: 3362
🎯 Take Profits:
TP1: 3350
TP2: 3345
TP3: 3340
TP4: 3330
TP5: 3320
Reasoning:
This level is a key supply block where price previously distributed. If price expands into this zone, it’s likely to act as a liquidity magnet for Smart Money to offload longs and enter short-term shorts. Expect reaction.
🧠 SMC Insights
Internal BOS & CHoCH signal early signs of accumulation.
Price respects the premium vs. discount framework with clear liquidity targets.
SMC traders understand that price doesn’t move randomly – it targets liquidity, mitigates OBs, and respects structure.
🔔 Note:
Always wait for clear confirmation (rejection wick, engulfing pattern, or M15 structure shift) before execution. Entries without confirmation are riskier in current volatility.
📌 Follow @ClintonScalper for daily SMC scalping plans & deep institutional insight.
🔁 Like, comment & share if you find this helpful!
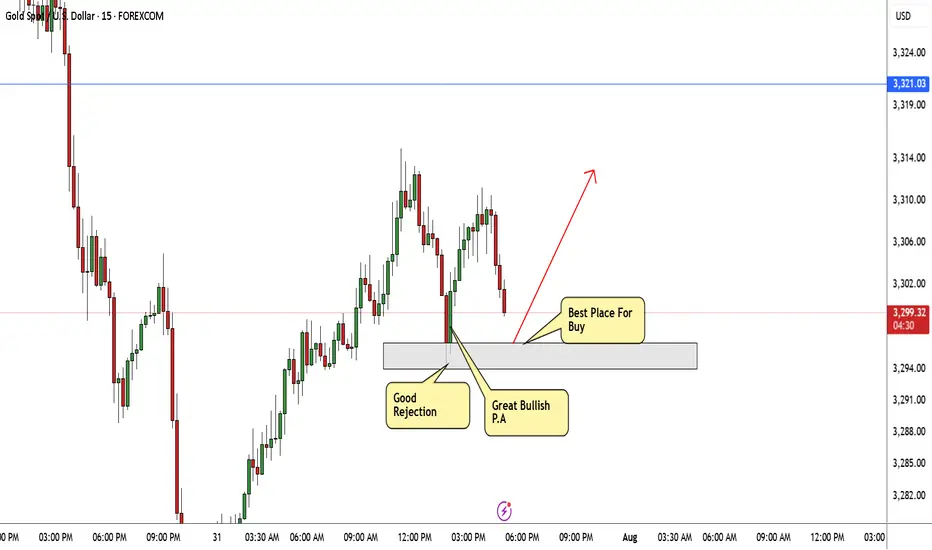
GOLD Bullish Today , Long Scalping Entry Valid To Get 150 Pips !Here is My 15 Mins Gold Chart , and here is my opinion , we finally above 3296.00 and we have a 30 Mins Candle closure above it , so i`m waiting the price to go back and retest this res and new support and give me a good bullish price action to can enter a buy trade and we can targeting 100 to 150 pips .
Reasons To Enter :
1- New Support Created
2- Bullish Price Action
3- Bigger T.F Giving Good Bullish P.A .
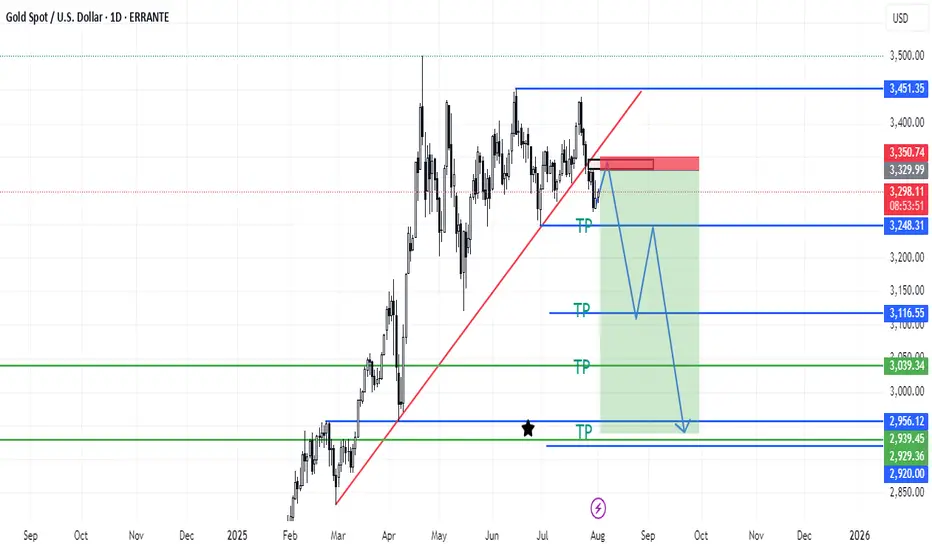
XAUUSD Possibility of a small correction towards 3330, re-entering the bearish phase and moving towards the specified targets
XAUUSD Analysis todayHello traders, this is a complete multiple timeframe analysis of this pair. We see could find significant trading opportunities as per analysis upon price action confirmation we may take this trade. Smash the like button if you find value in this analysis and drop a comment if you have any questions or let me know which pair to cover in my next analysis.
