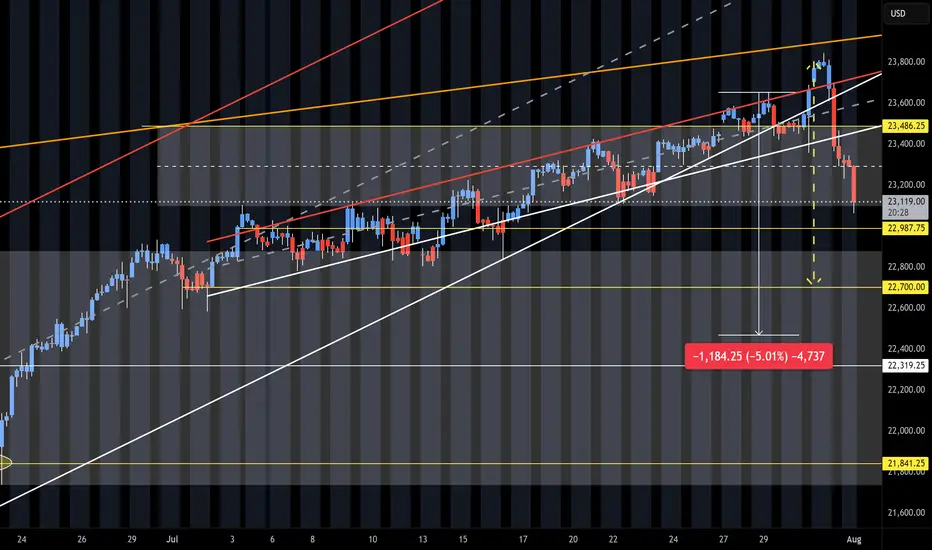
NQ Short (08-01-25)The 5% pull back is playing out. We had the heavy selling after the O/N Pump/Dump into the selling of the Reg Session and Outside Day Reversal. Up for weeks and down in hours. Next break down will have to be the failure of the long standing Friday into Monday Long Play. We did get the reg session selling and now O/N selling. Looking for the trifecta and failed F-M move. Long Trap is active. Just watch the timely Tweets and Tricks at KL's.
Community ideas
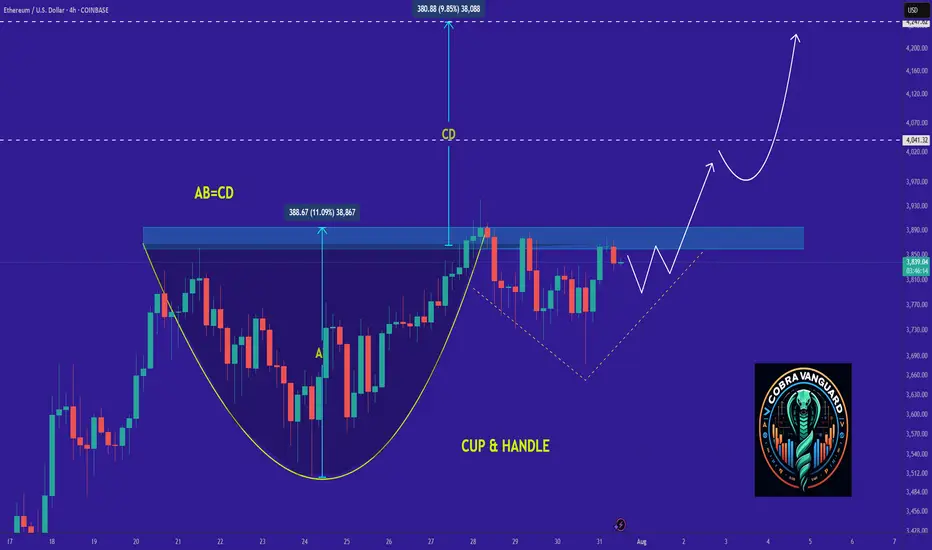
Why ETH Remains Bullish and Its Next Potential Move !It appears that the price is forming a cup and handle pattern, and if this occurs, it could push the price above $4K.
Best regards CobraVanguard.💚
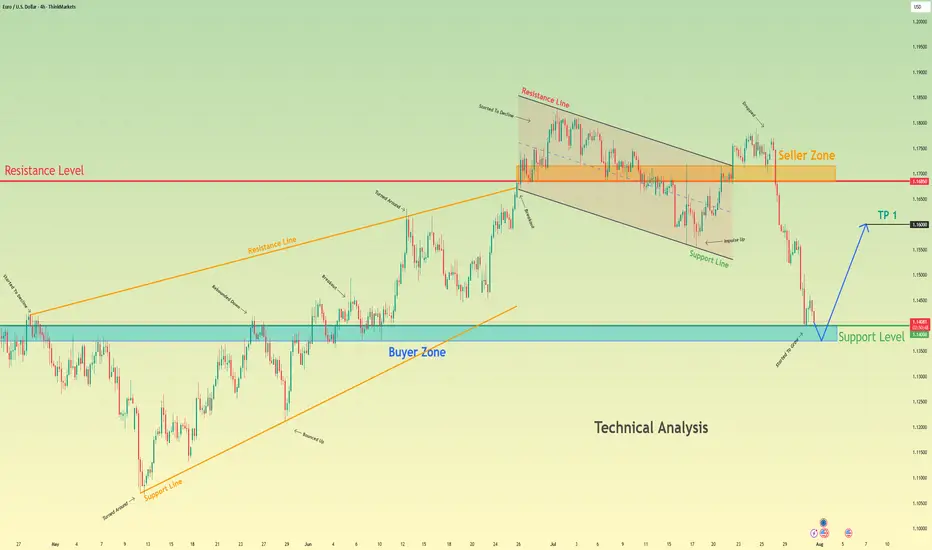
Euro bounce from buyer zone and start to move upHello traders, I want share with you my opinion about Euro. After a prolonged upward trend which formed a large rising wedge, the EURUSD faced a significant rejection from the seller zone near the 1.1685 resistance level. This failure to continue higher marked a key turning point, exhausting the bullish momentum and initiating a new bearish market phase. This new phase has since taken the form of a well-defined downward channel, within which the price has been undergoing a series of downward corrections and impulses. The most recent market action has been a sharp downward fall, accelerating the price's descent towards a critical area of historical significance. Currently, the pair is approaching the major support level at 1.1400, which also constitutes a strong buyer zone where demand has previously stepped in. The primary working hypothesis is a long, counter-trend scenario, which anticipates that the current bearish momentum will be absorbed by the strong demand within this buyer zone. A confirmed and strong rebound from this 1.1400 support area would signal a potential temporary bottom and the start of a significant upward correction. Therefore, the tp for this rebound is logically set at the 1.1600 level, a key psychological and technical point that represents a realistic first objective for a bounce of this nature. Please share this idea with your friends and click Boost 🚀
Disclaimer: As part of ThinkMarkets’ Influencer Program, I am sponsored to share and publish their charts in my analysis.
GBPCHF I Weekly CLS I Model 2 I Target full CLS rangeYo Market Warriors ⚔️
Fresh outlook drop — if you’ve been riding with me, you already know:
🎯My system is 100% mechanical. No emotions. No trend lines. No subjective guessing. Just precision, structure, and sniper entries.
🧠 What’s CLS?
It’s the real smart money. The invisible hand behind $7T/day — banks, algos, central players.
📍Model 1:
HTF bias based on the daily and weekly candles closes,
Wait for CLS candle to be created and manipulated. Switch to correct LTF and spot CIOD. Enter and target 50% of the CLS candle.
For high probability include Dealing Ranges, Weekly Profiles and CLS Timing.
Analysis done on the Tradenation Charts
Disclosure: I am part of Trade Nation's Influencer program and receive a monthly fee for using their TradingView charts in my analysis.
Trading is like a sport. If you consistently practice you can learn it.
“Adapt what is useful. Reject whats useless and add whats is specifically yours.”
David Perk aka Dave FX Hunter
💬 Don't hesitate to ask any questions or share your opinions

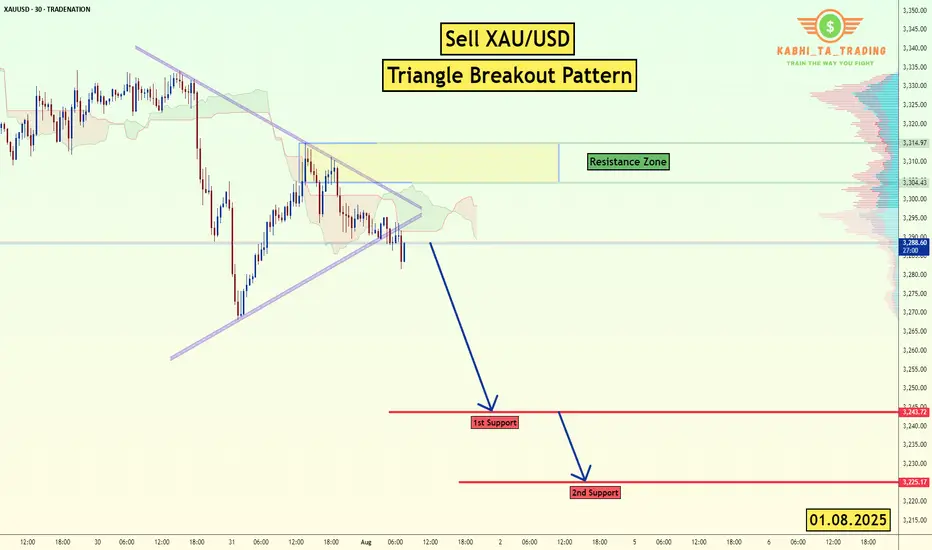
XAU/USD (Gold) - Triangle Breakout (1.08.2025)The XAU/USD Pair on the M30 timeframe presents a Potential Selling Opportunity due to a recent Formation of a Triangle Breakout Pattern. This suggests a shift in momentum towards the downside in the coming hours.
Possible Short Trade:
Entry: Consider Entering A Short Position around Trendline Of The Pattern.
Target Levels:
1st Support – 3249
2nd Support – 3225
🎁 Please hit the like button and
🎁 Leave a comment to support for My Post !
Your likes and comments are incredibly motivating and will encourage me to share more analysis with you.
Best Regards, KABHI_TA_TRADING
Thank you.
Disclosure: I am part of Trade Nation's Influencer program and receive a monthly fee for using their TradingView charts in my analysis.
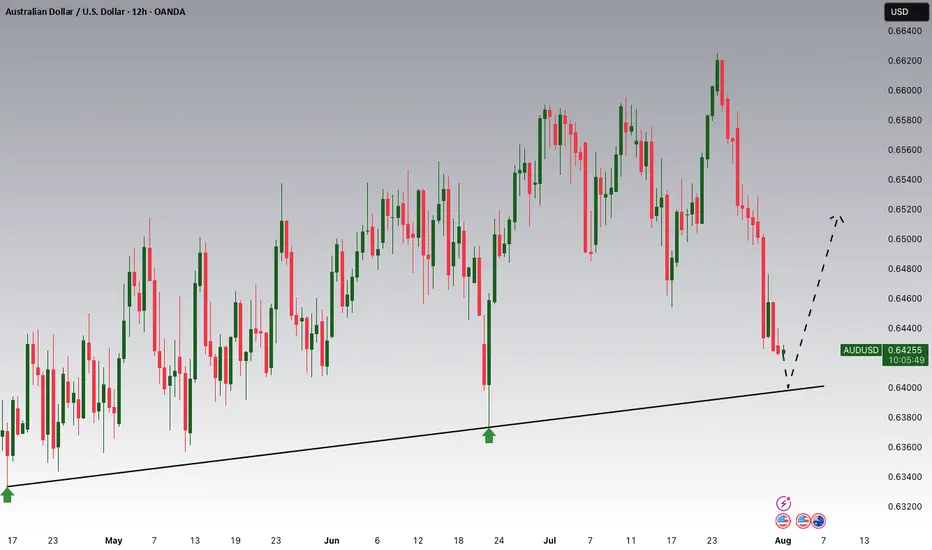
AUDUSD Potential UpsidesHey Traders, in today's trading session we are monitoring AUDUSD for a buying opportunity around 0.64000 zone, AUDUSD is trading in an uptrend and currently is in a correction phase in which it is approaching the trend at 0.64000 support and resistance area.
Trade safe, Joe.
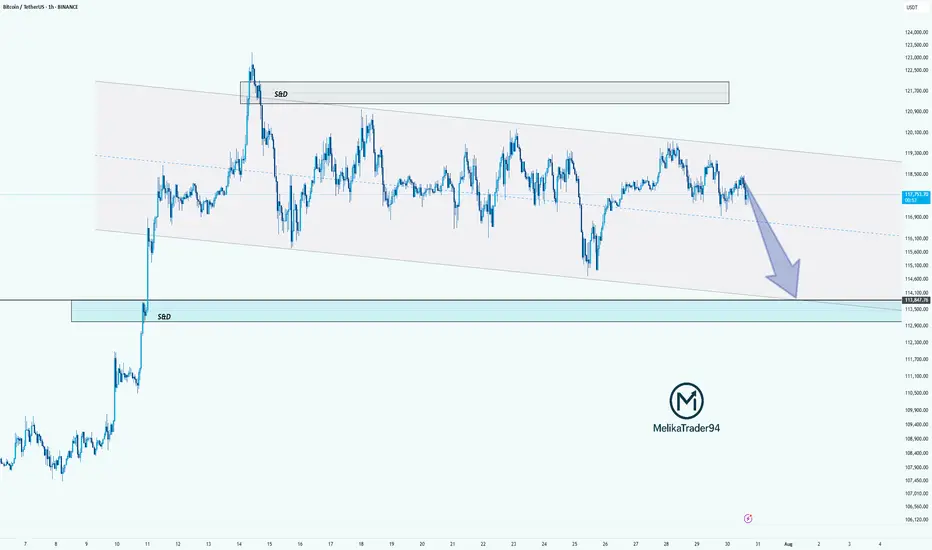
BTC HUGE DROP TO 113,400$ - BIG CRASH !*Sorry for posting to late as I am between a trip in Malaysia.*
Details:
Entry: Now - 117,000 $
Target Price: 113,410 $
Stop loss: 119,460 $
Trade Ideas:
Market creating a flag pattern here. Though its not only the logic we have some secret logics here and indicators which I shared in the VIP.
What is required to Join VIP?
- Nothing just you have to share 10% of your profit with us at the end of the month which you earned from our signals. Yeah this is just the requirement, trade where ever you like your favorite broker or else you don't need to pay fees first or create account thru our link.
Trade Signal:
I provide trade signals here so follow my account and you can check my previous analysis regarding BITCOIN. So don't miss trade opportunity so follow must.
BINANCE:BTCUSDT BINANCE:BTCUSDT.P BINANCE:BTCUSD

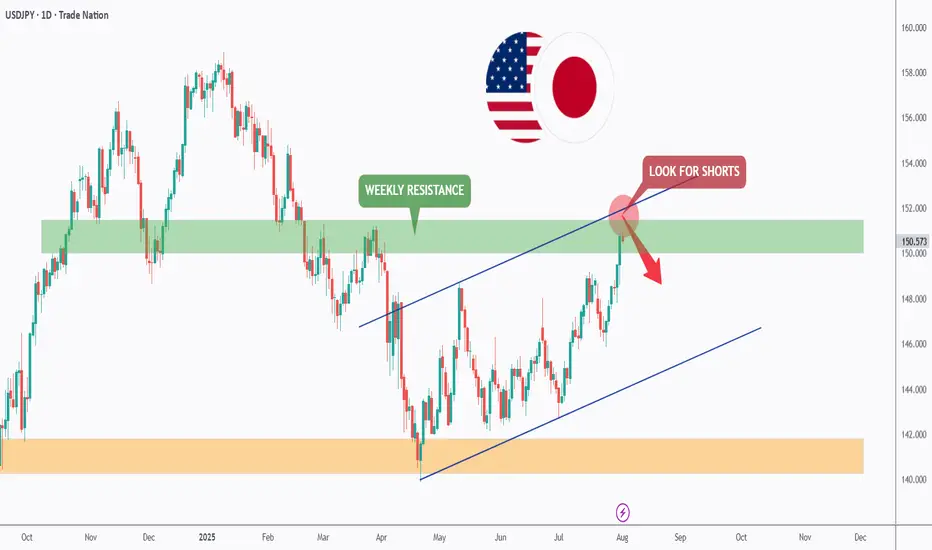
USDJPY - Now or Never!Hello TradingView Family / Fellow Traders. This is Richard, also known as theSignalyst.
📈USDJPY has been overall bullish trading within the rising channel marked in blue and it is currently retesting the upper bound of the channel acting as an over-bought zone.
Moreover, the green zone is a strong weekly resistance.
📚 As per my trading style:
As #USDJPY is around the red circle zone, I will be looking for bearish reversal setups (like a double top pattern, trendline break , and so on...)
📚 Always follow your trading plan regarding entry, risk management, and trade management.
Good luck!
All Strategies Are Good; If Managed Properly!
~Rich
Disclosure: I am part of Trade Nation's Influencer program and receive a monthly fee for using their TradingView charts in my analysis.
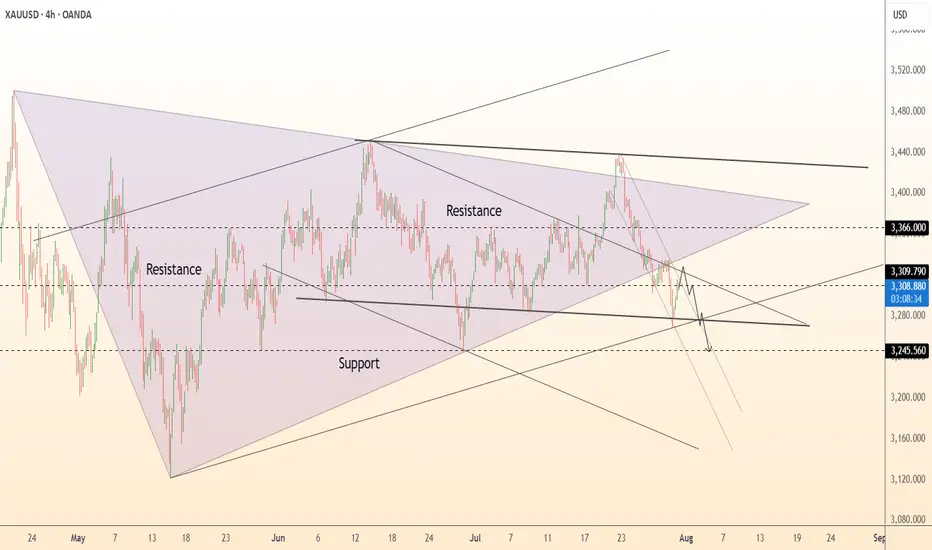
DeGRAM | GOLD fixed below the triangle📊 Technical Analysis
● XAUUSD is forming a bearish descending wedge within a broader symmetrical triangle, facing rejection at 3,310 near prior support-turned-resistance.
● Repeated failure to hold above trendlines and continued lower highs favor a drop toward the 3,246.56 level, with possible overshoot if support breaks.
💡 Fundamental Analysis
● Rising real yields and hawkish Fed tone continue to pressure gold; ISM Manufacturing Prices and NFP loom as next volatility catalysts.
● Reduced ETF inflows and strong dollar on resilient US macro data weigh on demand for non-yielding assets.
✨ Summary
Short bias below 3,310. Breakdown eyes 3,246 → 3,200 zone. Resistance holds while trendline caps recovery.
-------------------
Share your opinion in the comments and support the idea with a like. Thanks for your support!
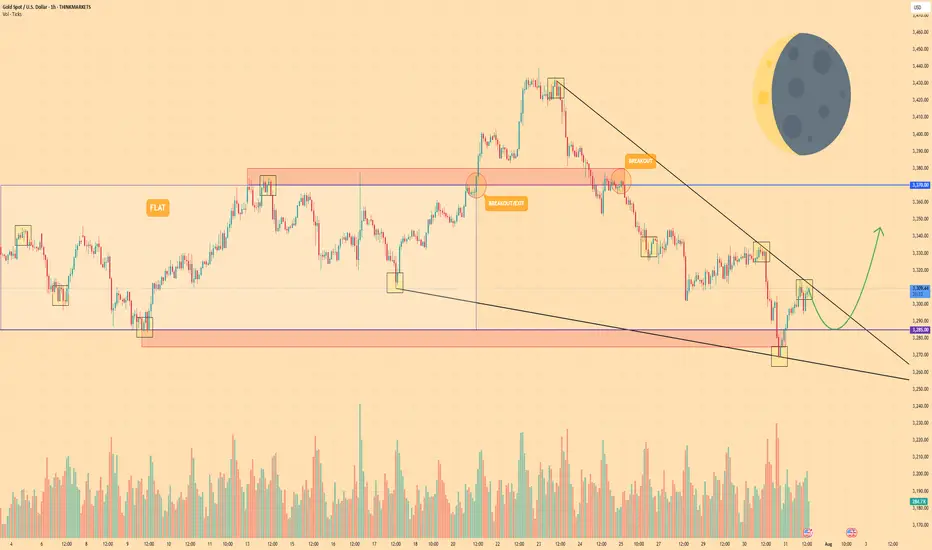
GOLD - Price can fall to support level and then start to riseHi guys, this is my overview for XAUUSD, feel free to check it and write your feedback in comments👊
The price was consolidating for an extended period inside a wide, horizontal range.
A strong bullish impulse eventually broke the price out above the resistance of that flat channel.
This breakout move created a new significant high before sellers forcefully rejected the price downwards.
This rejection marked the beginning of the current falling wedge pattern, which has guided the price lower since.
The decline within the wedge has now brought the asset down to a critical historical support zone at $3285.
I expect that this key support will hold, causing a reversal and a new rally that targets the $3345
If this post is useful to you, you can support me with like/boost and advice in comments❤️
Disclaimer: As part of ThinkMarkets’ Influencer Program, I am sponsored to share and publish their charts in my analysis.
Apple (AAPL) Shares Jump Following Earnings ReportApple (AAPL) Shares Jump Following Earnings Report
Yesterday, after the close of the regular trading session, Apple released its earnings report, which surpassed analysts’ expectations:
→ Earnings per share: actual = $1.57, forecast = $1.43;
→ Revenue: actual = $94.04 billion, forecast = $89.35 billion.
As a result, AAPL shares surged in the post-market, rising from $207.57 to $212.51.
Media Commentary:
→ The company reported a 13% year-on-year increase in iPhone sales.
→ However, according to Tim Cook, tariffs have already cost the company $800 million and this figure could exceed $1 billion in the next quarter.
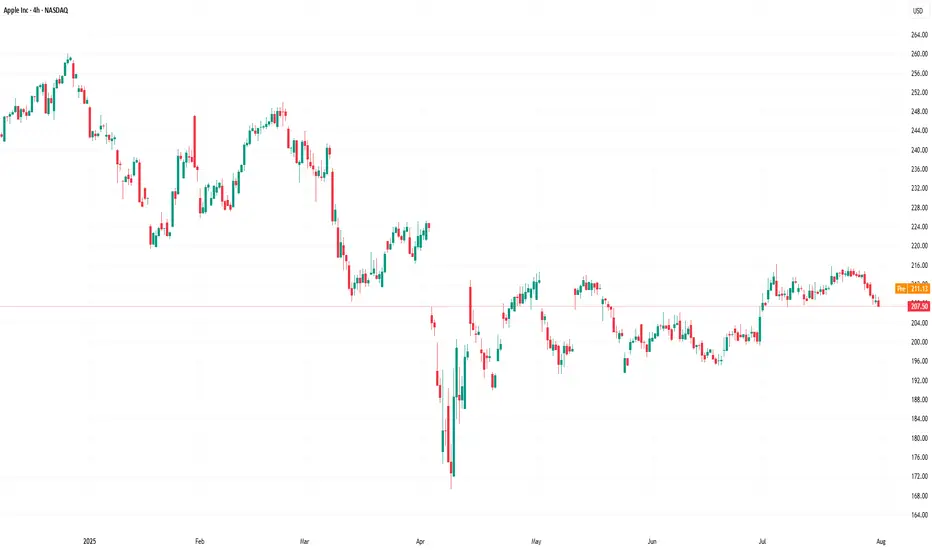
Technical Analysis of the Apple (AAPL) Stock Chart
Following the volatility in April 2025, price action has justified the construction of an ascending channel (marked in blue). The $216 level, which has acted as a key reference point since March, remains a significant resistance area, because:
→ It has consistently prevented AAPL from reaching the upper boundary of the channel;
→ Even in the wake of a strong earnings report, the price failed to break through this level in post-market trading.
If the $216 level continues to cap gains in the coming days – despite the positive report – the stock might pull back towards the median line of the blue channel (following the post-market rally). This zone often reflects a balance between supply and demand. While such a retracement would appear technically justified, it may raise concerns among shareholders, particularly when compared to the more aggressive price rallies seen in the shares of other tech giants, such as Microsoft (MSFT), as we discussed yesterday.
From a more pessimistic perspective, peak A may turn out to be yet another lower high within a broader bearish structure that has been forming on the AAPL chart since December 2024, when the stock reached its all-time high around the $260 level.
This article represents the opinion of the Companies operating under the FXOpen brand only. It is not to be construed as an offer, solicitation, or recommendation with respect to products and services provided by the Companies operating under the FXOpen brand, nor is it to be considered financial advice.
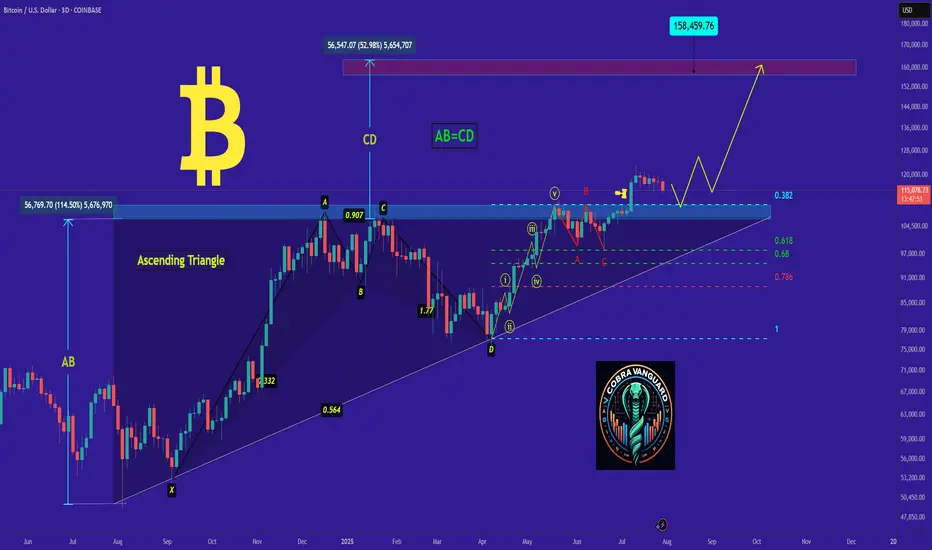
Do you think I'm joking ???As I said, Bitcoin broke the triangle, and now with a slight price correction(109k), it could surge to $150k , and you still think I'm joking!!
Previous analysis
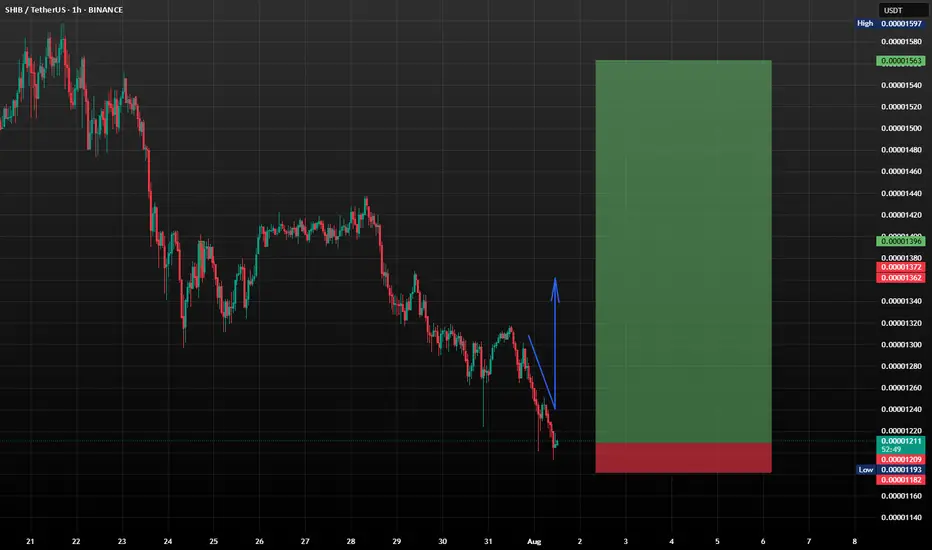
SHIB/USDT: Shiba Inu Setting Up for a Bullish Reversal?Shiba Inu (SHIB) is currently trading around $0.00001208, showing signs of stabilizing near a key support zone after a recent pullback. The market appears to be forming a rounded double bottom pattern, which could evolve into a strong W-shaped bullish reversal if confirmed with volume and breakout above short-term resistance (~$0.0000135).
This level could be pivotal for long-term accumulation.
What to Watch
*Key Support Zone: $0.00001200 - price is holding this level firmly.
*Short-Term Resistance: $0.0000135 - a breakout could confirm bullish continuation.
*Indicators: RSI is cooling off after a high, which could provide momentum for a new leg up.
SHIB may be quietly setting the stage for a powerful recovery. This support level looks like a gift for those with patience and vision. DCA smartly, monitor dips, and don’t panic, because when this pattern breaks out, you’ll wish you had loaded up earlier.
This isn't about hype...it’s about positioning. Stay disciplined. Stick to your plan. SHIB might just surprise everyone again.
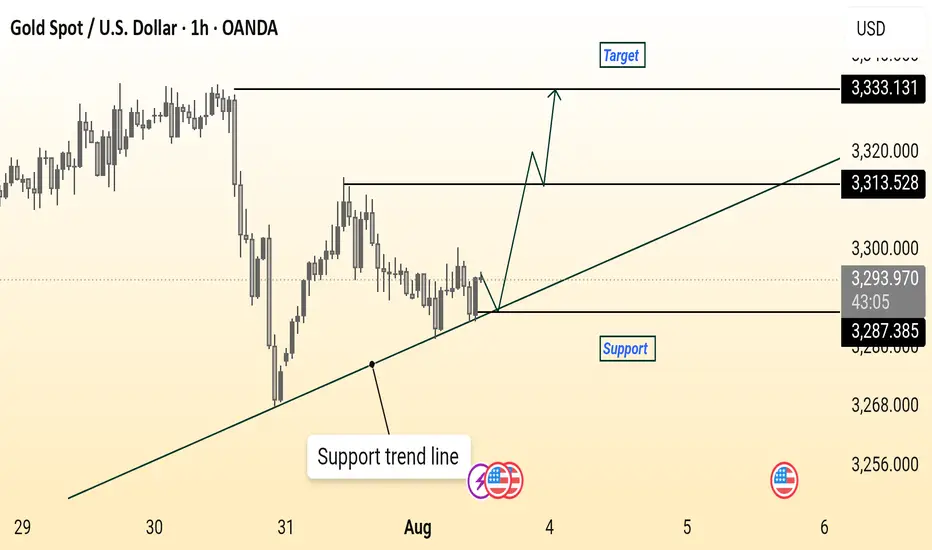
Gold (XAU/USD) 1H Chart – Trendline Support and Upside TargetGold price is trading above the support trendline around 3,287. A bounce from this level could drive price toward the 3,313 resistance and potentially the 3,333 target. Maintaining support above 3,287 is key for the bullish outlook.
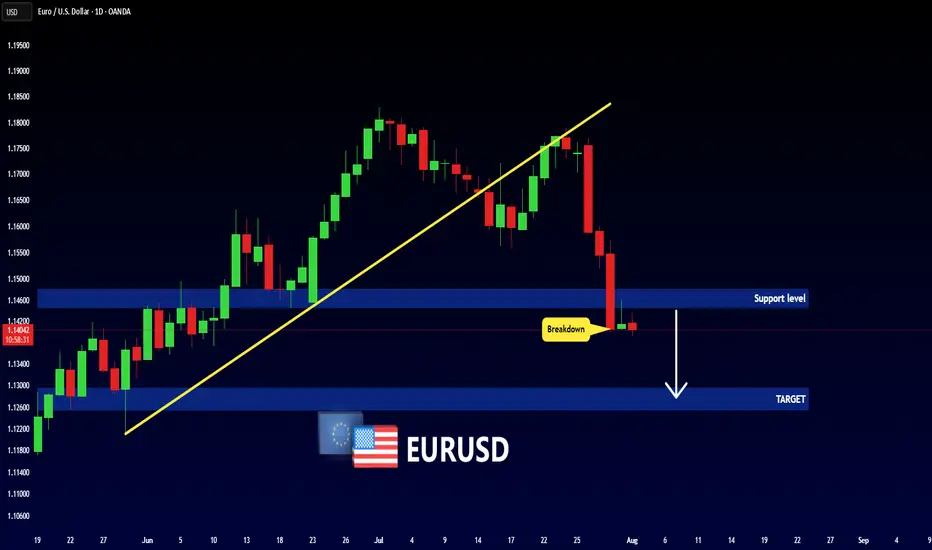
EURUSD - New Bearish Move!Hello Traders !
The EURUSD broke the support level (1.14810 - 1.14463).
This key level becomes new resistance!
So, I expect a bearish move📉
_______________
TARGET: 1.12955🎯
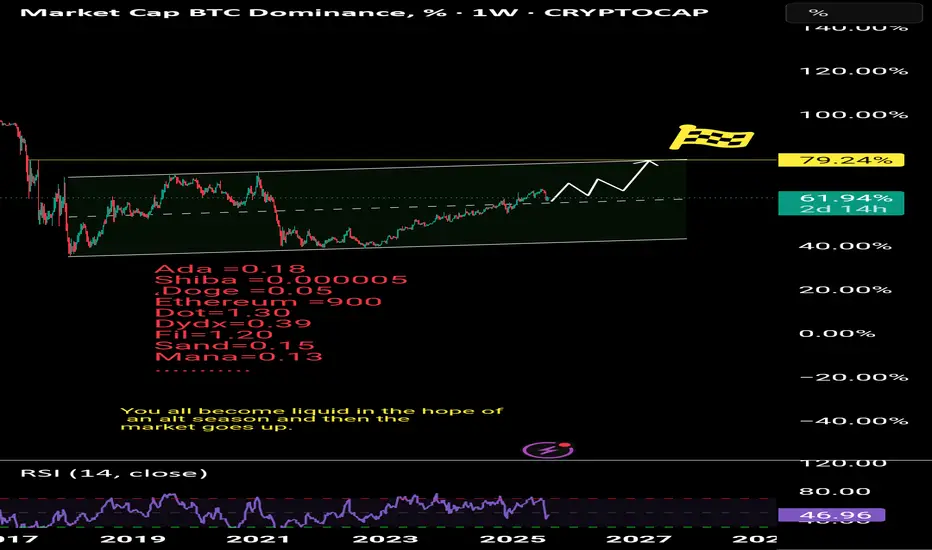
Be prepared to be liquidated.Be prepared to be liquidated.
Be prepared to be liquidated.
Ada =0.18
Shiba =0.000005
،Doge =0.05
Ethereum =900
Dot=1.30
Dydx=0.39
Fil=1.20
Sand=0.15
Mana=0.13
...........
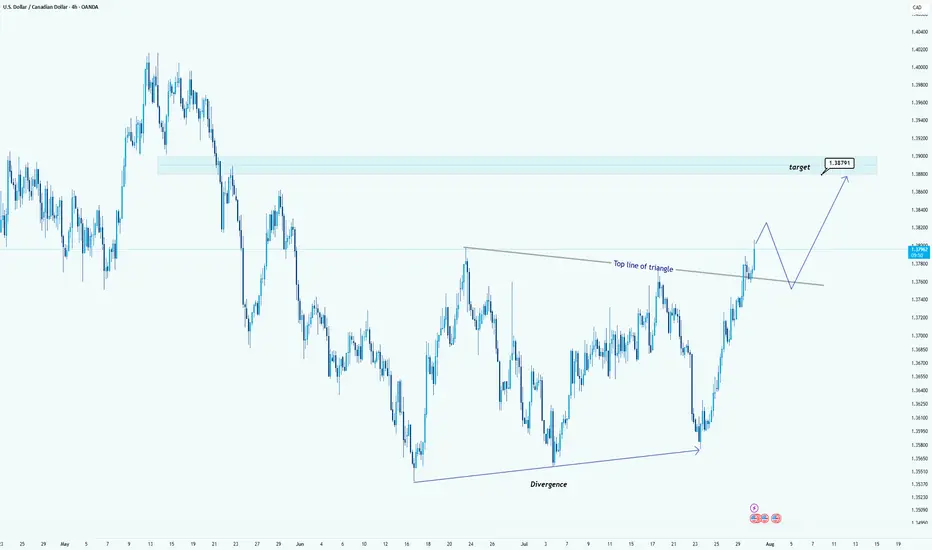
USD/CAD Breaks Triangle: Bullish Target in SightHello guys!
USD/CAD has broken out of a clear triangle formation, signaling strong bullish momentum. The breakout above the top line of the triangle, supported by earlier bullish divergence, confirms that buyers are now in control.
Triangle breakout confirmed
Strong bullish impulse post-breakout
Retest of the broken trendline expected
Target: 1.38791
A clean retest of the breakout level could provide another entry opportunity before price reaches the target zone highlighted in blue.
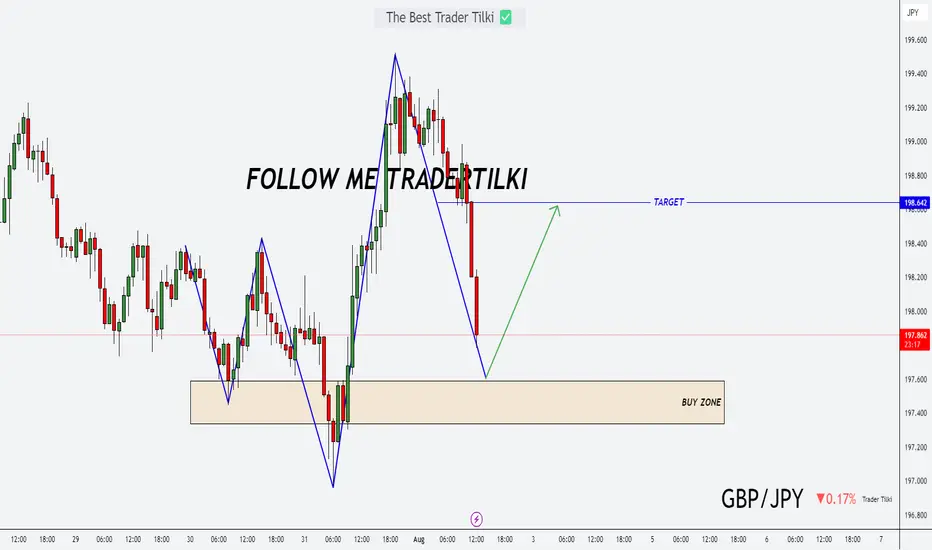
Today’s Opportunity: Stay Sharp on GBPJPY!Hey friends,
Here's my latest analysis on GBPJPY.
📌 Buy Entry Zone: 197.590 - 197.336
🎯 Target Level: 198.642
📅 Today, major economic data will be released from the U.S.
Make sure to factor this into your fundamental analysis.
📊 It’s not just about the charts—fundamentals matter too.
Technical + Fundamental = Powerful outcomes ✅
💬 Every like and bit of support keeps me going.
Thanks so much to everyone backing this journey! 🙌
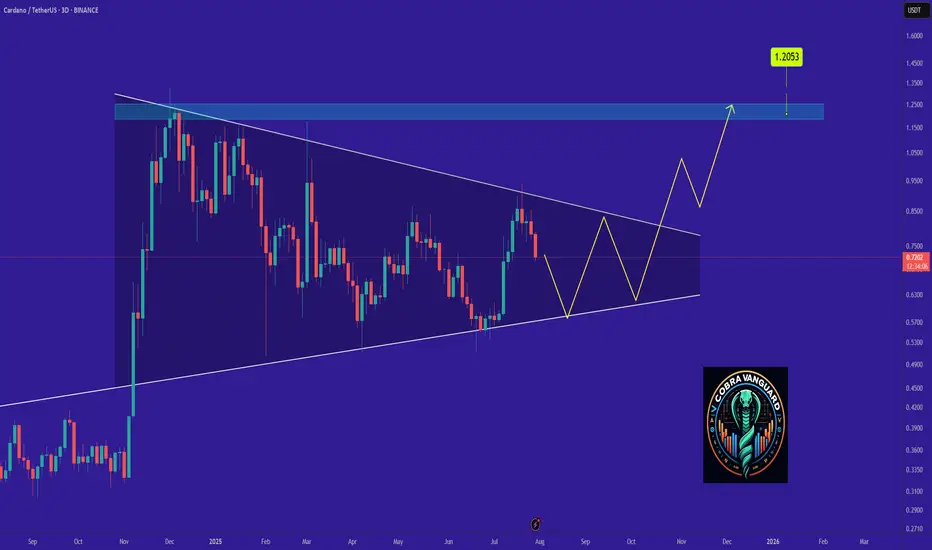
ADA Ready for PUMP or what ?The price on the 3d timeframe is within a triangle, which can create some uncertainty about which direction it will move. Here, we should wait to see which side of the triangle the price breaks out from. Remember, the trend is our friend.
Best regards CobraVanguard.💚
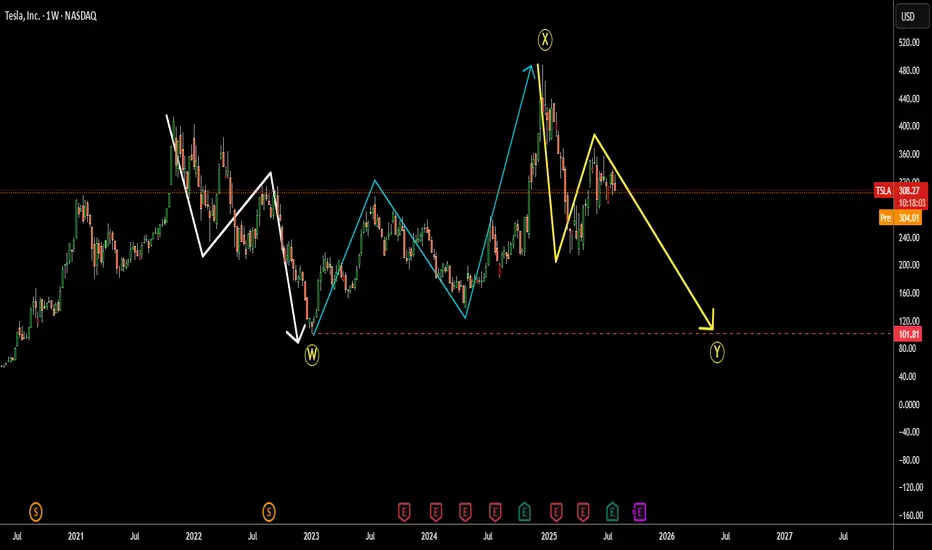
Tesla (TSLA) Crash Ahead? $101.81 Retest in SightThe Tesla price chart appears to show a large flat correction labeled W-X-Y.
Wave W consists of three downward waves from 2021 to 2023. (white)
Wave X shows a three-wave upward retracement from 2023 to 2024, which even overshot the start of wave W. (blue)
Now, we seem to be in the final leg of the third move: wave Y down. (yellow)
Typically, wave Y retests the bottom of wave W.
If that holds, we could see Tesla’s price revisit the 2023 low of $101.81.
Is Tesla losing its appeal?
I’d love to hear your thoughts.
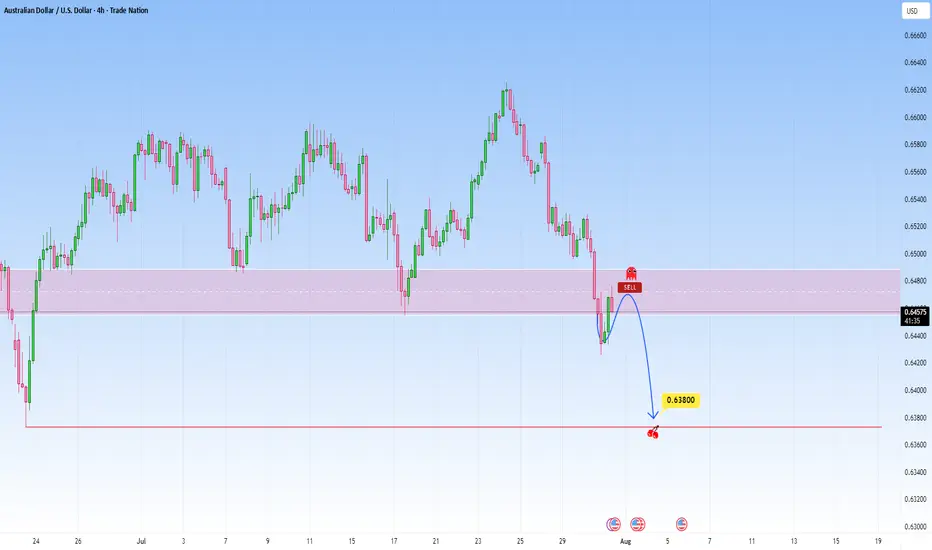
AUDUSD: Bearish Continuation from broken supportThe current setup is a clean example of a trend continuation play. Price recently broke decisively below a structure zone, this break and retest now flips the narrative, what once was a buy zone is now an opportunity for short entries.
Following the aggressive move down, price now began pulling back into that broken zone. The move appears corrective rather than impulsive, characterized by a slower, more rounded structure typical of pullback leg. This is classic behavior in continuation setups: fast drop, slow retrace, and then potential for the next leg lower.
The projected move targets a retest of the swing low at 0.63800. That level is significant, it's a level where prior demand reacted strongly and now it serves as the next probable magnet for price.
What makes this continuation trade high probability is the sharpness of the prior bearish impulse as it signals intent. The market seems to be in a controlled bearish sequence, where sellers dominate momentum and retracements offer fresh entries for trend followers.
The structure and zone alignment all point in the same direction continuation lower, not reversal.
Let me know in the comments what you think
Disclosure: I am part of Trade Nation's Influencer program and receive a monthly fee for using their TradingView charts in my analysis.
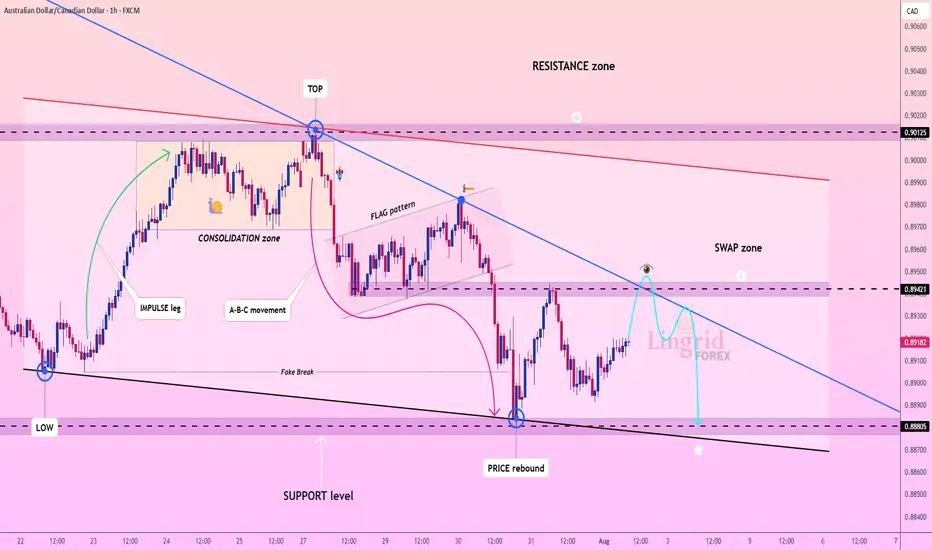
Lingrid | AUDCAD Swap Zone. Potential Selling OpportunityThe price perfectly fulfilled my last idea . FX:AUDCAD is rebounding from a strong support area after a fake break below 0.88805 and is now moving toward the descending trendline. The price is expected to test the swap zone near 0.89421, where prior support may flip to resistance. This setup favors a SELL scenario from the lower high structure within the flag and downtrend. A rejection from the trendline could resume the bearish continuation back toward support.
📌 Key Levels
Sell zone: 0.89421 – 0.89500
Buy zone: 0.88805 – 0.88600
Target: 0.88805
Invalidation: Break and close above 0.89550
💡 Risks
Bullish breakout through the descending trendline
Sharp reversal from macroeconomic news
Short-term consolidation above 0.89100 weakening momentum
If this idea resonates with you or you have your own opinion, traders, hit the comments. I’m excited to read your thoughts!
BTC: in a new drop?!Hello guys!
btc is running in a descending channel!
However, the upper level is broken up, but it could reach the upper level after a drop here!
I am not sure about this analysis!
What do you think about it?