S&P 500 Futures – Trendline Breach + AI Forecast Signals Major C📉 S&P 500 Futures – Trendline Breach + AI Forecast Signals Major Correction
VolanX Risk Engine Flags High Probability Downside
🧠 Narrative:
Markets have enjoyed a powerful uptrend off the March lows, but the structure is showing signs of exhaustion.
The ascending trendline—untouched for over two months—has now been breached.
Fibonacci levels cluster below current price, with critical demand at:
6319.25 (immediate test zone)
6179.25 (0.618 retrace)
5964.75 (macro support / VolanX institutional target)
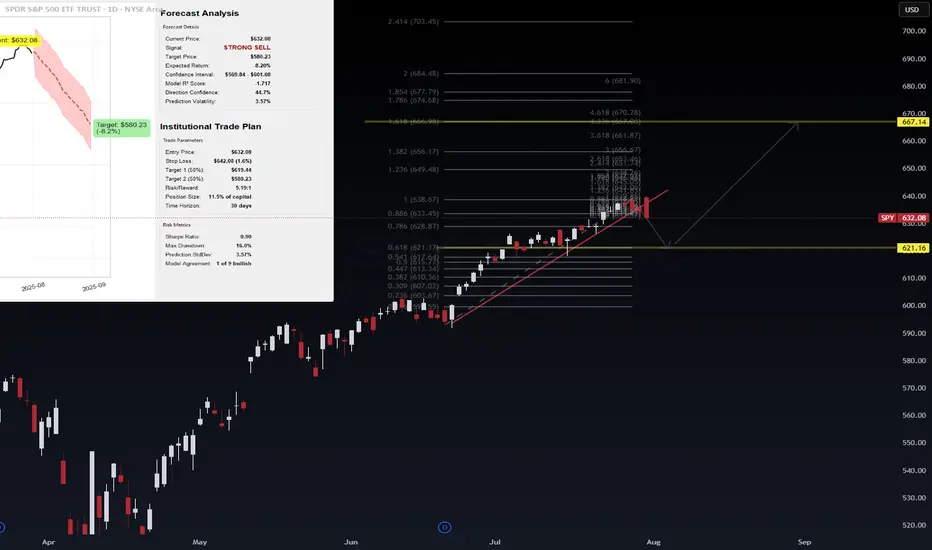
Meanwhile, VolanX Protocol's predictive engine has shifted to a "Strong Sell" with a projected correction path clearly outlined. The 30-day price forecast (shown in red) leans toward a mean reversion toward 5842.12 by late August.
📊 Institutional Trade Plan (VolanX DSS):
Entry Zone: 6360-6380 (Confirmed breakdown retest)
Target 1: 6179.25
Target 2: 5964.75
Final Target: 5842.12
Invalidation: Close above 6480 (new highs with strength)
🔎 Risk/Reward: 3.4+
📈 Trend Deviation: 7.4%
📉 Bearish Conviction: 84.1%
📌 Key Insights:
Breakdown below trendline confirms shift in control to bears
Institutional models anticipate volatility-led selloff
Major liquidity rests below 6200 and 5960 zones
This is not the time to chase highs—risk is asymmetric
🔮 VolanX Opinion:
“Volatility expansion is near. Institutional capital is likely rotating out of risk. The squeeze has passed; now the trapdoor may open.”
This is where preparation outperforms prediction. Execute with risk logic, not emotion.
📚 #SNP500 #ESFutures #SPX #MacroTrading #SmartMoney #InstitutionalFlow #TrendReversal #Volatility #LiquiditySweep #FibonacciLevels #VolanX #AITrading #EminiFutures #WaverVanir #QuantStrategy #TechnicalAnalysis #Forecast #TradingView
Community ideas
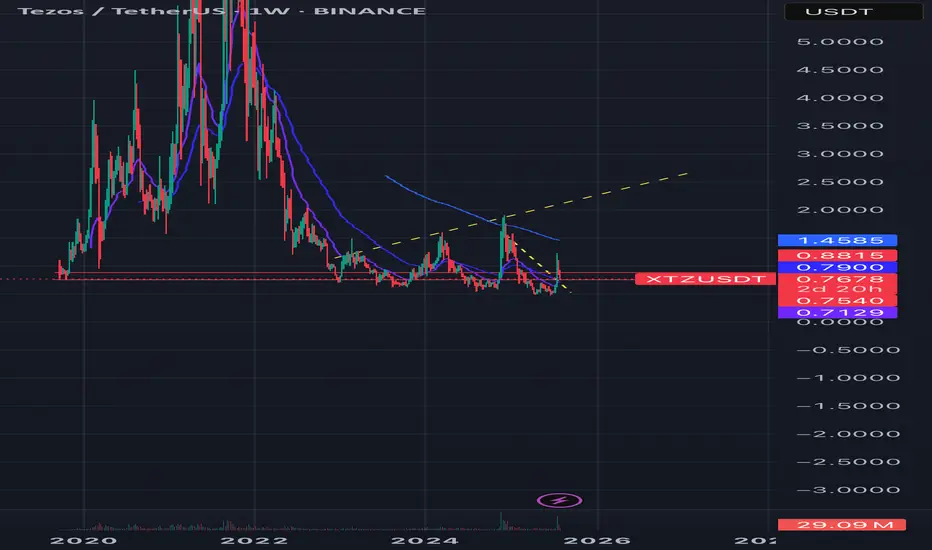
Xtz historic supportXTZ is at a historic support level here where it has consistently respected as support or resistance after recently busting over it and on higher volume seen in a long time. I’m optimistic.
Most tied up in staking it seems ~77%, so moves could happen quickly, as seen previously.
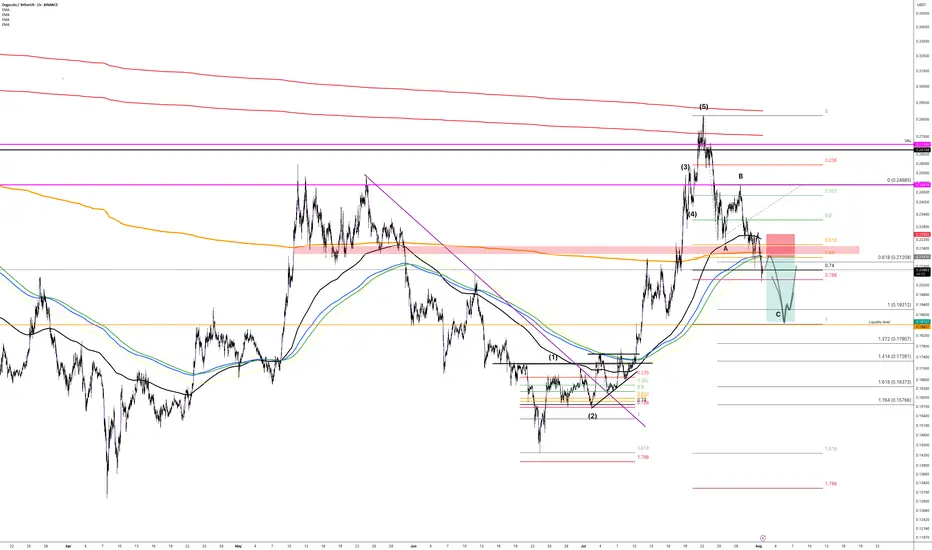
DOGE (Y25.P3.E1). More lows to come before a longHi traders,
My thoughts on taking a short trade on Doge
why?
confluence on … 200 D ema, Avwap , previous support, etc
All the best,
S.SAri.
BTCUSD looking for corrective drop towards $111K!1). "Indecisive" weekly Doji retail candle! 2). Price rejection off higher times! 3). Risk indicator is heading south! 4). Trump said "BUY!" 5). There appears to be a cluster of "BUY" orders around $114$K as typically, price drops to trigger those orders!
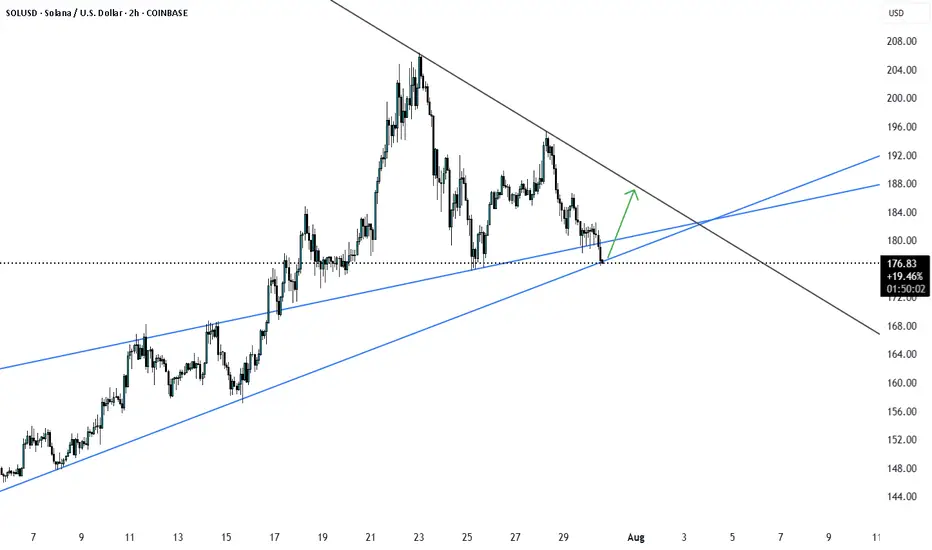
SOLUSD at Major support SOLUSD has reached major support from here we may see a good pullback. Let us see how it plays out.
Chainlink (LINKUSDT) has shown strong bullish momentumKey Points
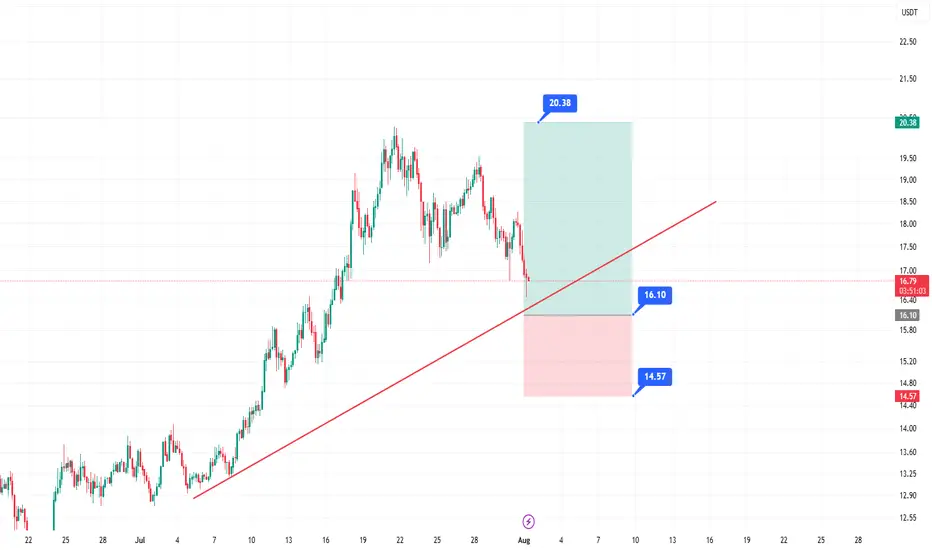
It seems likely that a long entry for LINKUSDT at $15.70–$16.10 using a limit order is a valid strategy, given recent bullish trends and technical support levels.
The take profit at $20.38 and stop loss at $14.57 suggest a favorable risk-reward ratio, but market volatility could affect outcomes.
Research suggests waiting for a pullback to the entry range, as the current price ($16.86) is slightly above it.
Market Context
Chainlink (LINKUSDT) has shown strong bullish momentum, rallying from $11.45 to $19.66 earlier in 2025, and is currently consolidating. The $15.70–$16.10 entry range aligns with key technical levels, including a 0.618 Fibonacci retracement and the 20-period EMA on the 4H chart, making it a potential support zone for a long entry.
Trade Plan
Entry: Use a limit order between $15.70 and $16.10, splitting entries for better average price.
Take Profit: Aim for $20.38, offering a significant upside potential.
Stop Loss: Set at $14.57 to manage risk, ensuring a clear invalidation level.
Risk Management: Risk 1–2% of your account, adjusting position size based on the stop distance.
Considerations
Given the current price is $16.86, you may need to wait for a pullback to enter at the desired range. Monitor Bitcoin’s price action, as it can influence altcoins like LINKUSDT. Always do your own research, as crypto markets are highly volatile.
Survey Note: Detailed Analysis of LINKUSDT Long Entry Strategy
This survey note provides a comprehensive analysis of the proposed LINKUSDT long entry strategy, incorporating your specified parameters (entry at $15.70–$16.10, take profit at $20.38, and stop loss at $14.57) and recent market data as of 09:31 AM +0530 on Friday, August 01, 2025. The goal is to create a detailed trading idea suitable for publishing on TradingView, with technical analysis, risk management, and community engagement considerations.
Market Overview and Recent Price Action
Chainlink (LINKUSDT) has demonstrated significant bullish momentum throughout 2025, breaking out of a multi-month descending channel and rallying from a low of $11.45 to a high of $19.66. As of today, the current price is $16.86 USD, based on the most reliable price data available. This price reflects a pullback from recent highs, suggesting a consolidation phase after a 58% rally, which is typical for healthy trend continuation.
Recent analyses on TradingView and X posts indicate a bullish outlook, with several traders targeting levels above $20, supported by strong fundamentals such as Chainlink’s role as a leading DeFi oracle. For instance, an X post from @cryptoolivee on July 29, 2025, suggested that if $17 holds, targets could reach $22.50–$30.60, while another from @Solfishsoul highlighted a descending wedge breakout with a potential target above $20, backed by RSI crossing 50 and volume spikes.
However, the current price of $16.86 is slightly above your proposed entry range of $15.70–$16.10, which may require waiting for a pullback or adjusting the strategy. Given Bitcoin’s price above $95,000, altcoin strength is supported, but monitor BTC dominance for potential impacts on LINKUSDT.
Technical Analysis
To justify the entry range and targets, let’s break down the technical setup:
Price Action and Structure:
On the 4H and 1D charts, LINKUSDT is forming higher highs and higher lows, confirming a bullish trend. The pullback to $15.70–$16.10 aligns with:
A 0.618 Fibonacci retracement level from the $11.45 low to $19.66 high, a common reversal zone.
A previous resistance-turned-support zone around $16.00, based on historical price action.
The 20-period EMA on the 4H chart, acting as dynamic support, which recent analyses on TradingView confirm as a key level.
Key Levels:
Support Zone: $15.70–$16.10, with stacked confluence from Fib, prior structure, and EMA.
Resistance Targets:
T1: $17.50 (recent consolidation low, +9% from entry).
T2: $19.80 (prior high, +23% from entry).
T3: $21.00 (channel breakout target, +31% from entry).
Your specified take profit at $20.38 fits within this bullish range, offering a significant upside potential.
Invalidation: A 4H close below $15.20 signals a potential trend reversal, but your stop loss at $14.57 provides a wider buffer, which is prudent given crypto volatility.
Indicators:
RSI (4H): Currently at 58, indicating bullish momentum without being overbought, with room for upside before reaching 70.
Volume: Recent breakouts ($15–$17 and $19) showed increasing volume, suggesting strong buying interest. The current pullback shows lower volume, typical of a healthy retracement, as noted in TradingView analyses.
MACD (4H): Bullish crossover intact, with the histogram showing slight weakening but no bearish divergence, supporting the setup.
Market Context and Sentiment:
TradingView’s technical ratings as of today show a neutral signal, but a buy signal for 1 week and a strong buy for 1 month, aligning with the bullish sentiment. Volatility is 3.28% today, with a 24-hour change of -0.11%, -2.70% for 1 week, but +32.31% for 1 month and +32.37% for 1 year, indicating strong longer-term momentum.
X posts, such as one from @Arvintd on July 25, 2025, suggest long entries at $17.150–$17.600 with targets up to $19.650, slightly above your range but supportive of bullish moves. Another from @2gentledude echoed similar levels, using 50x leverage, though caution is advised for such high leverage.
Trade Plan and Execution
Given your parameters, here’s how to structure the trade for TradingView publication:
Setup: Long LINKUSDT with a limit order in the $15.70–$16.10 range.
Entry Zone: Place limit orders between $15.70 and $16.10, splitting entries for better average price to manage slippage.
Take Profit Targets:
Your specified TP at $20.38 can be the primary target, offering a significant upside. For scaling, consider:
T1: $17.50 (50% position, R:R 2.5:1).
T2: $19.80 (30% position, R:R 5:1).
T3: $21.00 (20% position, R:R 6.5:1), given the bullish targets in analyses.
Stop Loss: Set at $14.57, as specified, which is below the $15.20 invalidation level, providing a wider buffer for volatility.
Risk Management:
Risk 1–2% of your account per trade, adjusting position size based on the stop distance (from $15.90 average entry to $14.57 SL, ~8.5% risk, so size accordingly).
Use spot or low leverage (3–5x) to manage risk, as futures trading amplifies losses, especially given recent X posts suggesting 50x leverage, which is high risk.
Trade Duration: Expected 3–10 days, depending on momentum and BTC price action.
Execution Notes:
Wait for price to enter the $15.70–$16.10 zone and show bullish confirmation, such as a 1H bullish candle, RSI bounce, or volume increase, to ensure entry at support.
Avoid chasing if price breaks above $16.50 without testing the entry zone, as it may indicate a stronger upward move bypassing your range.
Risk Assessment and Considerations
Crypto markets are highly volatile, and several factors could impact this setup:
A Bitcoin drop could drag LINK below $15.20, potentially hitting your SL at $14.57. Monitor BTC dominance and LINK/BTC pair for correlations.
False breakouts are possible; if $15.70 fails to hold, price may test lower supports like $14.00–$14.20, as noted in some TradingView analyses.
Given the current price of $16.86, you may need to wait for a pullback, which could take time or not occur, adding uncertainty. Adjust expectations if the market continues upward.
Community Engagement and Publishing Notes
To maximize engagement on TradingView:
Chart Setup: Attach a 4H or 1D chart with:
Marked entry zone ($15.70–$16.10).
Fibonacci retracement levels (0.618 at ~$16.00).
20 EMA on 4H.
Support/resistance zones ($17.50, $19.80, $21.00).
Stop loss level ($14.57, as specified).
Tags: #LINKUSDT #Chainlink #CryptoTrading #BullishSetup #TechnicalAnalysis #Altcoins
Visibility: Set to public for maximum reach.
Engagement: Encourage comments, such as “What’s your take on LINKUSDT? Are you bullish or waiting for a deeper dip? Drop a comment below, and let’s discuss!” and respond to feedback to build credibility.
Summary Table of Key Levels and Targets
Level/Type
Price (USD)
Description
Entry Range
15.70–16.10
Limit order zone, Fib and EMA support
Take Profit (TP)
20.38
Primary target, aligns with bullish targets
Stop Loss (SL)
14.57
Wide buffer below invalidation at $15.20
Support Levels
14.00–14.20
Potential lower test if entry fails
Resistance Targets
17.50, 19.80, 21.00
Scaling targets for partial profits
This table summarizes the critical levels for your trade, ensuring clarity for TradingView readers.
Disclaimer and Final Notes
Trading cryptocurrencies involves high risk, and you may lose more than your initial capital. Always use proper risk management and consult your financial advisor before trading. This idea is based on available data and analyses but is not financial advice—do your own research (DYOR).
Given the current price of $16.86, this setup may require patience for a pullback, but the technical confluence and bullish sentiment support its validity. Adjust as needed based on market developments.
Key Citations
Chainlink/Tether Price Chart Analysis
Recent LINKUSDT Trade Ideas
Chainlink Price and Chart Data
LINKUSDT Trading Idea from Arvintd
LINKUSDT Monthly Analysis from cryptoolivee
LINKUSDT Breakout Analysis from Solfishsoul
LINKUSDT Long Idea from 2gentledude
ETHUSDT.PIf you look at the chart, you will notice an uptrend that has somewhat lost its strength and we may not be able to hit higher highs like the next strength in the next move.
Support: 3.660 - 3.590 - 3.160
Resistance: 3.900 - 4.260
Entry: 3.700
SL: 3.500
TP: 4.240
Please control risk management.⚠️

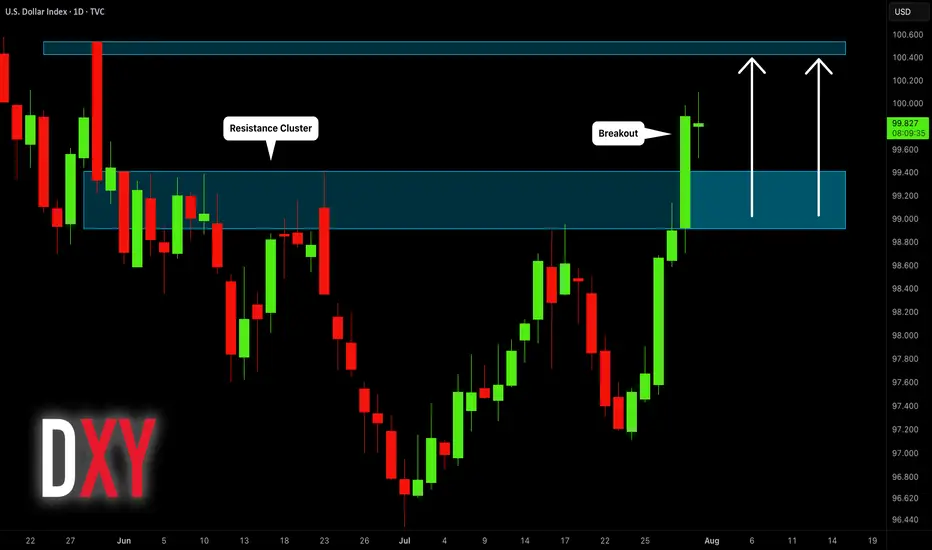
Dollar Index (DXY): Will It Rise More?!
Dollar Index is on its way to 100.4 resistance.
A breakout of a major supply cluster on a daily after FED meeting
yesterday indicates a strong bullish pressure.
I think that growth will continue soon.
❤️Please, support my work with like, thank you!❤️
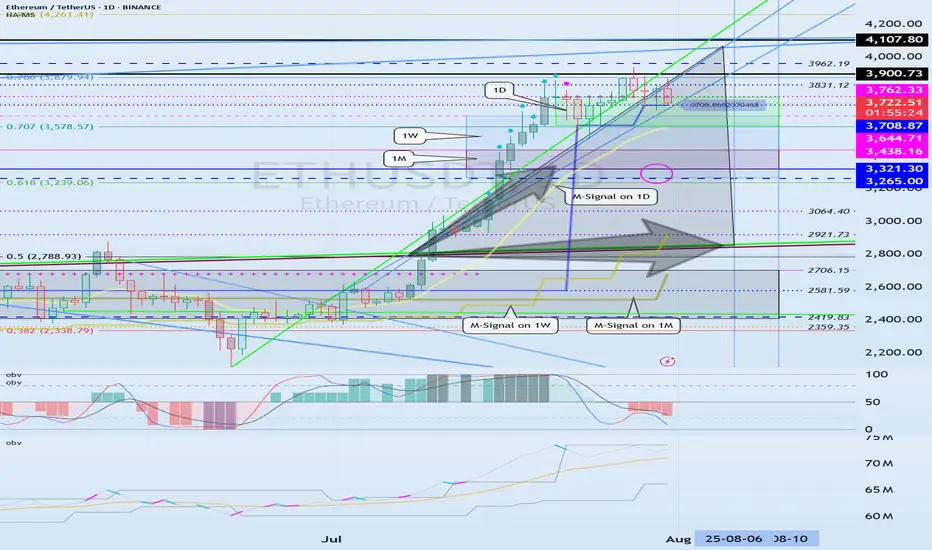
The key point to watch is whether it can rise to 3900.73-4107.80
Hello, traders. Nice to meet you.
If you "Follow," you'll always get the latest information quickly.
Have a great day.
-------------------------------------
(ETHUSDT 1D Chart)
The upward trend continues, with the M-Signal on the 1D chart > M-Signal on the 1W chart > M-Signal on the 1M chart.
Therefore, if the price holds above 3265.0-3321.30, a medium- to long-term uptrend is likely.
Currently, the HA-High ~ DOM(60) range is formed across the 3265.0-3762.33 range on the 1M, 1W, and 1D charts.
Therefore, the key question is whether support is found within the 3265.0-3762.33 range.
-
While the price is trending upward along the short-term trendline, if it falls below the short-term trendline and encounters resistance by falling below the M-Signal indicator on the 1D chart, a decline to the 3265.0-3321.30 range is likely.
ETH's volatility period is expected to last from August 6th to 10th.
The key point to watch is whether it can rise above the 3900.73-4107.80 range after this volatility period.
-
Since the StochRSI indicator has entered an oversold zone, the downside is likely to be limited.
Since the OBV indicator of the Low Line ~ High Line channel remains OBV > OBVEMA, a significant decline is unlikely.
However, since the TC (Trend Check) indicator is below zero, selling pressure is dominant.
Therefore, a decline below 3708.87 could lead to further declines. However, as previously mentioned, the decline is likely to be limited, so a significant decline is not expected.
Once the M-Signal indicator on the 1D chart is encountered, the trend is expected to re-establish itself.
-
Thank you for reading to the end.
I wish you successful trading.
--------------------------------------------------
- This is an explanation of the big picture.
(3-year bull market, 1-year bear market pattern)
I will explain in more detail when the bear market begins.
------------------------------------------------------
The Low Is In: Why the S&P 500 Just Confirmed a Bullish Reversal🔥 The Low Is In: Why the S&P 500 Just Confirmed a Major Bullish Reversal 🔥
The market just gave us a gift.
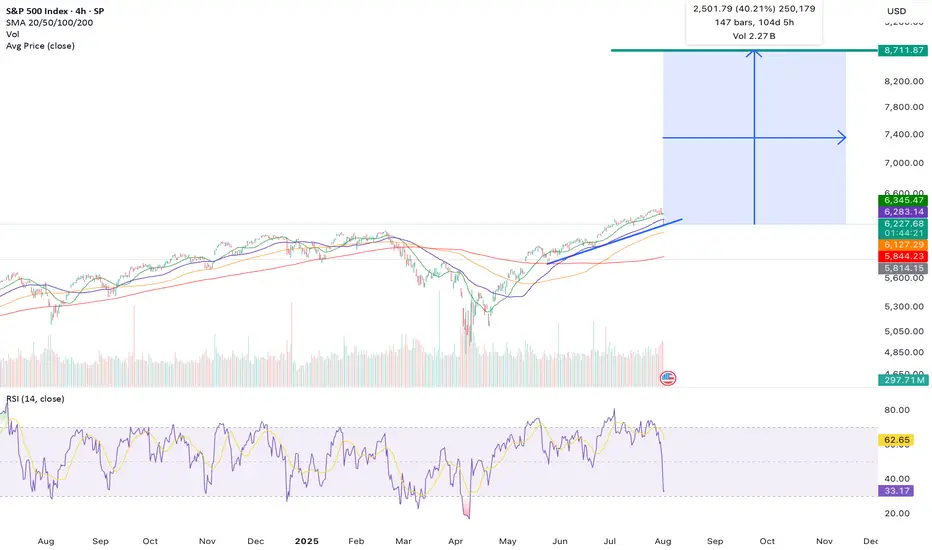
After weeks of drifting lower and sentiment turning cautious, the S&P 500 has touched — and bounced — off a critical rising trendline for the third time since May 2025. That third touch isn't just a technical coincidence… it's often the launchpad for a new impulsive leg higher.
📈 The Power of the 3rd Touch: Trendline Validation Complete
Look at the chart. This isn’t guesswork. Since May, the S&P 500 has been respecting a well-defined ascending trendline, one that connects multiple higher lows during this bull run.
The first touch was the May liftoff after the April consolidation.
The second came in June — a clean retest and bounce.
Now, as of early August, the third touch has held once again, exactly where the bulls needed it most.
This isn’t a random line on a chart. This is institutional flow stepping in to defend structure.
And when a rising trendline holds for a third time after a strong uptrend? That’s a classic continuation signal.
📉 RSI Washout + Structural Support = Perfect Storm for a Bottom
The RSI printed a dramatic dip to ~32, a level that screams “oversold” on the 4-hour timeframe. But notice the context — it happened right at structural support.
This is not weakness. This is accumulation.
Big players shake out weak hands on low timeframes… right before they send it.
🧠 Sentiment Is Offside… Again
Let’s not forget: this retrace came after a huge run-up since March. People expected a deeper correction. Bears started getting loud again.
That’s how bull markets trap you — by convincing you it’s over right before the next leg higher.
And with macro tailwinds (liquidity expansion, fiscal spend, tariff rollbacks), earnings season beats, and global capital rotation into U.S. equities, this setup is ripe for a violent upside squeeze.
🚀 8,700 in Sight: My End-of-Year Price Target Is Very Much in Play
Today’s close around 6,220 means the S&P 500 would need to rally ~40% to hit my target of 8,700 by year-end.
Sounds crazy? Not if you’ve seen what happens during parabolic melt-ups.
This isn’t just hope:
📊 Strong breadth under the surface
🏛️ Dovish policy pivot now expected in Q4
💸 Retail and institutional capital both re-engaging
📉 Bond yields are starting to roll over, supporting equity valuations
When bull markets enter their euphoria phase, they don’t stop at “reasonable” targets. They blast through them.
💡 The Setup Is Textbook — Now It’s About Execution
✅ Trendline defended
✅ RSI reset
✅ Sentiment shaken out
✅ Structure intact
The technicals just aligned with the macro. The low is in — and the runway to 8,700 is wide open.
Strap in. Q4 could be one for the history books.
S&P 500 ETF & Index Hit Resistance – A Technical Warning Shot 📉⚠️ S&P 500 ETF & Index Hit Resistance – A Technical Warning Shot 🔍🧠
Following up on the video I just posted , I had to share this updated chart of the VOO ETF (Vanguard S&P 500) and US500 Index , now that both are testing key resistance levels.
On the left: AMEX:VOO has reached the very top of a multi-year ascending channel—a zone that has historically triggered sharp corrections. The level at 590.85 marks a major resistance zone.
On the right: The US500 Index is showing a similar technical overextension, trading just under 6,450, with 5,928.25 as the nearest support below.
🎯 Technicals at play:
VOO could retrace toward 526.17 and potentially 465.72, both of which are solid technical supports within this channel.
This setup doesn't mean panic—but it does argue for caution, especially after such an extended run.
🧠 And yes, the Buffett Indicator (Stocks-to-GDP) continues to point toward an overheated market . While it's not a timing tool, it adds macro weight to the technical signals.
In the video, I also touched on:
Taking profits on NASDAQ:NVDA after a near-perfect technical rejection at target.
Reviewing Rolls Royce nearing upper channel resistance.
Gold and Silver at inflection points—likely to be impacted if equities begin to unwind.
Rotational potential into Bitcoin and Ethereum, which may benefit from macro shifts.
This is how I trade: respect structure, stay proactive, and prepare before the move—not after. Let me know how you’re positioning or if you’re sitting on hands waiting for a dip.
One Love,
The FX PROFESSOR 💙
Disclosure: I am happy to be part of the Trade Nation's Influencer program and receive a monthly fee for using their TradingView charts in my analysis. Awesome broker, where the trader really comes first! 🌟🤝📈

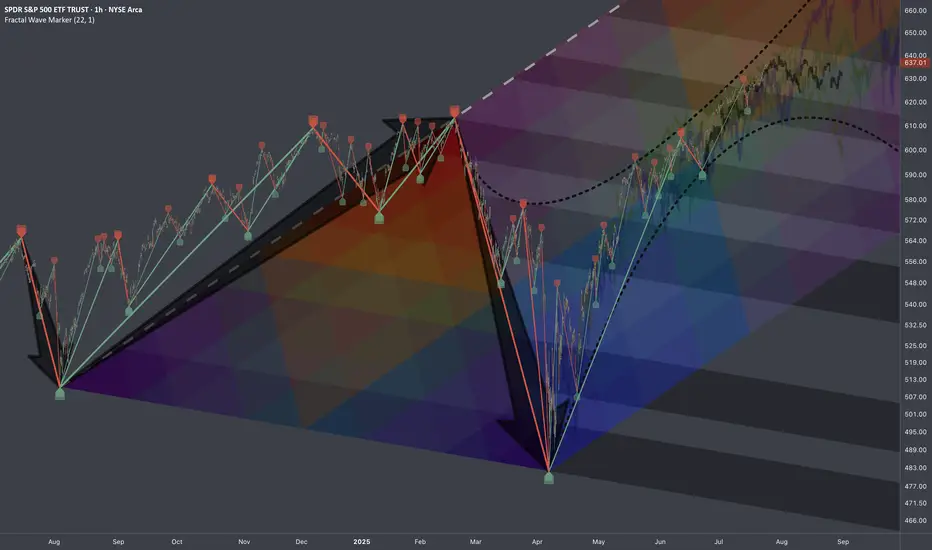
$SPY: Mapping Scenarios🏛️ Research Notes
Fractal Corridors
Shows recursive formations which indicates a full fractal cycle.
The angles of decline are parallel which is important for potential buildup.
To map a cycle we'd need to apply fib channel to the opposite direction In a way this should be sufficient to cover the scenarios of nearest future if we were to use bar patterns to validate a structure.
These are examples of historic progressions with similar growth patterns (composite sub-cycles):
This explains most elements present in interactive chart.
Natural Gas Bullish Reversal...Are the Lows in?U.S. natural gas inventories increased by 48 billion cubic feet last week to 3,123 Bcf, increasing the surplus over the five-year average.
Consensus / forecast was 37Billion Cubic feet.
Despite a much higher build than expected Nat gas saw positive price action.
This appears to simply be a dead cat bounce before we go lower.
A death cross on the daily chart has occurred. This signal often results in a small bounce before going lower.

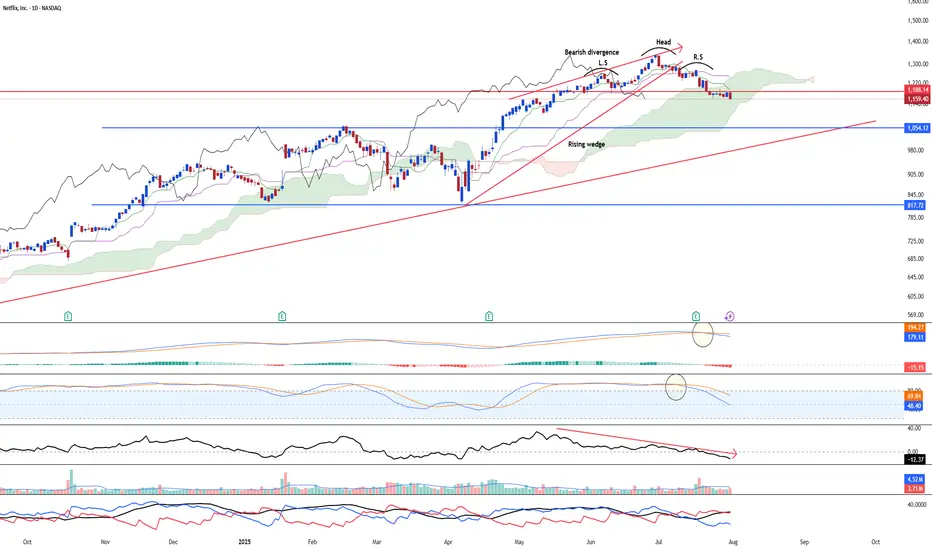
Turning the side for NetflixNetflix NASDAQ:NFLX may go through some serious correction soon after the stock rallied a lot till the high of 1337. Furthermore, the stock has confirmed the head and shoulder reversal with the latest bearish candle rejecting the neckline resistance @ 1188.14. Furthermore, the bearish divergence has been on since 19 May 2025.
Long-term MACD has performed a bearish crossover at the top and histogram is negative.
Stochastic Oscillator has confirmed the overbought signal.
23-period ROC turns negative and forms a bearish divergence. Directional movement index saw increased bearish trend strength signal.
Target is at 1054 in the near-term
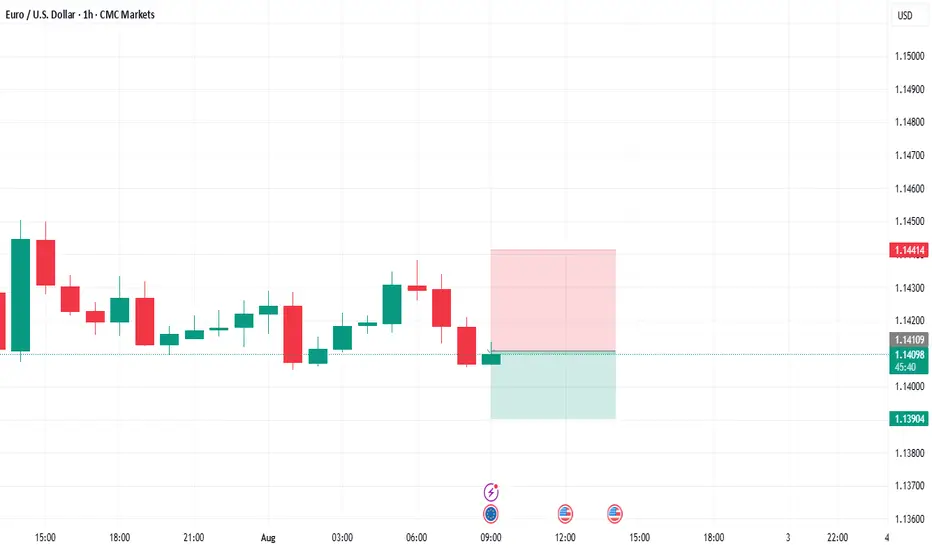
eurusd Short position sell 20 to 30 pips Eur usd short position sell 20 to 30 pips .
If you want to learn this analysis system free free contrect with me .
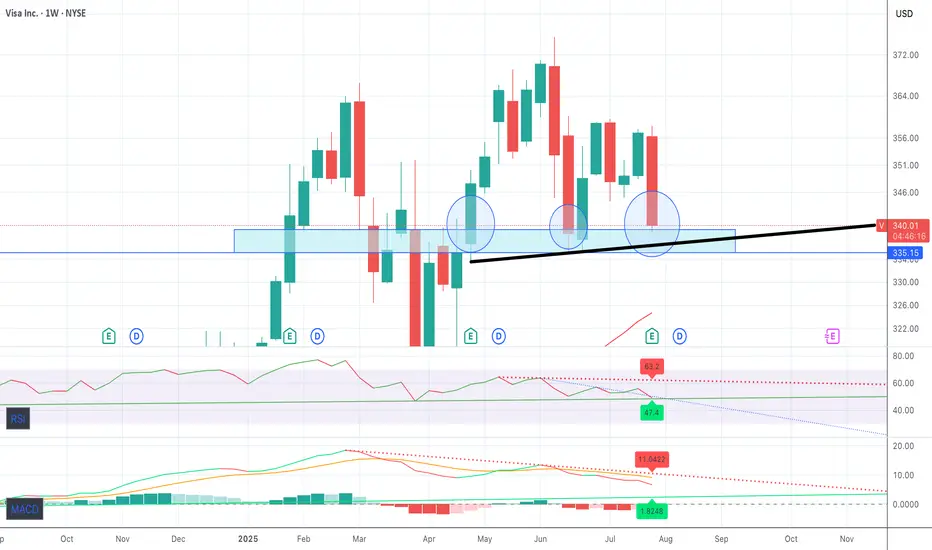
Visa UpsideWe're approaching what I believe is max pain at $435 after impressive earnings from Visa. I think the upside is very much on here
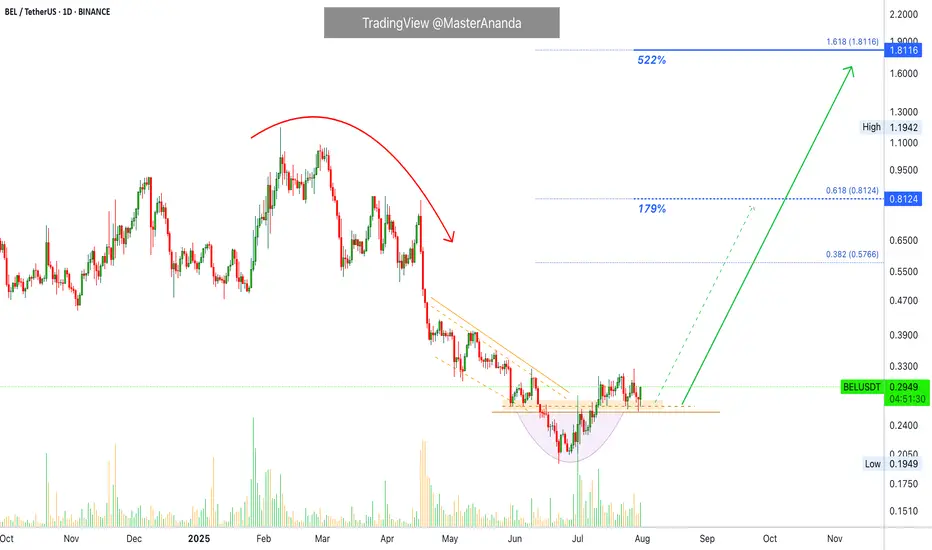
Bella Protocol 522% Easy Profits PotentialWe are going to be looking at many charts together every single day. We will go through all the altcoins basically. I am starting with some of those from the last period that didn't move. The charts look good but they filed to break their May high. These pairs are now ready to move before the rest of the market.
Here we have BELUSDT. A nice rounded bottom to end the downtrend. A small bullish recovery supported by high volume.
We have a perfect set of reversal signals and today a full green candle. This candle confirms those signals and opens up the chance of a strong advance. If the action starts now, you can be looking at the start of a major 2-3 months long move.
There will be some stops along the way but the action should be bullish nonetheless, higher highs and higher lows.
Strategy
In this setup we simply buy spot, no stop-loss. After buying we wait for as long as it is needed for prices to rise. Normally within 2-3 weeks, can be just a few days, but sometimes the wait can extend to 1-2 months. It varies. We are always prepared and ready to wait six full months, so if anything happens before this time horizon, even better but be ready to wait.
Even if you were to sell your current pair to buy a new one, the new one also requires waiting. We tend to sell wanting to find something that is moving but the moment we sell, we are faced with the same problem; even if the pair you chose is moving you have to wait for the bullish wave to develop. Even if prices rise 5% daily it would still take 20 days for a 100% price increase. 40 days for 200%. Etc. Patience is key.
So, simply, buy and hold. The market will take care of the rest.
Namaste.
Gold Price Outlook: Bearish Trend DevelopingGold has broken below key top resistance, indicating potential for continued downside movement.
The US Dollar's recent rise has slowed amid renewed concerns about the US-China trade truce and profit-taking ahead of this week’s key employment data, following already strong GDP and ADP reports. While the dollar remains supported overall, uncertainty is capping its momentum, indirectly adding short-term volatility to gold.
The price action suggests a bearish breakout from key resistance zones. Momentum is building toward the downside, indicating the market could continue lower unless strong support levels hold. A potential bearish flag or breakdown structure is forming, and if confirmed, we may see a decline toward next support zones.
📍 Key Levels to Watch:
Resistance: 3310 / 3320
Support: 3269 / 3240
If gold remains below the broken resistance and fails to reclaim 3320, the bearish pressure is likely to continue. Watch upcoming employment data as it could add volatility and confirm the direction.
You may find more details in the chart.
Ps: Support with like and comments for better analysis Thanks.

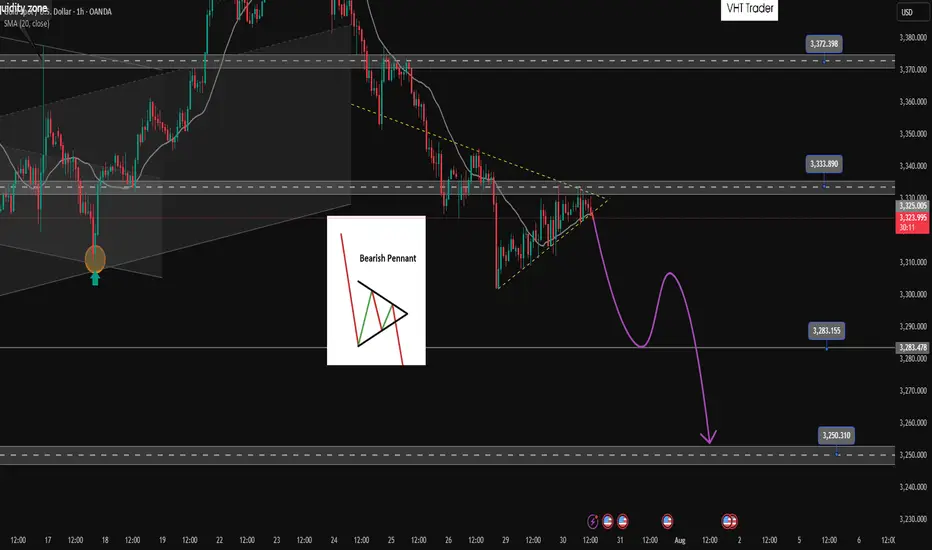
Bearish pennant pattern active. Active SELL✏️Gold price is forming a triangle accumulation pattern. That shows the hesitation of investors at the moment, they may be waiting for important economic indicators of the US this week. Just an impact that makes Price break out of the triangle border can create a strong FOMO trend. The price line is quite similar to the bearish pennant pattern and heading towards really strong support areas.
📉 Key Levels
SELL Trigger: Break bottom line 3324
Target 3285, lower is the 3250 area
BUY Trigger: Break and trading above 3333
BUY Trigger: Rejection and confirmation of candle at 3285
Leave your comments on the idea. I am happy to read your views.
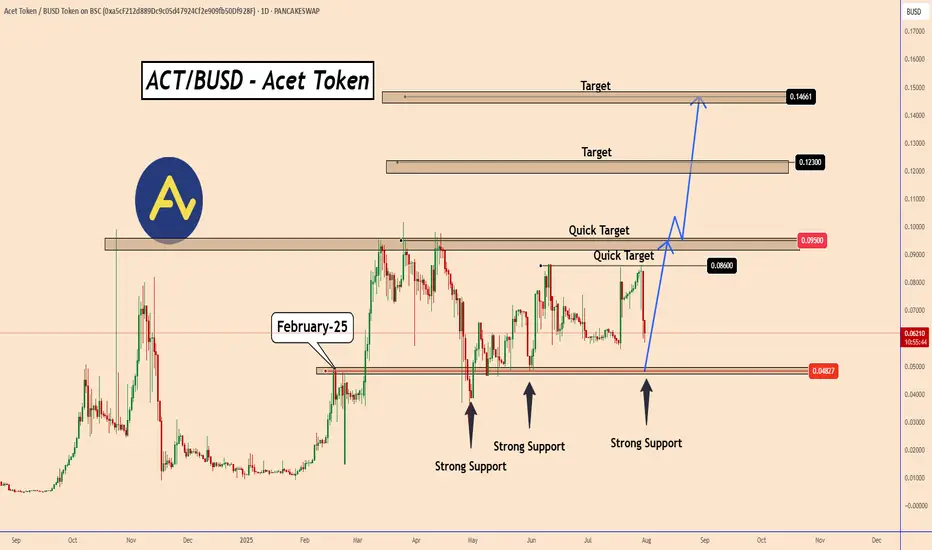
ACT Token: Ready to Break out from Months of AccumulationACT Token: Ready to Break out from Months of Accumulation
Price Outlook – ACT Token Since February 2025, ACT Token has been consolidating within a wide trading range between 0.0480 and 0.0950—a nearly 97% price spread from support to resistance. This prolonged accumulation offers a decent opportunity.
Currently, price action is hovering near the support zone again, hinting at a potential bullish breakout.
Historically, ACT’s impulsive moves have unfolded in aggressive waves, and with months of accumulation behind us, the likelihood of a breakout above 0.09500 has increased.
Key Upside Targets:
Minor resistance levels: 0.08600 and 0.09500
Breakout extension: 0.1230 and 0.14660 if momentum accelerates
We’ll follow the price development step by step, as the structure suggests a greater upside potential is in play.
You may find more details in the chart!
Thank you and Good Luck!
PS: Please support with a like or comment if you find this analysis useful for your trading day
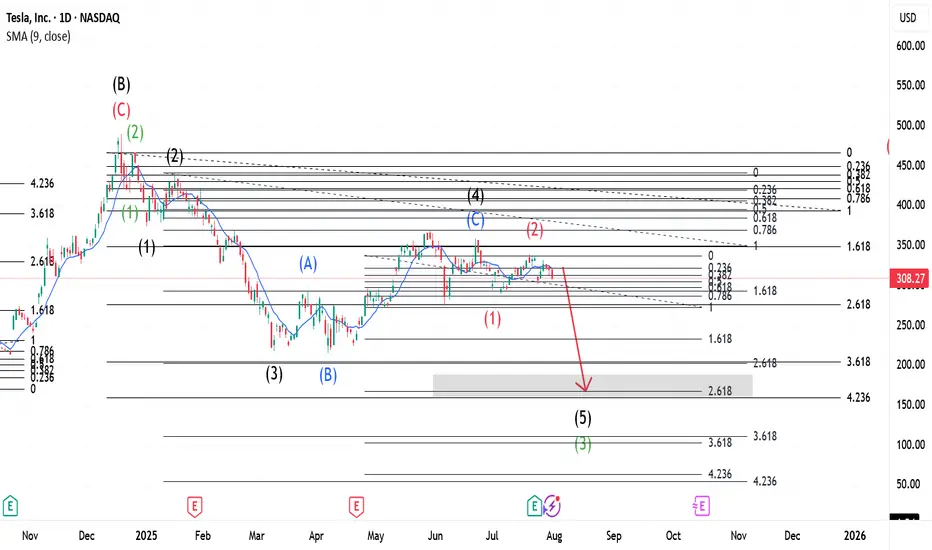
$TSLA ~ Elliott Wave Updates.This whole wave is Wave C(Black) that started when Wave B(Black) was completed. This Wave C(Black) expresses itself in 5 main waves shown in Green. Wave 2(Green) was a Zigzag and a Flat should be expected for 4(Green). Meanwhile, Wave 3(Green) expresses itself in a 5 wave move shown in Black- with Wave 2(Black) being a Zigzag, our 4 was a Flat. This Flat is shown as Blue ABC. When Wave 4(Black) completed, our Wave 5 began which upon completion, would be Wave 3(Green) of the main wave. Wave 2(Red) is a Flat and a Zigzag should be expected after 3(Red).
Go to for more information of the same.
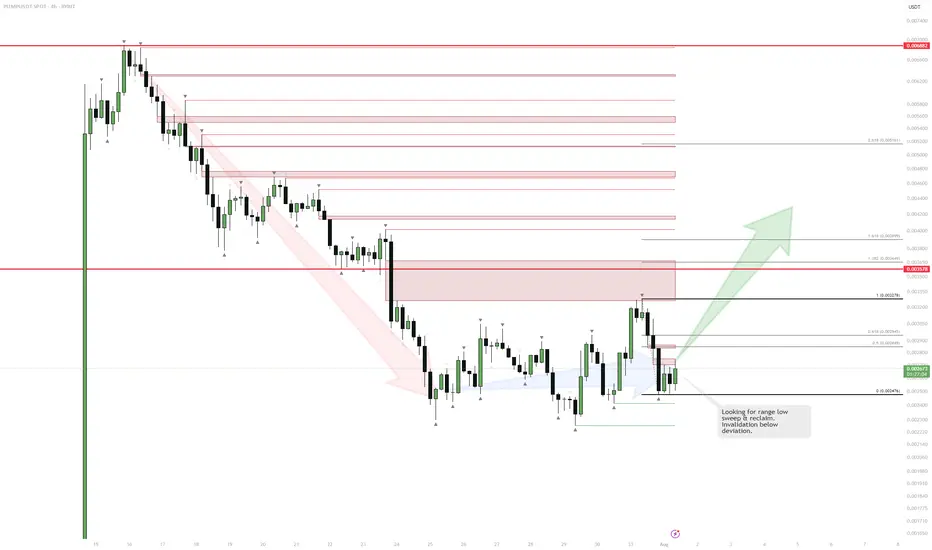
PUMP | Watching for Base ConfirmationThe sharp downtrend is showing signs of exhaustion as price starts to consolidate and build a potential range.
If we see a sweep and reclaim of the range low, that would confirm the start of a new accumulation phase and signal a potential reversal.
The invalidation for any long attempt is a confirmed breakdown below the deviation or the origin of the reclaim.
Plan:
Wait for a clean sweep and reclaim of the range low to trigger a long entry.
Target resistance levels above, with stops set below the reclaim origin.
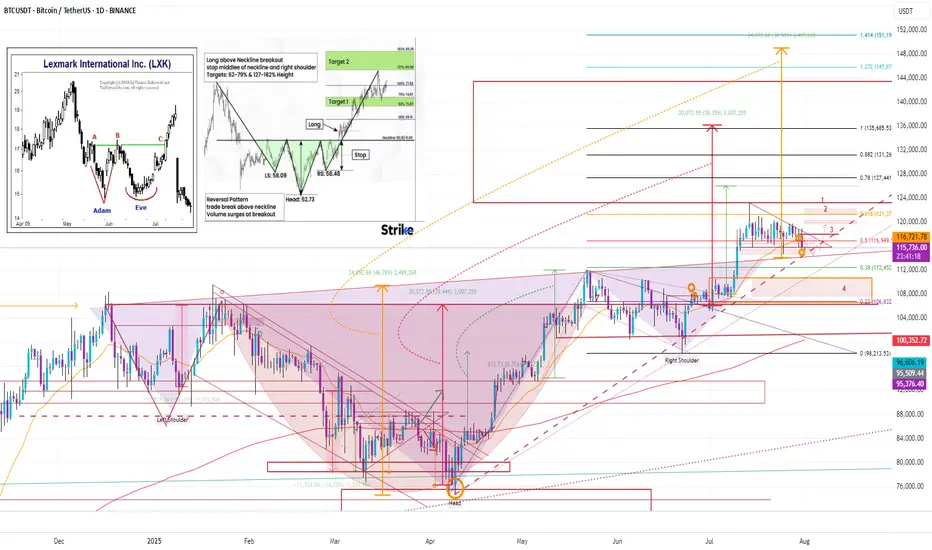
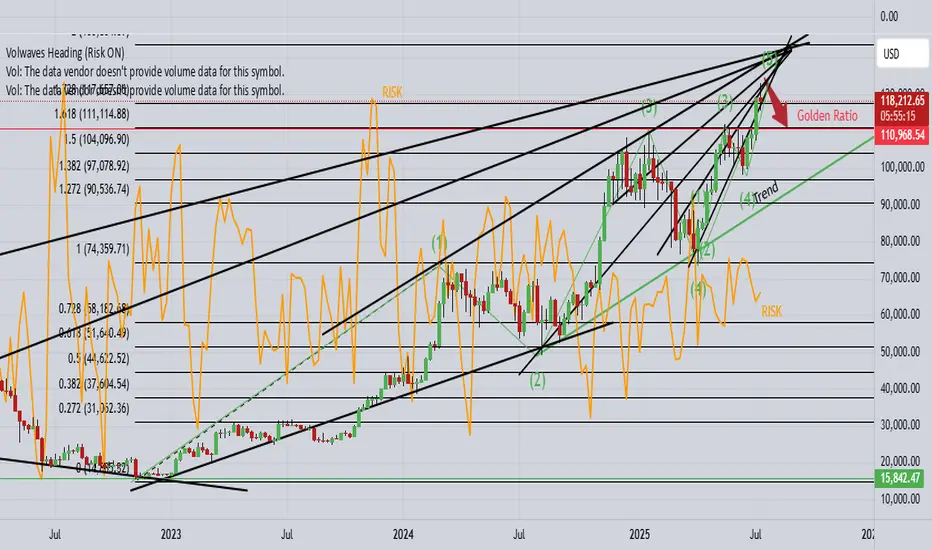
This is why I firmly believe we'll witness BTC reach 150K soon.No caption needed and every reasons are kept in the chart. Zoom In and analyze every single lines in the chart and hope you will see what I tend to see as far as my capabilities allows me. Let me know your comments on the idea. I am looking forward to witness $150K in the next 3 to 4 months time. I will be updating my confluences to say this on higher timeframes too.
With Regards. And stay Tuned.