THE STOCK MARKET IS BULLISH BUT NEEDS A SMALL CORRECTIONIn this video, we look at the weekly chart of the S&P 500 to determine if a correction is near and spoiler alert. Yes, it is. Here's what happens.
Community ideas

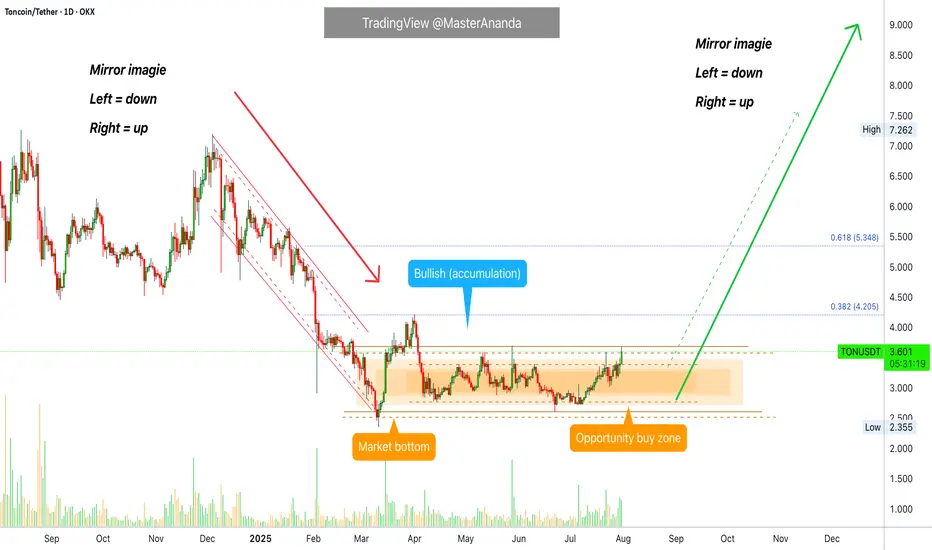
Toncoin Goes Bullish · 4X Leverage · Bottom Prices · OpportunityToncoin is breaking the sideways consolidation pattern. Today we have the highest price since late May, already two months ago, and rising volume. When you see how flat the action at the bottom is, you can tell how strong the bullish breakout that follows will me.
This is a friendly reminder because Toncoin will be huge in this altcoins market bullish cycle. I want you want you to be in, I want you to collect big projects, 1,000%+. That is why I am reminding you now. This trade setup can be approached both with leverage and spot, both options will do great.
After years of bearish action and months of consolidation, Toncoin is ready and the recovery is happening slowly but surely. Prices are rising slowly, no new lows. Prices are moving sideways but knowing the bottom is in the only logical conclusion is a break up. It is on the chart. It is inevitable, it is confirmed; profits and success.
Timing is really essential when trading. If you can get the right entry timing, a great price, trading becomes easy long-term. Once the bullish move shows up, you will be happy sitting in a strong position that only grows. That is because you bought the bottom. We are still looking at bottom prices, the last chance at the "opportunity buy zone."
We are doing 4X but we have positions with higher leverage from where prices were lower. You need to decide your own risk tolerance. If in doubt, zero leverage please. Only when you are 100% certain and you accept the full risk. The full risk is the liquidation of your position, all money gone. Are you ready to lose everything? If you are, better start trading spot. The chances of losing are very low. If prices drop, you get to pick a small paper loss and nothing more. Your number of altcoins stay the same. When the market starts to move, your money grows and the paper loss turns into a gain. You can't lose if you don't sell when prices are down. Buy when prices are low. Hold strong through the bullish wave. The time to buy is now. Buy and hold. You will be happy with the results.
Namaste.
GOOGL Slips into Bearish Gamma Territory. 8/1GOOGL Slips into Bearish Gamma Territory — Eyes on $190 Defense or Slide to $187.50
🔍 GEX & Options Flow Insight (1st Image Analysis)
GOOGL has broken down from its recent consolidation and is now testing the $190–$192 gamma support band. The GEX profile shows heavy negative gamma just below current price, increasing the risk of accelerated selling if $190 fails.
* Call Walls & Resistance:
* 📍 $194.91–$196.53 → First resistance zone
* 📍 $197.85 → Highest positive NET GEX / Gamma Wall
* 📍 $202.50+ → Out of immediate range unless a strong reversal occurs
* Put Walls & Support Zones:
* 🛡️ $190.50 → Current gamma pivot
* 🚨 $187.50 → 2nd Put Wall / Hard gamma floor
* 📉 Below $187.50 opens the door to $185–$182
* Volatility Insight:
* IVR 18.9, IVx Avg 32.5 → Slightly elevated IV
* Call flow 11.2% → Bearish leaning
* GEX sentiment: 🔴🔴🔴 = Negative gamma environment → more volatility to downside
✅ Option Trading Suggestion:
Bias: Bearish unless reclaiming $194+
Strategy: Bear put spread
* Entry Idea: Buy 190P / Sell 185P for Aug 2 or Aug 9 expiry
* Invalidation: Close above $194.91
* Target: $187.50 → $185
Why this works: Dealers in negative gamma hedge by selling into weakness, which can accelerate moves lower. Losing $190 likely brings $187.50 quickly into play.
🧠 Technical Analysis (1H Chart) (2nd Image Analysis)
Market Structure & SMC:
* 🟥 CHoCH confirmed after rejection from $197.85 supply
* ❌ Price broke BOS support from $194.91 area
* Trading in a descending structure toward $190 support
Trendline Dynamics:
* Broke short-term uptrend
* Now respecting a lower parallel channel toward $187.50
SMC Zones:
* 🟩 Demand Zone: $190.50–$187.50 → First defense zone
* 🟥 Supply Zone (Purple Box): $194.91–$197.85 → Immediate resistance
🔄 Price Action & Key Levels
* Support:
* ✅ $190.50 → Current hold line
* ✅ $187.50 → Gamma floor
* 🚨 Below $187.50 → $185 → $182
* Resistance:
* 🚩 $194.91 → First reclaim level for relief rally
* 🚩 $196.53–$197.85 → Supply + Gamma Wall
🧭 Scalping / Intraday Trade Setup
🟥 Bearish Setup (Preferred):
* Entry: Failed bounce at $194–$195
* Target 1: $190.50
* Target 2: $187.50
* Stop: Above $196
🟩 Bullish Reversal Setup:
* Entry: Strong reclaim of $196.50 with volume
* Target 1: $197.85
* Target 2: $200+
* Stop: Back under $194
🔁 Summary Thoughts
* GOOGL has shifted from neutral to negative gamma, favoring continued downside pressure.
* $190.50 is the short-term line in the sand — losing it risks a swift trip to $187.50.
* Any bounce into $194–$196 is likely to face selling pressure unless backed by volume and a gamma flip.
🚨 Disclaimer:
This analysis is for educational purposes only and does not constitute financial advice. Always do your own research and manage your risk accordingly.

NFP Friday - XAUUSD Prediction - August 2025#NFP Friday + New Month 👇
- Still leaning bearish on TVC:GOLD
- New month = re-positioning flows
- Watching 3225–3250 zone (Fib 38/50 confluence)
- Clean pullback setup near Psy level & untested orders
News Prediction:
- Labor market still holding up, I’m thinking NFP prints closer to 130k–150k, not that 110k estimate
- Yes, tech & retail saw some layoffs, but not enough to tank the whole report
- Adapt if wrong, execute if right. No stress
#XAUUSD #Gold #NFP #Dollar #NFPFriday #XAUUSD #Gold #NFP #JobsReport #Dollar #Macro #Trading #MarketOutlook #NFPFriday

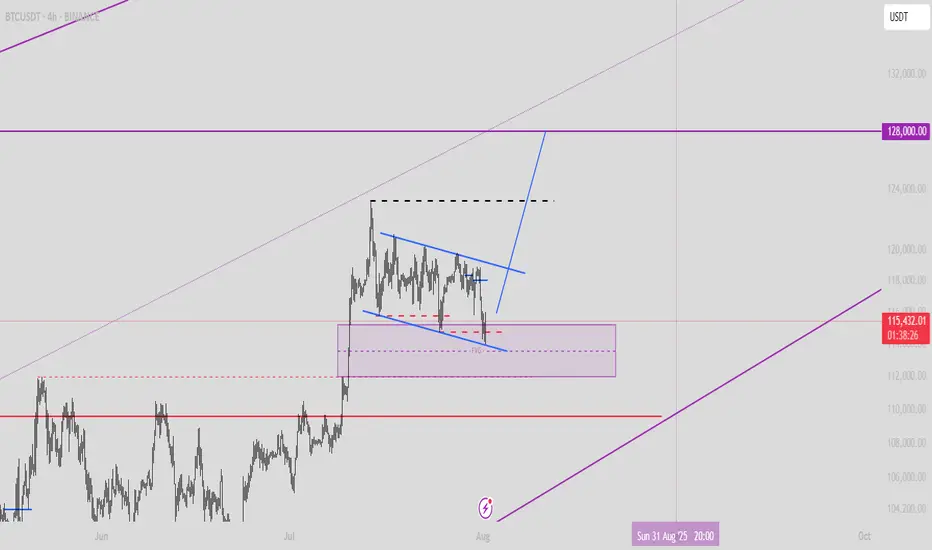
$BTC Is Bullish: Bull Flag + Liquidity sweep + RSI DivI see higher targets for bitcoin. right now Bitcoin is forming a bullish flag, two times it has targeted short stops, and on the 4H timeframe we also have an RSI divergence.
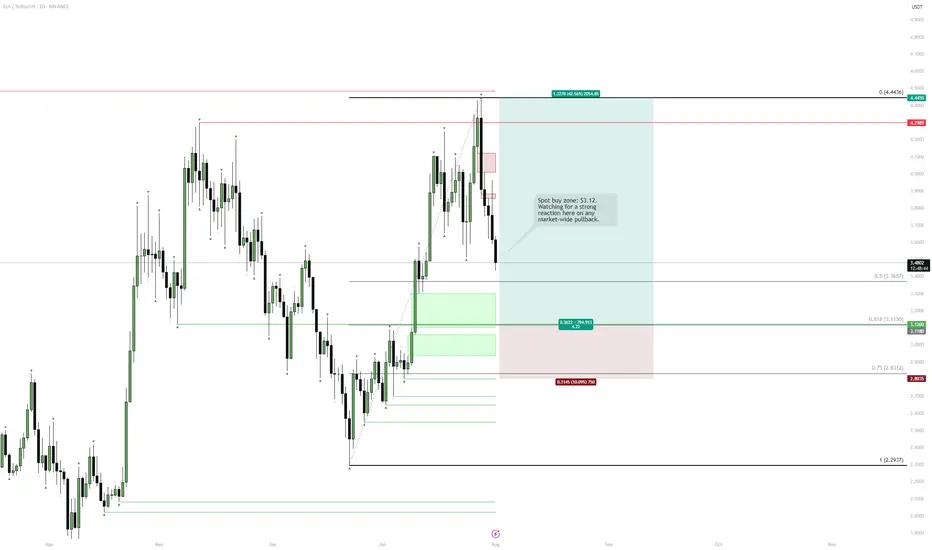
SUI | Spot Buy Zone for PullbackPrice has pulled back after a local top and is heading toward a clear demand zone.
Key buy area sits around $3.12, aligned with 0.618 retracement and recent consolidation.
Strong structure below—if majors keep retracing, this is where risk/reward for new spot buys becomes attractive.
Plan:
Waiting for price to reach the green zone to accumulate spot.
Invalidation below $2.80, targeting a move back toward $4.45 and higher if momentum returns.
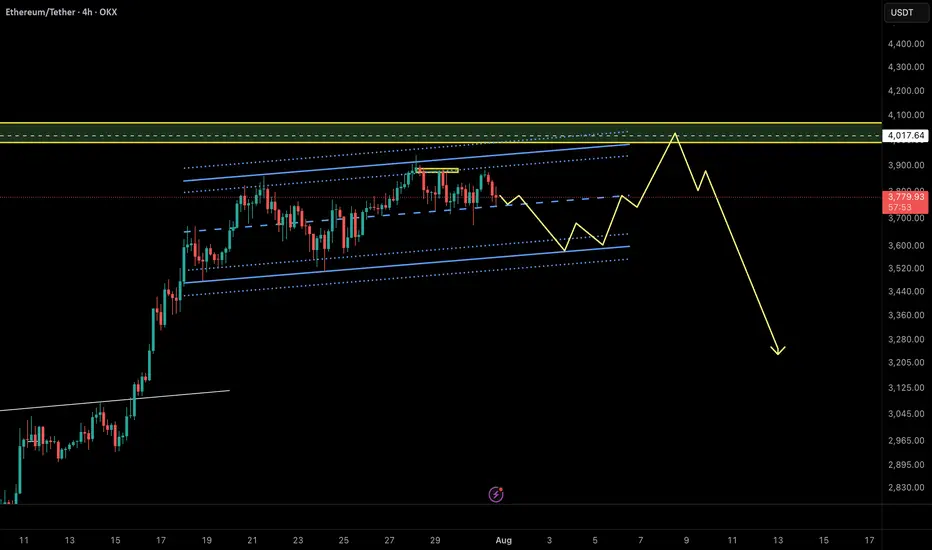
Ethereum Quick Outlook – Potential Trap Before Drop?ETH is moving within a rising channel, but momentum is fading. Price failed to break above the midline and is now testing lower support.
A fakeout to the upside toward the $4,015–$4,050 supply zone is possible before a deeper drop. The projected path suggests a short-term bounce, final liquidity sweep, then potential reversal.
🟡 Key Resistance: $4,015
🔻 Breakdown trigger: Below $3,620
🎯 Bearish Targets: $3,250 → $3,100
Structure hints at a possible Ending Diagonal (Neowave), or a Trap-Wave E inside a Complex Correction.
⚠️ Watch for manipulation near highs – confirmation needed for short entry.
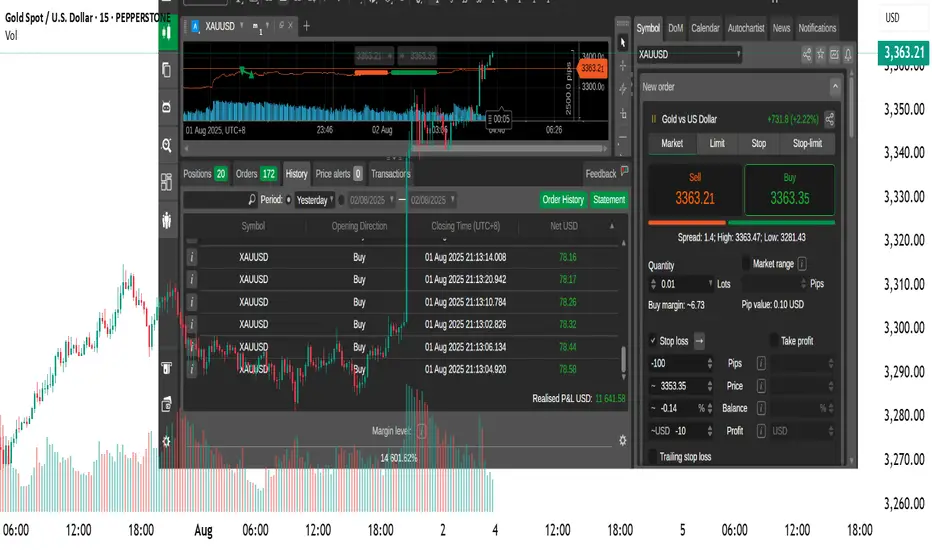
XAUUSD Live Trade Last Night (Killed it with 11,641 USD Profits)I managed to ride the momentum last night on XAUUSD and made over 11,641 usd profit on a live trading account. Gold usually create a range. It will create a top and a bottom then it will spend most of its time inside that range. That is pretty much how XAUUSD moves. If you can identify the top and the bottom then you can short it from the top and do a long trade on the bottom. The price will just travel from bottom to top and top to bottom. You can scalp your way to profits on this move if you can time it properly. Once in a while, a break from the top or the bottom happens. This is where you switch from trading the range to trading breakouts.
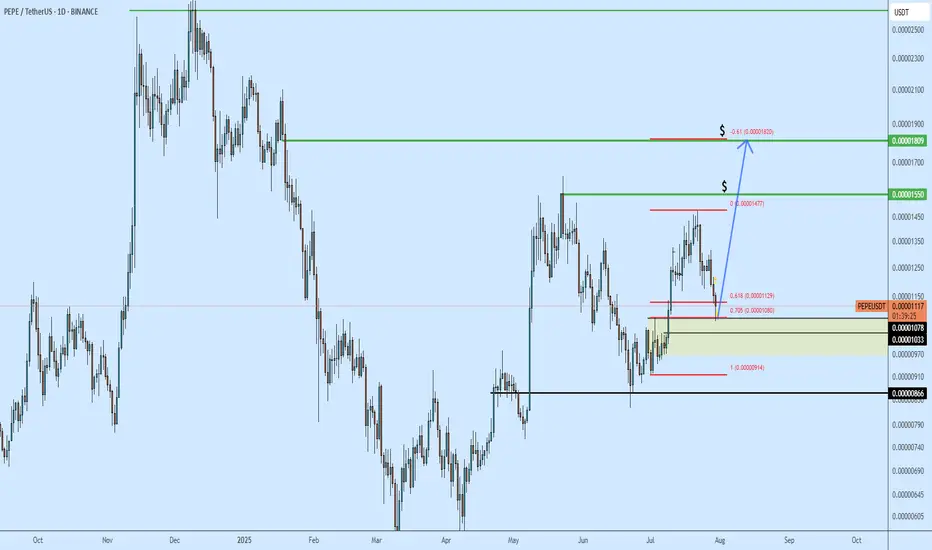
PEPE Uptrend continuation?PEPE has been trending higher over the last few weeks. Today it hit the fib level - seems to be getting a reaction. PEPE is a good hold for upside targets labeled ($).
I would keep thi bias unless we start invalidating (closing-below) 0.00000918
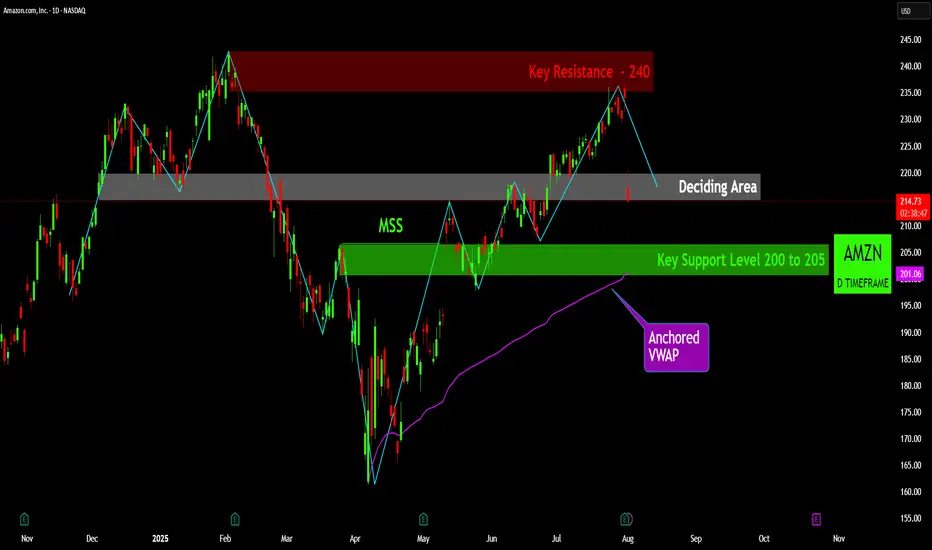
AMZN: The Battle for Direction at a Critical JunctureThe recent price action for Amazon (AMZN) is currently navigating a critical juncture, having pulled back from a significant resistance level and now consolidating within a pivotal "Deciding Area." A detailed review of the key technical levels reveals the following insights:
Key Resistance ($240): A formidable resistance zone is established around the $240 price point. This level represents a major overhead supply area, where prior selling pressure has been strong enough to halt upward price movements on multiple occasions. A decisive breach of this level on strong volume would be a highly bullish development, signaling a potential move to new highs.
Key Support Level ($200 to $205): A robust support zone is identified between $200 and $205. This level has historically served as a strong price floor, absorbing selling pressure and providing a foundation for subsequent rallies. The integrity of the current uptrend is heavily dependent on the price holding above this critical area.
Market Structure Shift (MSS): The formation of a "Market Structure Shift" earlier in the year was a pivotal technical event. This change in market dynamics marked a significant transition, signaling a potential reversal from a prevailing downtrend to the current bullish phase. The subsequent rally from the lows validates this structural change.
Anchored VWAP: The Anchored Volume-Weighted Average Price (VWAP), anchored from the most recent major low, is serving as a dynamic and trend-defining support level. This indicator reflects the average price paid by investors since the start of the current trend. A sustained close below this line would be an early warning sign of weakening momentum.
Deciding Area: The stock is presently trading within a "Deciding Area" situated just below a previous swing high. This zone represents a period of consolidation and indecision as the market digests the recent pullback from resistance. The outcome of this consolidation will likely dictate the short-term directional bias. A break to the upside would suggest a renewed attempt to challenge the $240 resistance, while a breakdown would likely lead to a retest of the primary support level at $200-$205.
Summary of Outlook: The overall technical picture for AMZN indicates that the stock is at a critical inflection point. The health of the underlying uptrend remains intact as long as the price holds above the key support levels and the Anchored VWAP. A definitive move out of the "Deciding Area" will provide the next clear signal for either a renewed push toward resistance or a deeper pullback to test established support.
Disclaimer:
The information provided in this chart is for educational and informational purposes only and should not be considered as investment advice. Trading and investing involve substantial risk and are not suitable for every investor. You should carefully consider your financial situation and consult with a financial advisor before making any investment decisions. The creator of this chart does not guarantee any specific outcome or profit and is not responsible for any losses incurred as a result of using this information. Past performance is not indicative of future results. Use this information at your own risk. This chart has been created for my own improvement in Trading and Investment Analysis. Please do your own analysis before any investments.
100% Guaranteed EURUSD Long time buy Position .Eur Usd long time buy position . Next profit will be 50 to 100 pips .
Take 1st tp 50 pips and wait for next 100 pips
If you have any question fell free ask my any question
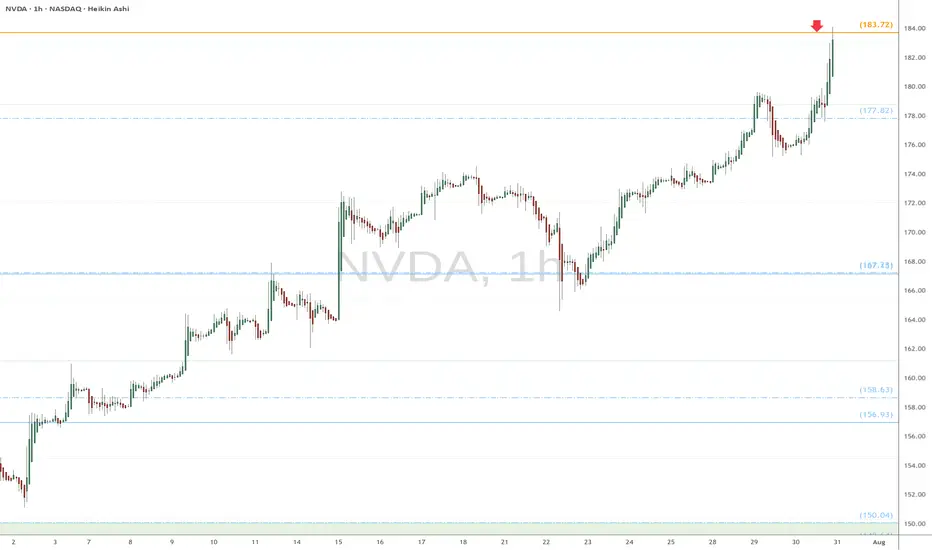
NVDA heads up at $183.72: Golden Genesis fib to mark a TOP?Chips have been flying high since the April lows.
NVDA has just hit a Golden Genesis fib at $183.72
This is a "very high gravity" fib so expect a reaction.
It is PROBABLE that we "orbit" this fib a few times.
It is POSSIBLE that we reject to form a major top.
It is PLAUSIBLE that we Break-n -Retest to continue.\
.
See "Related Publications" for previous EXACT plots ------>>>>>>>>
Such as this post at the last Golden Genesis:
Hit the BOOST and FOLLOW for more such PRECISE and TIMELY charts
============================================================
.
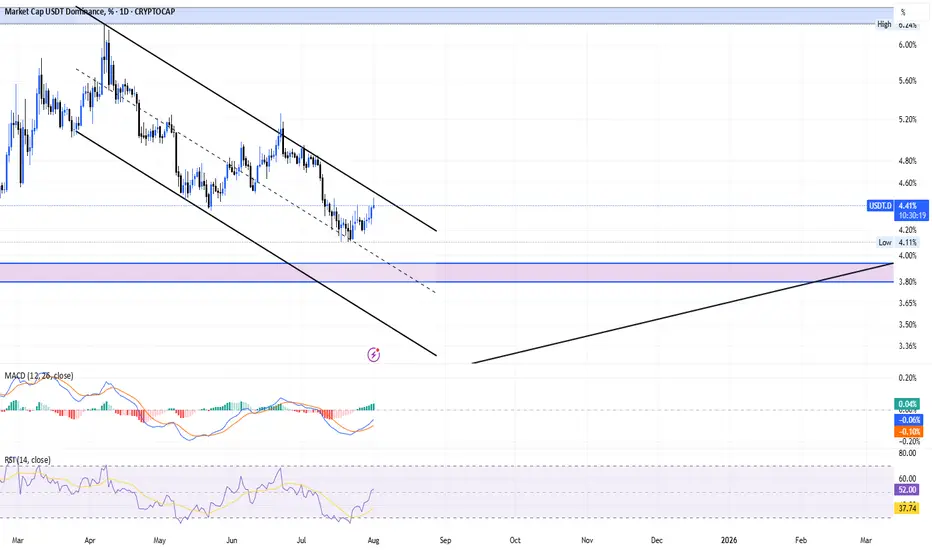
A comeback trendI think the downward trend will continue.
As you can see on the chart, if there is no news, the trend continues in a channel.
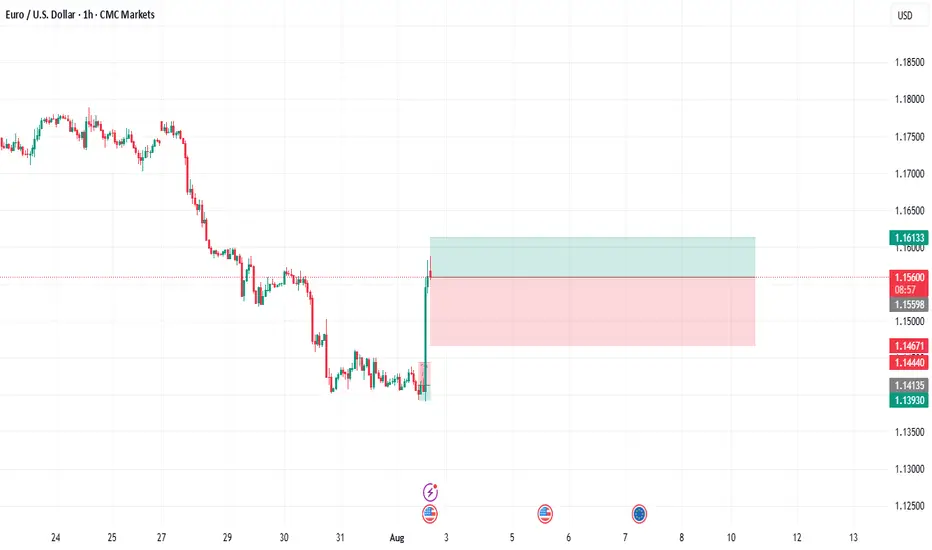
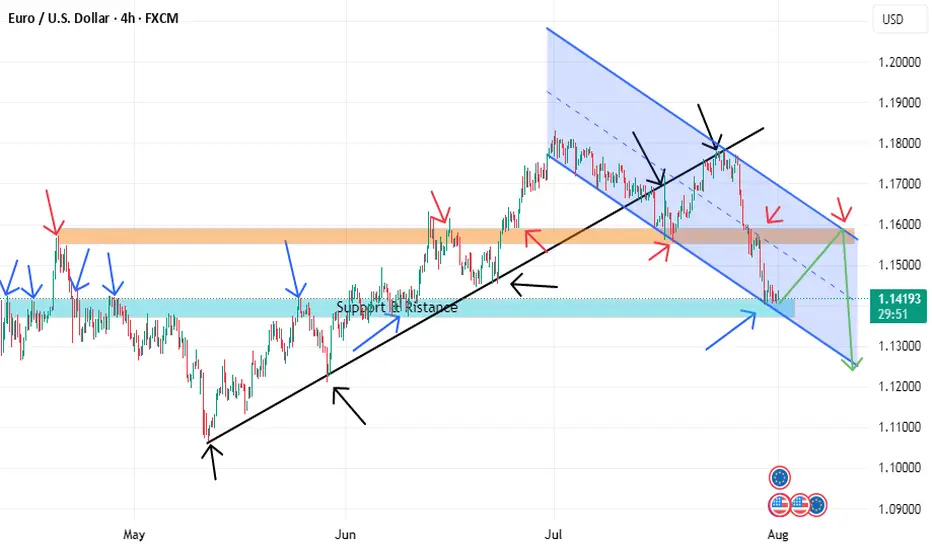
EURUSD BUYING CORRECTION AND SHORTThe price is now at a strong support level and if it can be a double bottom it will retest the descending channel line and reach the orange resistance, but in the general direction the price prefers to fall due to breaking the black uptrend line. We also have a more beautiful scenario, which is if it can break the strong support we will go with the downward trend.
going lon after the close of 07:00 AM the price took the lequidite of a significant Low , and back to the range never close below
this low in 1H TF and 4H TF after we get HL or Swing high I enter buy

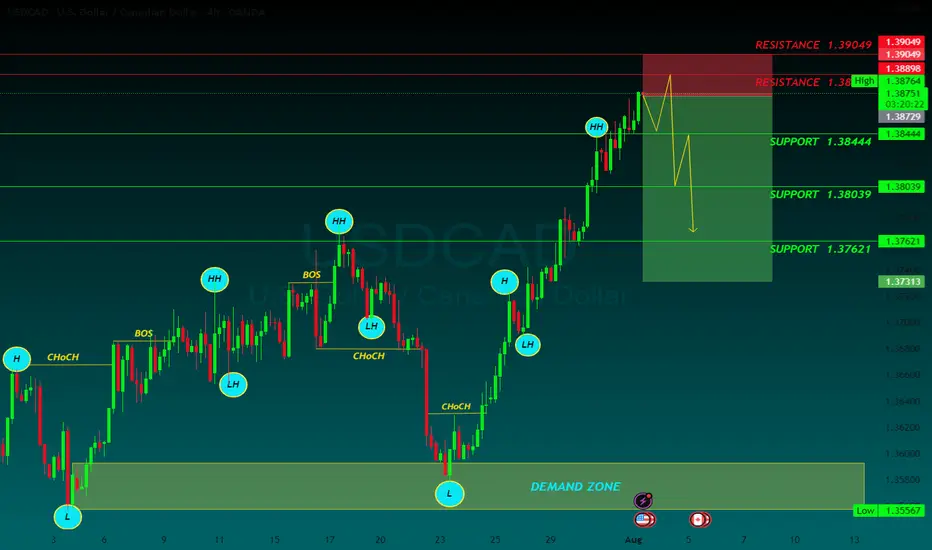
USDCAD SELLUSD/CAD rallies further, approaches 1.3900 on higher levies to Canada
The US Dollar keeps marching higher, as the Canadian Dollar struggles after Trump decided to increase tariffs to Canada to 35% from the previous 25%, escalating the trading tension with one of its main trading partners. The US President justified his decision on Canada’s alleged reluctance to cooperate on curbing the traffic of fentanyl and other drugs across the US border
The year will be politically marked by Trump’s return to the White House. A Republican government is seen as positive for financial markets, but Trump’s pledge to cut taxes and impose tariffs on foreign goods and services may introduce uncertainty to both the political and economic landscape.
Canada’s political crisis peaked in late 2024 with a no-confidence vote against Prime Minister Justin Trudeau, leading to snap elections and a weakened Liberal minority government. Policy uncertainty and economic challenges dominate 2025’s outlook, raising concerns over market stability and investor confidence.
The BoC is set to continue easing interest rates through 2025, at least at a faster pace than the Fed is expected to, which could apply pressure on CAD’s already-rising rate differential.
SUPPORT 1.38444
SUPPORT 1.38039
SUPPORT 1.37621
RESISTANCE 1.38889
RESISTANCE 1.39049
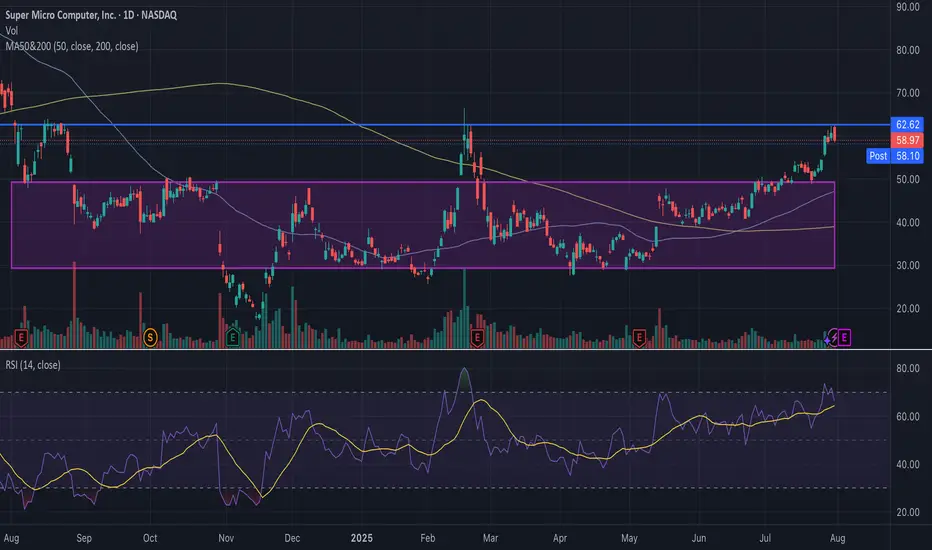
SMCI Short-Term Put PositionSMCI is currently struggling to break past a key historical trend line around $62–$63, a level that acted as resistance multiple times over the past year. The stock briefly broke above $60, but failed to hold the breakout, signaling potential exhaustion. Price is approaching overbought territory with RSI nearing 70. This move is also extended from both the 50-day (blue) and 200-day (yellow) moving averages. Additionally, volume was not exceedingly high during the breakout. I have strong conviction that it will drop to ~50. SMCI spent nearly 9 months trading between ~$33 and ~$50, as shown in the purple consolidation box. If this breakout fails, $50 becomes a natural target, as its the resistance line in the consolidation box where SMCI has been trading at for 9 months. A close below $58 (today’s low) would confirm rejection and likely accelerate selling. A put position could be highly profitable.
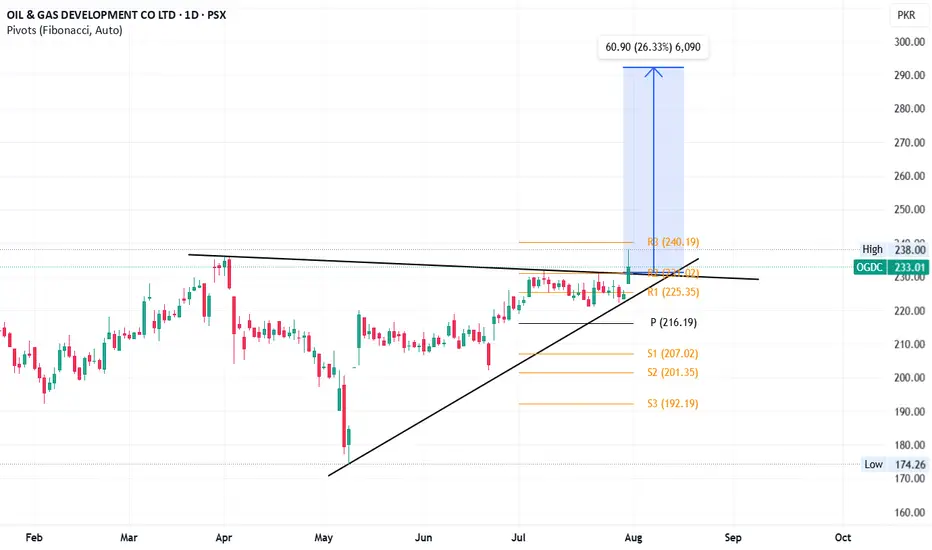
OGDC Breakout?On a daily timeframe, OGDC has given breakout of a triangle pattern. This will open up doors for it to move towards its all-time high i.e. ~290 region.
This is my personal opinion, not a buy / sell call.
All other indicators e.g. RSI, Stoch and MACD are bullish as well.
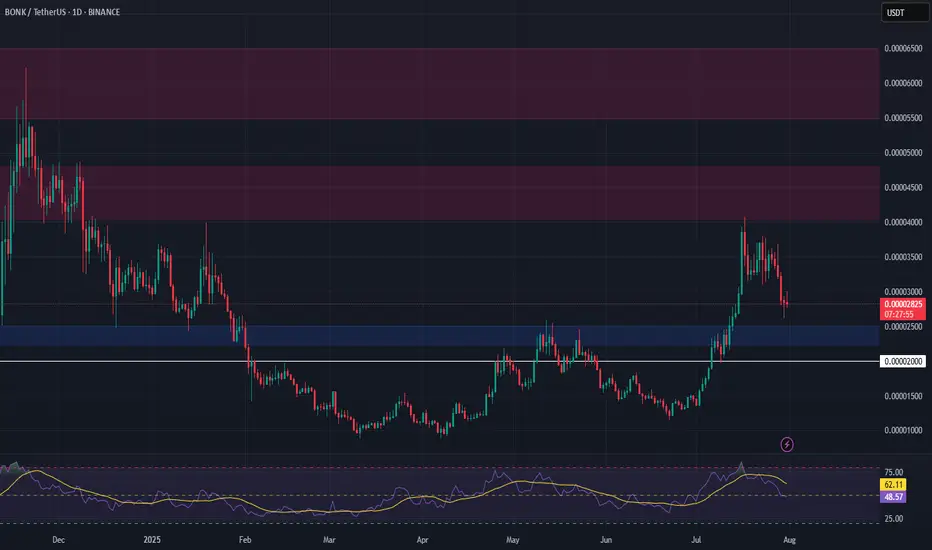
BONK Setup – Watching for Retracement After 200%+ RallyBONK has surged over 200% in recent weeks. We're now eyeing a retracement to a key support zone that could offer a prime entry for the next leg higher.
📌 Trade Setup:
• Entry Zone: $0.00002240 – $0.00002500
• Take Profit Targets:
o 🥇 $0.00004050 – $0.00004800
o 🥈 $0.00005500 – $0.00006500
• Stop Loss: Just below $0.00002000
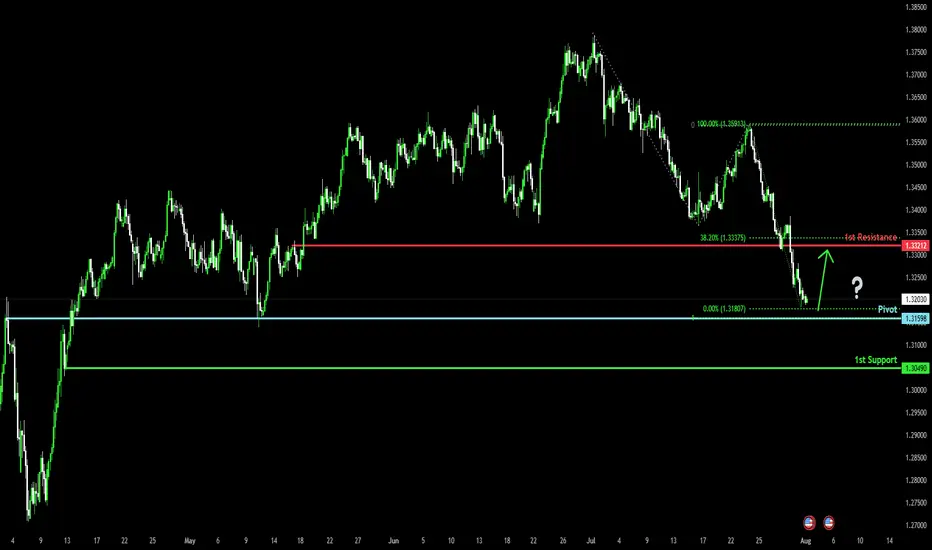
Bullish reversal off overlap support?The Cable (GBP/USD) is falling towards the pivot and could bounce to the 1st resistance, which is a pullback resistance that is slightly below the 38.2% Fibonacci retracement.
Pivot: 1.3159
1st Support: 1.3049
1st Resistance: 1.3321
Risk Warning:
Trading Forex and CFDs carries a high level of risk to your capital and you should only trade with money you can afford to lose. Trading Forex and CFDs may not be suitable for all investors, so please ensure that you fully understand the risks involved and seek independent advice if necessary.
Disclaimer:
The above opinions given constitute general market commentary, and do not constitute the opinion or advice of IC Markets or any form of personal or investment advice.
Any opinions, news, research, analyses, prices, other information, or links to third-party sites contained on this website are provided on an "as-is" basis, are intended only to be informative, is not an advice nor a recommendation, nor research, or a record of our trading prices, or an offer of, or solicitation for a transaction in any financial instrument and thus should not be treated as such. The information provided does not involve any specific investment objectives, financial situation and needs of any specific person who may receive it. Please be aware, that past performance is not a reliable indicator of future performance and/or results. Past Performance or Forward-looking scenarios based upon the reasonable beliefs of the third-party provider are not a guarantee of future performance. Actual results may differ materially from those anticipated in forward-looking or past performance statements. IC Markets makes no representation or warranty and assumes no liability as to the accuracy or completeness of the information provided, nor any loss arising from any investment based on a recommendation, forecast or any information supplied by any third-party.
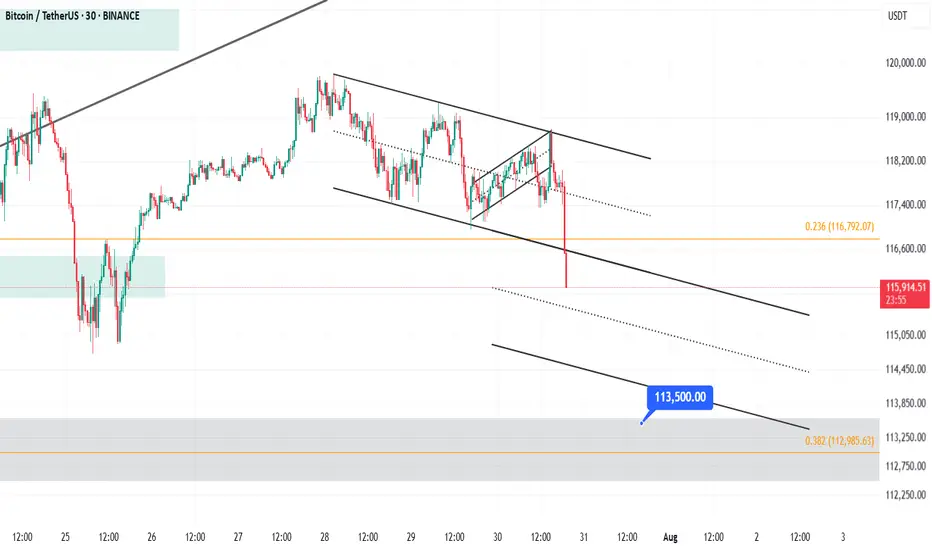
Quick Bitcoin Analysis – 30-Minute TimeframeQuick Hey friends 👋
Bitcoin was recently moving inside a weak upward channel on the 30-minute chart. But now, it has broken below the channel with a strong bearish candle. This suggests we’re entering a short-term correction.
🔹 However, don’t forget — the overall trend is still bullish.
This drop looks more like a healthy pullback, not the start of a full downtrend.
🎯 Possible Targets for This Correction:
✅ Target 1: Around $114,500
(This comes from measuring the width of the broken channel.)
✅ Target 2: Strong support near $113,500
(This level has shown solid buyer interest in the past.)
📊 The RSI is also approaching the oversold zone, which means we might see a small bounce or slowdown in the drop soon.
📌 In short:
This is likely just a dip in a bigger uptrend. Be patient, watch key support zones, and don’t rush into trades.
Always stick to proper risk management! 💼
Bitcoin Analysis – 30-Minute Timeframe
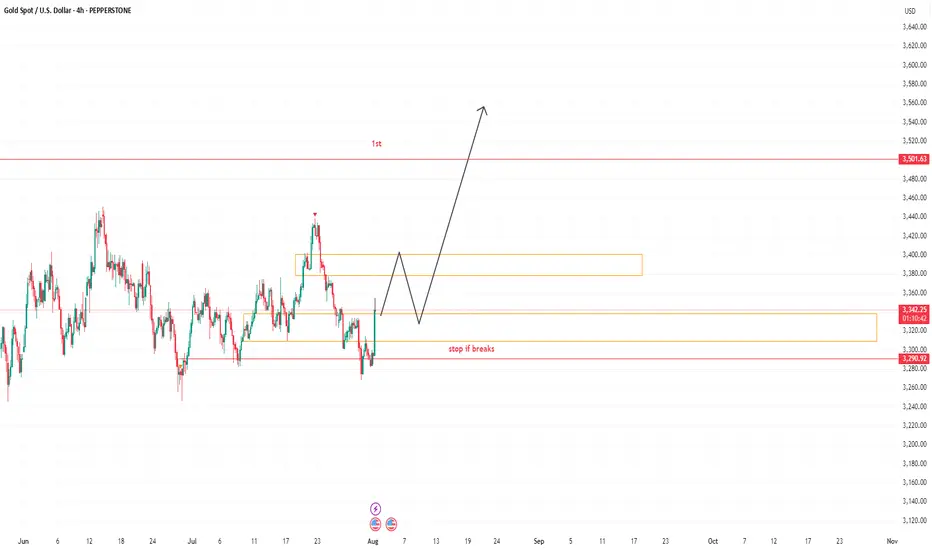
GOLD CONTINUATION PATTERNHello folks, here we go again, This idea stuck in my head only today and its friday. rather shared it or none, but see the charts for stops and target. this might be your lucky day on my page.
Here is my idea, take it if you love to swing or watch it fade. Congrats were on 800 community or I got more followers because of this. and Previous idea we made a lot thats 1200 pips good for a month trade. lets see this August. my target is labeled this chart first at 3500 zone. next target will be posted on my notes or updated the idea. no charts until it breaks that labeled on chart. until it goes higher again.
You will never see this kind of idea for a month again. So follow on my page, I have some for you if you have small accounts.d m here
My goal is to target the highest TP will be above this new highs.
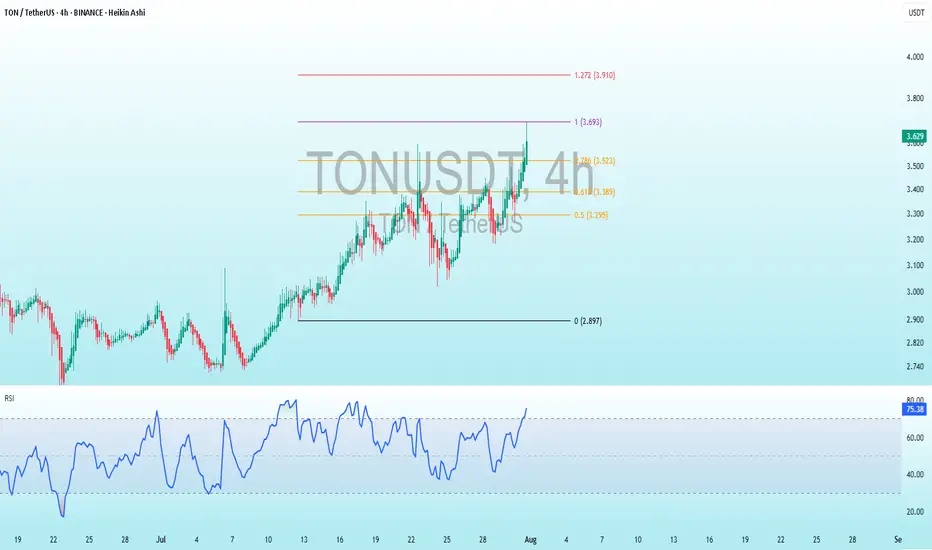
TON Bearish DivergenceBINANCE:TONUSDT
Trade Setup:
Target 1: 3.523 (0.786 Fibonnaci Golden Zone).
Target 2: 3.389 (0.618 Fibonnaci Golden Zone).
Target 3: 3.295 (0.786 Fibonnaci Golden Zone).
Target 4: 2.897 (0 Fibonnaci).
Stop Loss: 3.910 (1.272 Fibonnaci).
RSI Analysis: The RSI is showing a bullish divergence, suggesting potential bullish momentum. The current RSI is around 75.44, approaching overbuy territory, so caution is advised.