XAUUSD – Smart Money Sell Setup during New York Session | ICT St
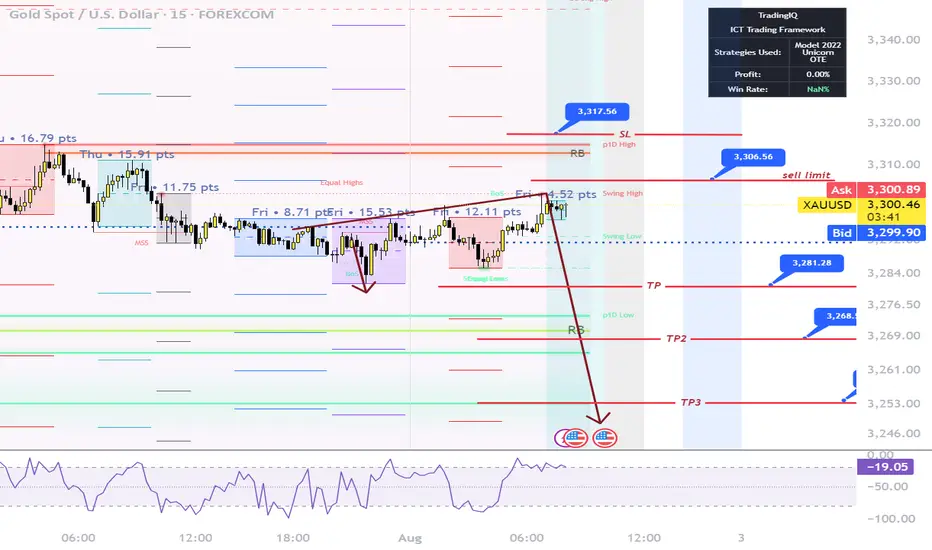
Gold (XAUUSD) has just completed a classic liquidity grab above the London session highs, forming a potential Judas Swing as New York begins.
On the 4H timeframe, we clearly have a bearish BOS (Break of Structure), and price has returned to a Premium zone within a bearish FVG and OB (Order Block).
Today is NFP Friday, and after the Fed kept rates steady mid-week, we’re expecting high volatility.
Current price action has swept the overnight liquidity and is now reacting inside a Repricing Block, aligning perfectly with the NY Midnight Open level.
🎯 My Sell Plan (Live Execution):
Sell Limit: 3306.50
SL: 3317.50 (Above OB high)
TP1: 3281.20
TP2: 3268.50
TP3: 3253.90
🧠 Bias: Bearish
🕒 Session: New York
🧮 ADR: 43 pts
📉 Market Structure: Bearish
This setup follows the ICT methodology using time, liquidity, structure, and displacement.
If we break above 3317.50 with strong displacement, the idea becomes invalid.
Let's see if Smart Money takes it down into Friday’s close.
Community ideas
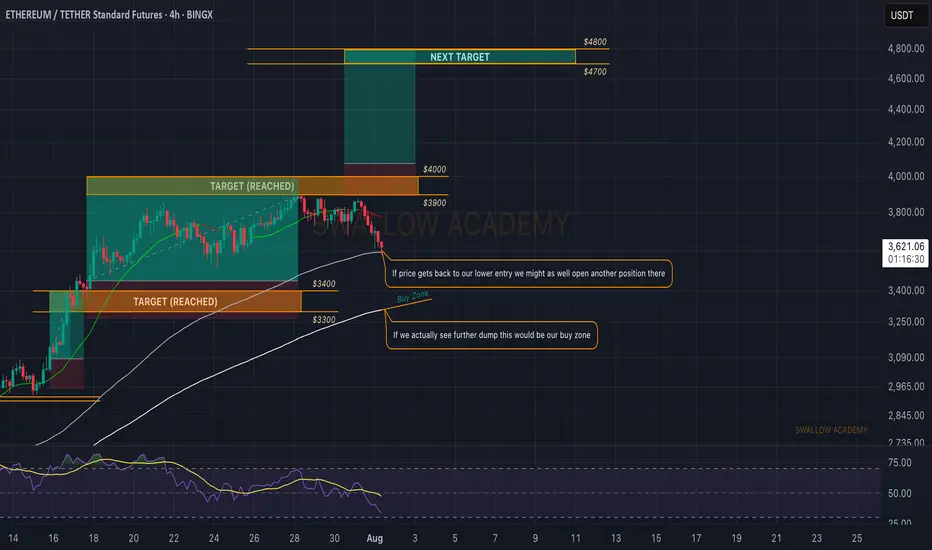
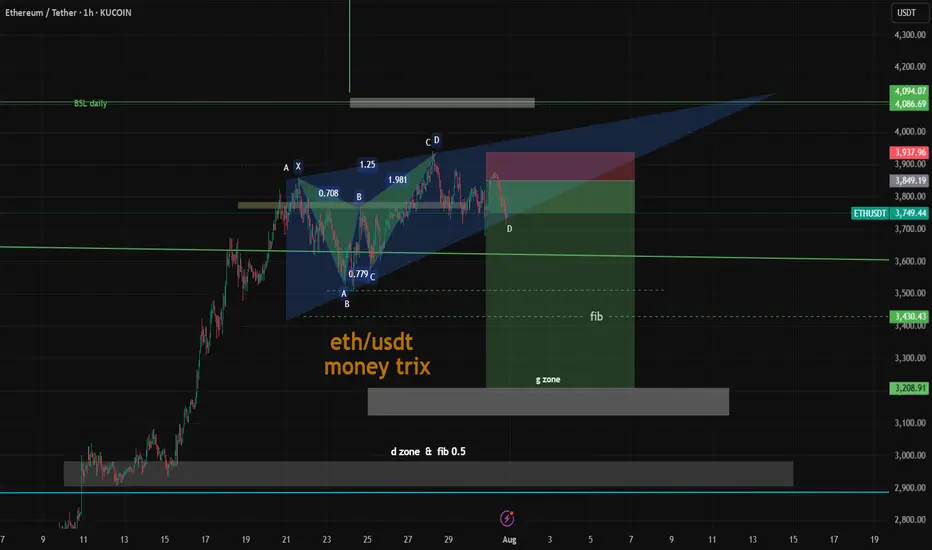
Ethereum (ETH): Bloody End of Week & Start of Month | We Wait!Well, we were close to breaking out of the $4000 area and now we are back on the lower side of the area, where sellers are showing strong pressure to coin.
As we approached the 100 EMA, we waited. Waiting is the worst part of trading, but that's what we do here. The 200 EMA is one key zone for us for another buying opportunity so if we keep on falling, that's the zone we are aiming for.
The second point of interest is the current 100 EMA, where if we see MSB to form, there might be a smaller scalp opportunity.
And last but not least, the zone above $4000.
Swallow Academy
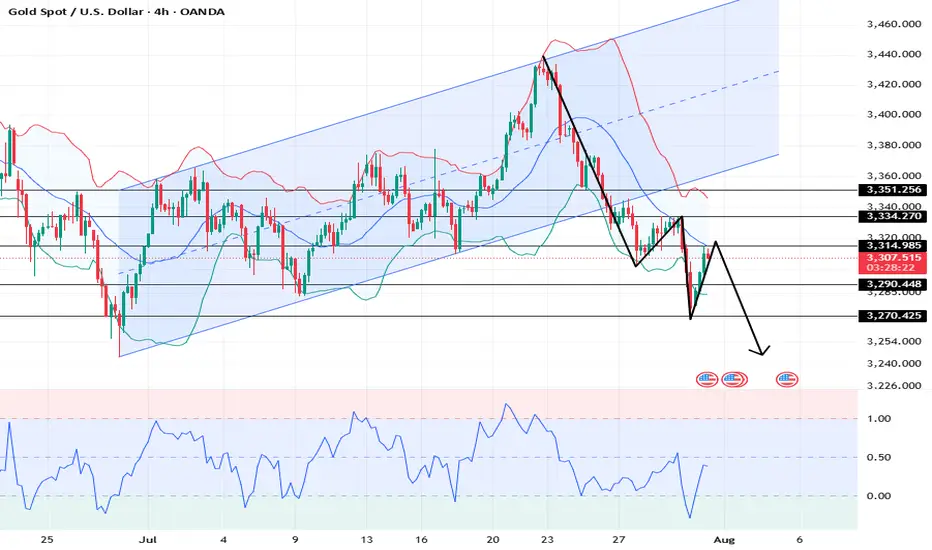
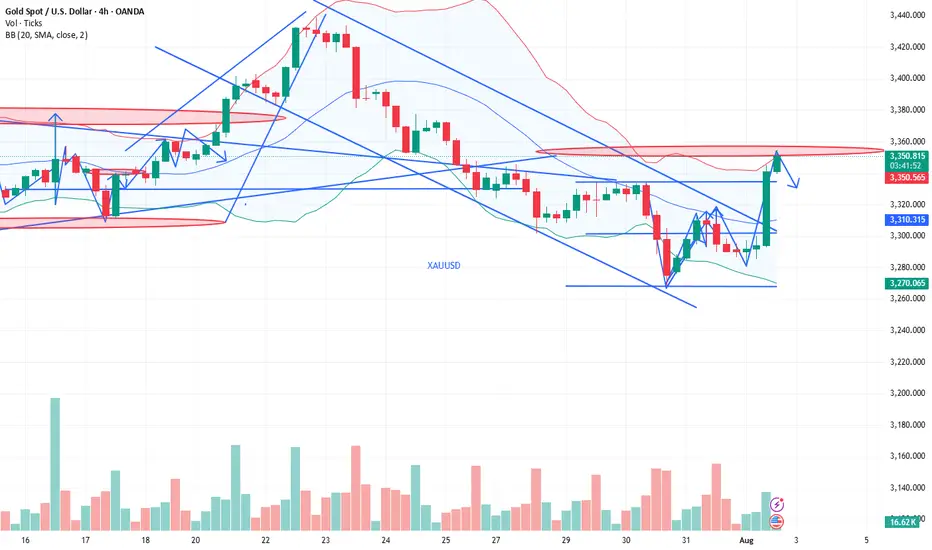
XAUUSD: Market Analysis and Strategy for July 31stGold Technical Analysis:
Daily chart resistance: 3351, support: 3250
4-hour chart resistance: 3335, support: 3270
1-hour chart resistance: 3315, support: 3290.
Gold was trading sideways between 3320 and 3333 yesterday before the New York market. During the US trading session, the release of US ADP employment figures and PCE price data was bearish for gold, causing it to plummet below Monday's low of 3301. The Federal Reserve held interest rates steady, and Powell's hawkish speech sent gold plummeting to around $3268.
Affected by the news, gold prices fell rapidly yesterday, reaching a low near the lower Bollinger band on the daily chart. It rebounded in the Asian session today, reaching a high near 3315. Selling is recommended in the sideways range between 3310 and 3320. The US PCE data will be released in the New York market, so avoid the news release period.
BUY: near 3290
SELL: near 3270
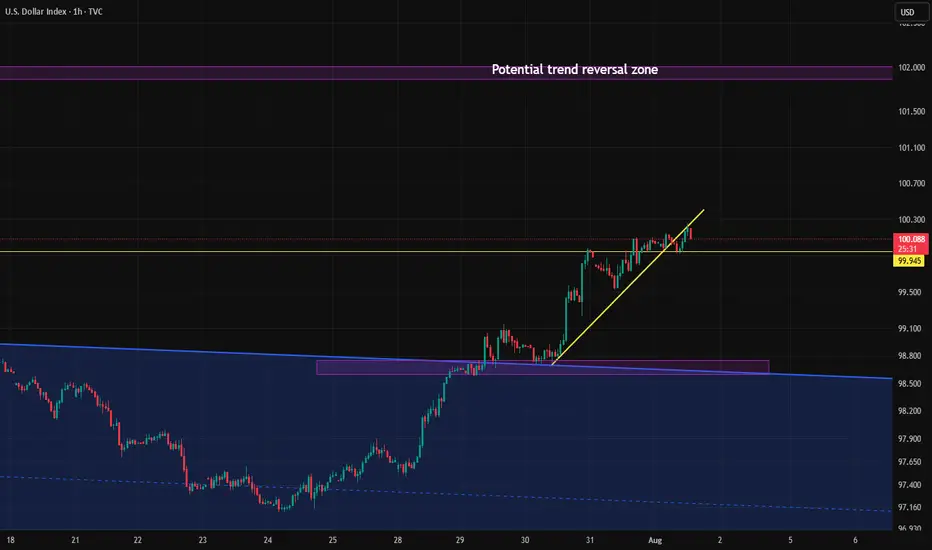
Candle close above 100 after 2 months.If the Dollar Index manages to close above the 100 level today, following the important news release, there's a chance the upward move could continue toward the key 101 zone next week.
However, unless it breaks above the 101 level with strong momentum, the overall trend in the higher timeframes still remains bearish.
GOLD NON FARM ANALYSISAs you can see market is moving round and round inside bullish FVG from thursday night 31 july and making sell side liquidity which is till 3382 so possible move can be an expansion which will be bullish.4H bullish FVG indicates that market does not wants to go down.

"US2000 THIEF TRADE: SWIPE & ESCAPE BEFORE BEARS!"🚨Russell 2000 Robbery: Pullback to Power Play⚡️💰
🌟Hi! Hola! Ola! Bonjour! Hallo! Marhaba!🌟
Dear Market Robbers & Money Makers, 🤑💰💸✈️
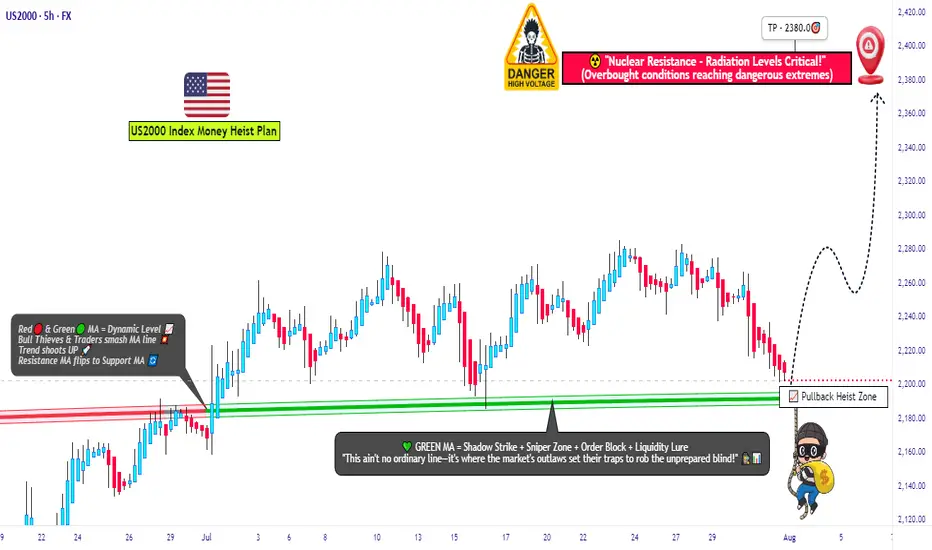
This is a full-blown heist plan on the US2000 (Russell 2000) index using the Thief Trading Style™, a perfect combo of real-time technicals + macro heat.
Get ready to swipe the bull run right after a tactical pullback — let’s rob the market clean and vanish at the high-voltage resistance level ⚡️🚨📊
📈 Entry Plan – The Vault Opens @ 2190.00
Watch for a clean pullback to the zone around 2190.00.
Place buy limit orders after confirmation from 15m or 30m candles – preferably near recent swing lows.
Smart move: Set alerts so you don’t miss the breakout trigger.
🛑 Stop Loss – Escape Hatch @ 2140.00
Use the nearest 4H candle wick or swing low as your SL level.
Thieves scale their lot size & SL based on position stacking and trade confidence.
🎯 Target – 2380.00 (Or Jump Before the Heat Gets Real)
Take profit near the heavy resistance zone. Don’t overstay — market traps ahead! Electric reversals & institutional bears wait there to flip the game ⚡🐻
👀 Scalpers’ Secret:
Only long scalps! 💣
No funds? Follow the swing robbers.
Trail your SL and let the bulls push your bags up.
🧠 What’s Fueling This Bullish Ride?
US2000 is surging with:
• Risk appetite from macro sentiment
• COT data aligning bullish
• Intermarket signals syncing up
• Rotational flows into small-cap strength
⚠️ Thief Trading Alerts – News Impact Zone Incoming!
• Don’t enter fresh trades during red news.
• Use trailing SLs to guard floating profits.
Market spikes are good — if you’re prepared.
💣💥This isn’t just a trade – it’s a mission.
Rob smart, trail hard, and cash out sharp.
📦💼Every move is calculated. Every entry is a chance.
🚀Stay sharp, robbers – next heist plan drops soon! 💼🔐📈
🏆Trade like a thief, win like a boss.
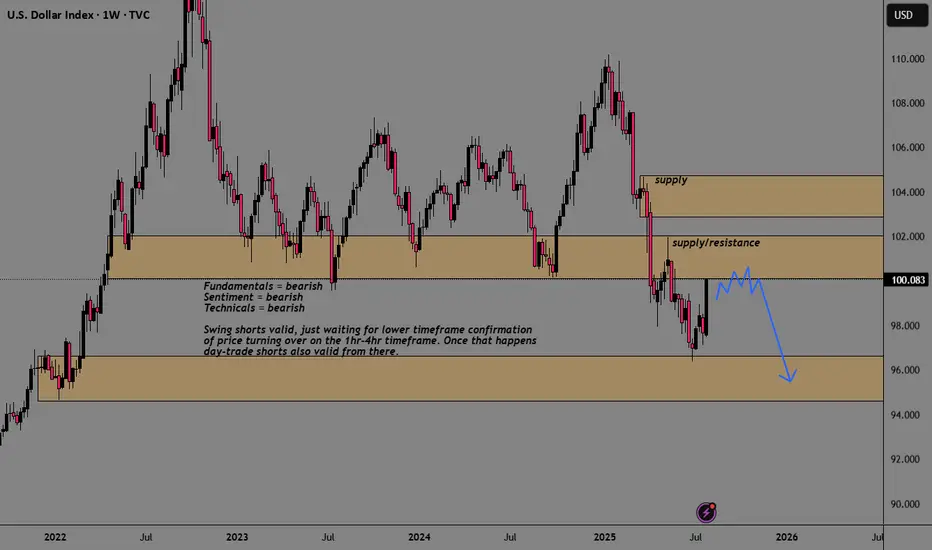
DXY USDOLLAR CRASH Incoming!Long-term fundamentals are bearish
Long-term sentiment = bearish
Long-term technicals = bearish
Trump wants a weaker dollar + FED injecting endless amounts of cash into the markets
driving stocks/ gold up, and the dollar down, losing purchasing power.
My plan is to look for shorts on the 1hr-4hr timeframe with lower timeframe confirmation.
Once price starts turning over, day-traders can join in.
Agree or disagree?
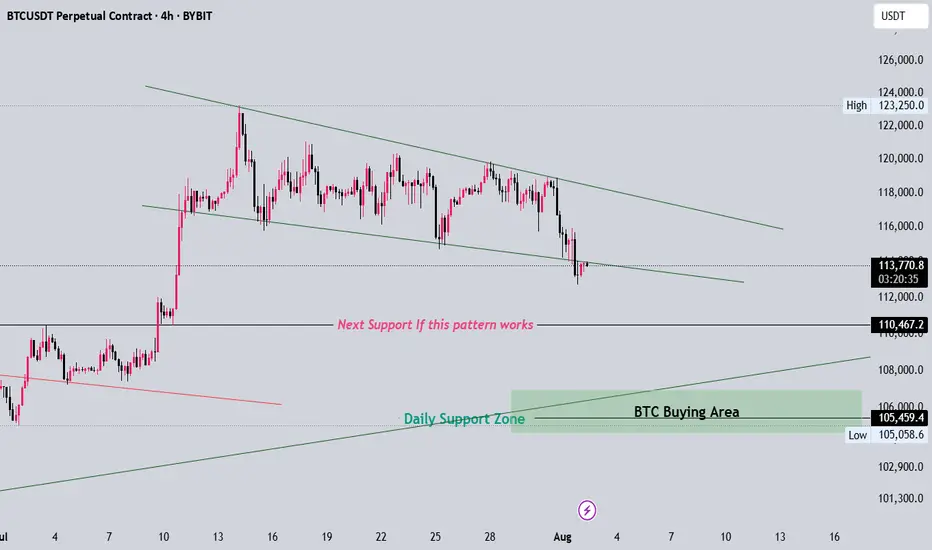
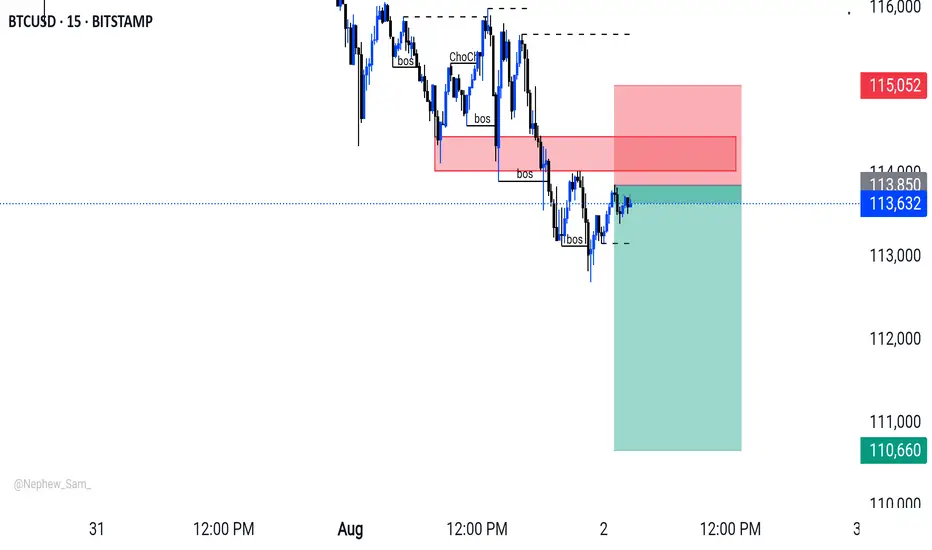
BTC Clear Idea if this pattern worksFor now please observe some time if btc breaks down to next target which is arround 110k then btc will definetly move towards 105k becuase that is its daily trendline support
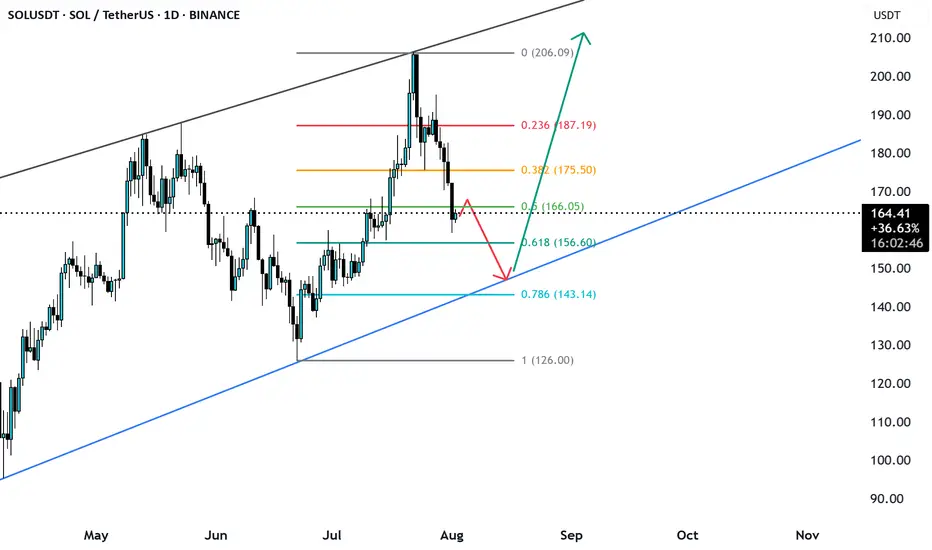
SOLUSD broke the 0.5 fib level is likely to go down SOLUSD yesterday broke the O.5 Fib level and price may further go down to trendline support from where price may get reverse.
ETHUSDTPossible short on ETH, as we know this might be a news dump that caused this blood in the market and might recover very soon, but we broke a key support level, this is the 4HR chart and we will have a better idea what's on the table when weekly close.

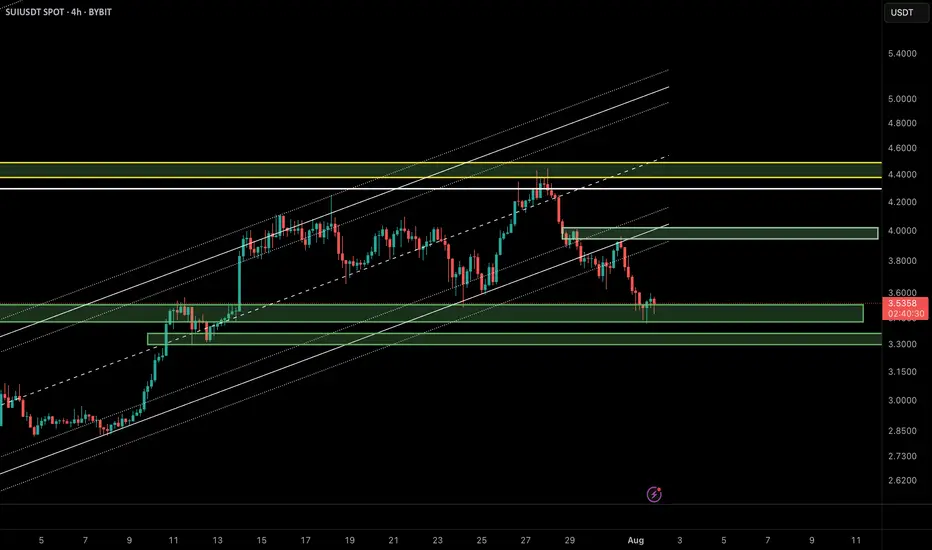
SUI/USDT Update – Bounce Setup from Demand Zone?In the previous analysis, we highlighted a short opportunity near $4.20, which played out perfectly. Now, SUI has reached a key demand zone around $3.40–$3.55, overlapping with the lower boundary of the ascending channel and a previously defined bullish order block.
🔹 Market Structure:
After breaking the bullish structure, price is now revisiting a major liquidity zone between $3.40 and $3.55.
🔹 Price Behavior:
Wicks to the downside suggest buy-side absorption and potential for short-term reversal.
🔹 Possible Scenario:
If the $3.40 zone holds, we could see a corrective move up to the supply zone around $3.90–$4.00.
📌 Key Levels:
• Support: $3.40–$3.55
• Resistance: $3.90–$4.00
❗️If the $3.40 support fails, bullish momentum will likely be invalidated in the short term.
🧠 Pro Tip (SMC-based):
When a demand zone aligns with liquidity sweep and channel support, it often becomes a high-probability area for institutional re-entries. Wait for a clear confirmation like BOS or bullish engulfing candle before entering.
⸻
🔗 Like, share, and follow for more Smart Money & Elliott Wave-based insights!
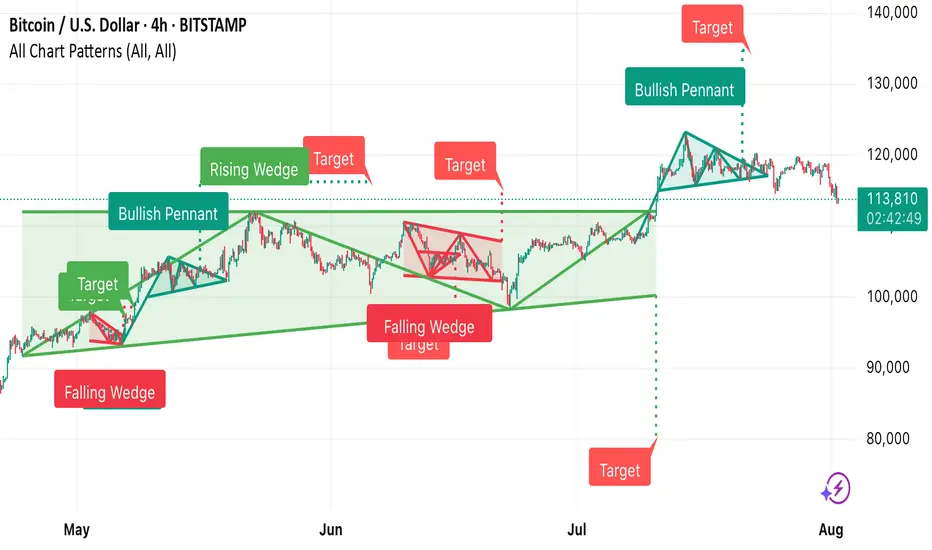
This Bitcoin 4-hour chart from TradingView shows multiple techni • Falling Wedge (early May) → Bullish breakout, target achieved.
• Bullish Pennant → Strong upward continuation.
• Rising Wedge (June) → Bearish breakdown, target met.
• Falling Wedge (mid-June) → Bullish breakout, target achieved.
• Bullish Pennant (late July) → Upward move toward the 140,000 target zone.
Currently, BTC is trading around 113,829, below recent highs, and near the dotted horizontal support zone from the last breakout.
#eth idea of short im already in it dyoreth/usd idea of short im already in it DYOR
wht im seeing eth give potentially much gains in this quarter
so its time to fill the remaining below and fullfill them
well im not financial advisor but here u can see to other dimention of digital silver
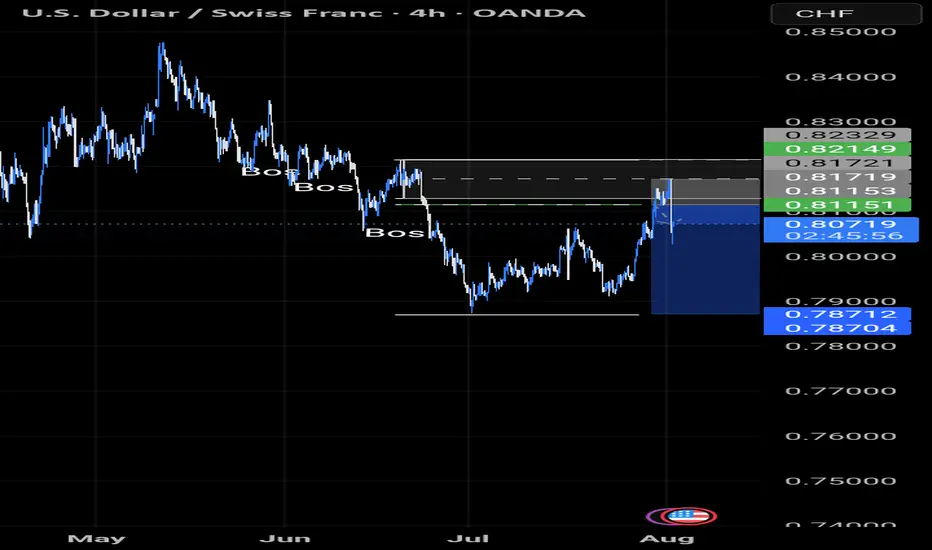
USDCHF TRADE IDEA We also had a pullback to our Fibonacci level from usdchf and we're going to the downside. Let's see how the market does it's thing
New targets for Reddit RDDT In this video I recap the previous reddit analysis where we looked for the long which is playing out really well .
I also look at the current price action and simulate what I think could be a target for the stock moving forward using Fib expansion tools as well as levels below for price to draw back too.
Welcome any questions below the chart . Thanks for viewing

Gold is significantly bullish, where can we short?The positive non-farm payroll report pushed the market from 3300 directly above 3330, demonstrating overall bullish momentum. Congratulations again, everyone. Real-time strategies are like a beacon guiding your investment journey. The market will never disappoint those who persevere and explore wisely. Charlie advises against blindly chasing highs. Trading advice (first hit is valid): Focus on key support levels: 3300 and 3310. Go long if these levels are reached.
~For those who want to go short above 3350-55, only use a stop-loss and feel free to try~ PEPPERSTONE:XAUUSD FXOPEN:XAUUSD ACTIVTRADES:GOLD FXOPEN:XAUUSD CMCMARKETS:GOLD VANTAGE:XAUUSD VELOCITY:GOLD
HYPE/USDT: "A++" Long Setup - A Perfect Storm of ConfluenceHello traders,
This analysis covers what I consider to be an "A++" high-probability long setup on HYPE/USDT, viewed on the 9H timeframe. It is rare to see this many powerful technical factors align at once, signaling a potential major bottom and the start of a new bullish leg.
1. Trend & Context (The "Why")
The price has pulled back into a critical zone where a confluence of price, time, and momentum indicators are all screaming bullish.
Here is the checklist of the extraordinary confluences:
1. Price Action (LSOB Demand): The primary signal comes from price action. The price has entered a major Bullish LSOB (Liquidity Sweep Order Block) on the 9H chart. This is a critical institutional demand zone where we expect strong buying interest.
2. Time-Based Confluence (Fibonacci Cycle): This is a unique and powerful confirmation. The potential reversal is occurring precisely on a 144 Fibonacci Time Cycle line. When a key price level aligns with a major time cycle, the probability of a significant market turning point increases dramatically.
3. Dynamic Support : The LSOB zone is also confluent with the EMA 200, adding another layer of strong dynamic support to this area.
4. Momentum Exhaustion (MC Orderflow): The momentum oscillator provides the final, undeniable confirmation:
The MC Orderflow itself is in the OVERSOLD zone on this 9H timeframe.
THE CRITICAL CONFLUENCE: The Multi-Timeframe Cycle Table shows that the 4H and Daily timeframes are BOTH "Oversold". This trifecta of oversold signals (4H, 9H, and Daily) is the highest level of momentum confirmation we can get.
2. Entry, Stop Loss, and Targets (The "How")
This powerful alignment provides a very clear trade plan with an exceptional risk-to-reward ratio.
Entry: An entry at the current price level ($38.50 - $39.30) is ideal, as it is directly within the LSOB demand zone.
Stop Loss (SL): $37.50. This places the stop loss safely below the entire LSOB zone and the recent swing low. A break below this level would invalidate this entire bullish structure.
Take Profit (TP) Targets:
TP1: $42.50 (Targeting the cluster of short-term EMAs, which will act as the first resistance).
TP2: $45.00 (The bottom of the Bearish LSOB supply zone, a major magnet for price).
TP3: $49.90 (The major swing high of the range, for a full trend continuation).
Conclusion
This is one of the highest-quality setups I've seen. The perfect alignment of a key price level (LSOB), a major time cycle (Fib 144), and multi-timeframe momentum exhaustion (4H & Daily Oversold) creates a textbook, high-conviction environment for a significant bullish move.
Disclaimer: This is not financial advice. This analysis is for educational purposes only. Always conduct your own research and manage your risk appropriately.

WXY structure with a double topTesla has been in a uptrend with a corrective structure WXY. I am not sure if the WXY is a part of wave 5 terminal structure or a B wave. However expecting a double top or 78.6 retrace to 425-430 range as a minimum. For this scenario, an impulsive upside move is expected within the next few weeks. However the price needs to move back into the channel next week as a first step.

CIRCLE Stablecoin Revolution Circle is more than a crypto firm—it’s building infrastructure for a regulated digital dollar economy. With transparent reserves, global licenses, deep financial integrations, and robust blockchain functionality, USDC is rapidly positioning itself as a cornerstone of future finance.
I see a longer term potential for a great investment opportunity given the coming banking revolution involving stable coins.
For a lower risk entry, after a nearly 40% decrease in less than a week, the stock price is currently supported at the VWAP from the original IPO release.
Should the trend continue higher, I would prefer to see a bounce here on the stock.

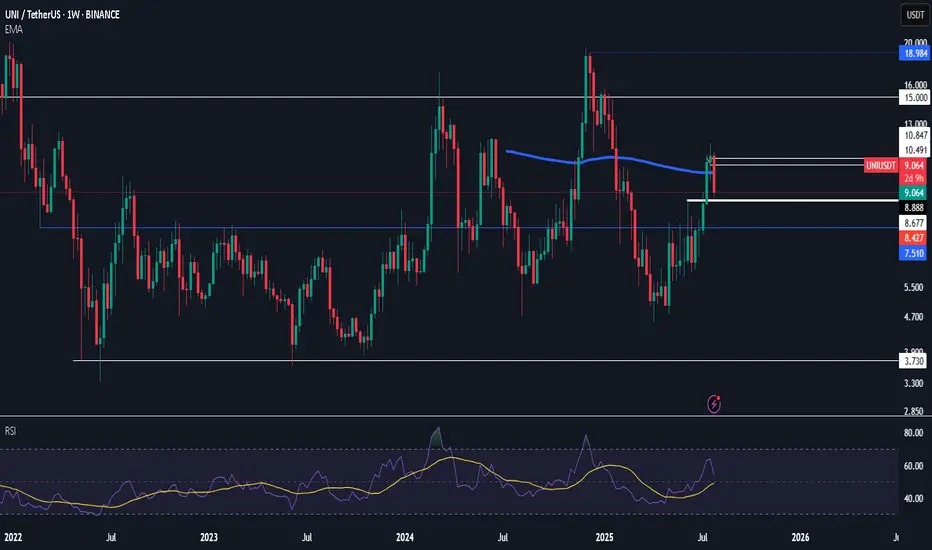
$uni stop a tad below white thick line
may or may not reverse this move by monday for now longing it and expecting dominance to roll over
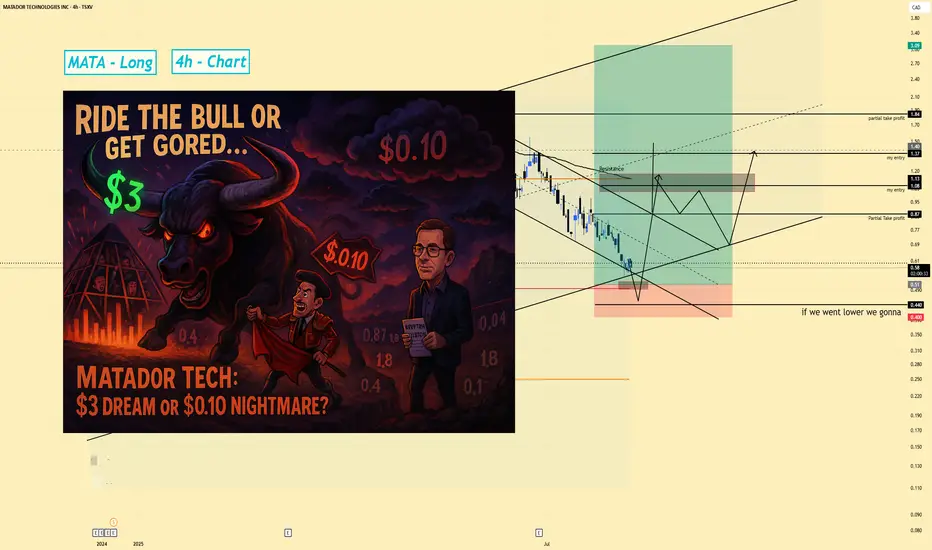
MATA | Long Swing Setup | Trapped Sellers (Aug 2025Matador Technology Inc. (Canada) | Long Swing Setup | Accumulation & Trapped Sellers (Aug 2025)
1️⃣ Short Insight Summary:
Matador Technology is an interesting small-cap play led by Mark Morris, who has a strong vision for tech innovation and market trends. Right now, price action shows signs of flushing out trapped traders, which could set up a big upside opportunity if we manage risk carefully.
2️⃣ Trade Parameters:
Bias: Long (Swing)
Entry: Watching accumulation zones between $0.50
Stop Loss: Below $0.40 (invalidates structure and opens downside risk)
TP1: $0.87 (initial target, partial exits recommended)
TP2: $1.80 (mid-term target)
Final TP: $3.00 (long-term aggressive target)
3️⃣ Key Notes:
Right now, the stock is extremely volatile. The goal is to buy where others are trapped and forced to sell. A clear break below $0.20 would be very dangerous and could push price as low as $0.10.
On the upside, we want to see the stock reclaim the $0.50 zone convincingly. This could build momentum towards $0.87 and beyond. Patience is key—this is a swing trade, not a quick scalp.
4️⃣ Follow-up:
I’ll monitor the price action around $0.40–$0.50 and update if we get a breakout from the current downtrend channel.
Please LIKE 👍, FOLLOW ✅, SHARE 🙌 and COMMENT ✍ if you enjoy this idea! Also share your ideas and charts in the comments section below! This is best way to keep it relevant, support us, keep the content here free and allow the idea to reach as many people as possible.
Disclaimer: This is not financial advice. Always conduct your own research. This content may include enhancements made using AI.
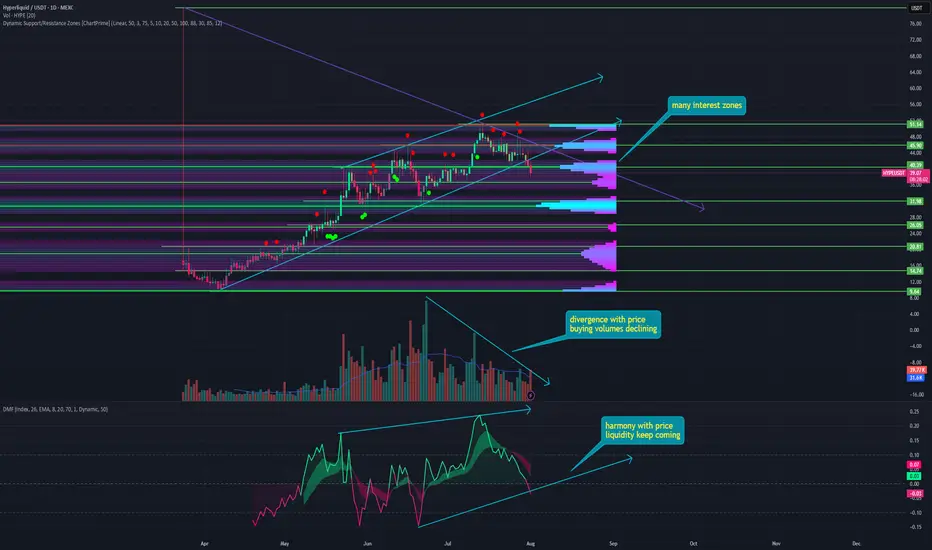
HYPE - a major correction can be expected One of the most interesting tokens of the HYPE cycle. It initially fell to zero, then rebounded and began to set new all-time highs one after another. During corrections, it even outperformed Bitcoin.
But all good things come to an end sooner or later, and for HYPE, the time has probably come to cool down, and here's why:
➡️ HYPE broke its ascending flag pattern for the first time in four months, signaling a potential trend reversal.
➡️ Throughout the last month, HYPE's growth has been accompanied by a divergence in purchase volumes, indicating declining interest from buyers.
➡️ Money Flow, although in harmony with the scene, began a major fix of positions at the last ATH of $51, and in just a couple of days, the indicator fell into negative territory. Potentially breaking through its sloping support.
➡️ The main areas of interest are at the top, apparently attracting limit orders for shorts. And the first major support level has already been broken at $40.
➡️ The next major support is at $30, where we can expect an upward rebound.
📌 Conclusion:
HYPE has been growing for a very long time, against all odds, against the entire market. And the moment had to come when profit-taking would begin. $50 is a major psychological level, and liquidity has begun to leak out noticeably.
So perhaps this stage is already upon us. But I would not rush to look for buying opportunities, even on the spot. The token is very young, and we do not yet know its real price; it has been both $50 and $9. It is worth giving it time to trade so that we can find out its fair price over time.
Good health and big profits to all! 🔥