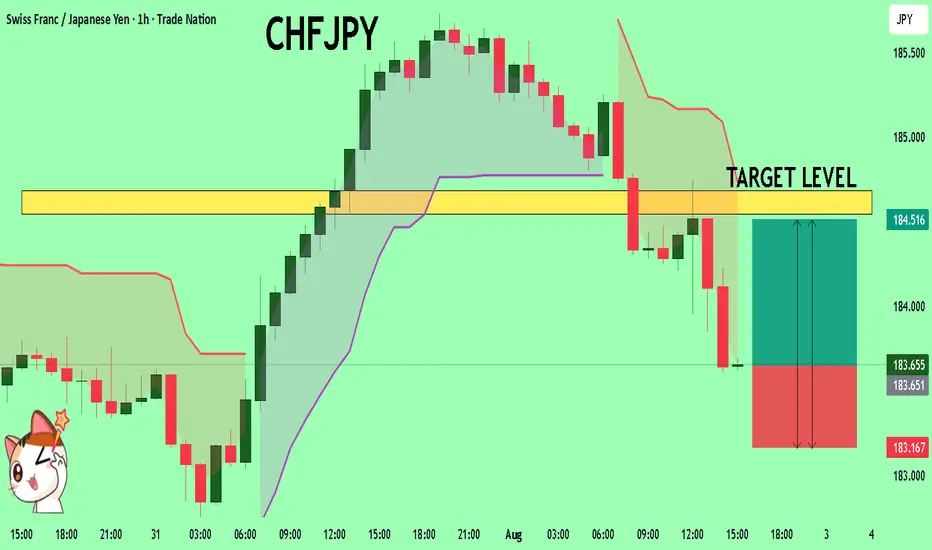
CHFJPY On The Rise! BUY!
My dear friends,
My technical analysis for CHFJPY is below:
The market is trading on 183.63 pivot level.
Bias - Bullish
Technical Indicators: Both Super Trend & Pivot HL indicate a highly probable Bullish continuation.
Target - 184.54
Recommended Stop Loss - 183.16
About Used Indicators:
A pivot point is a technical analysis indicator, or calculations, used to determine the overall trend of the market over different time frames.
Disclosure: I am part of Trade Nation's Influencer program and receive a monthly fee for using their TradingView charts in my analysis.
———————————
WISH YOU ALL LUCK
Community ideas
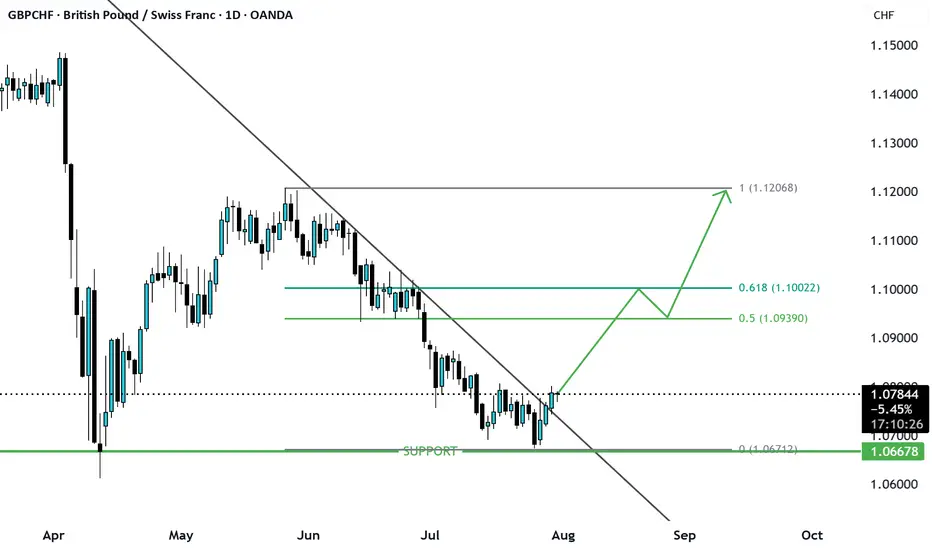
GBPCHF Break of trendline resistance GBPCHF has formed W pattern at the support and price looks to be reverses after the trendline resistance has been broken the first target will be the fib 0.5 of recent swing high if breaks down then it may go to Fib 1 . let us see
AUDUSD BUYBUY @0.64256
SL @0.64189
TP @0.64591
If SL hits by a candle sweep and closed above the entry level again buy....
And always risk 1%

TSLA LONGQuite a simple set up. Confirmation is still needed on 3d, and daily. Bullish candles and volume is desperately needed for validation of symmetrical setup.
Volatility incoming. Break of ATH with strength leads to price discovery into $500+.

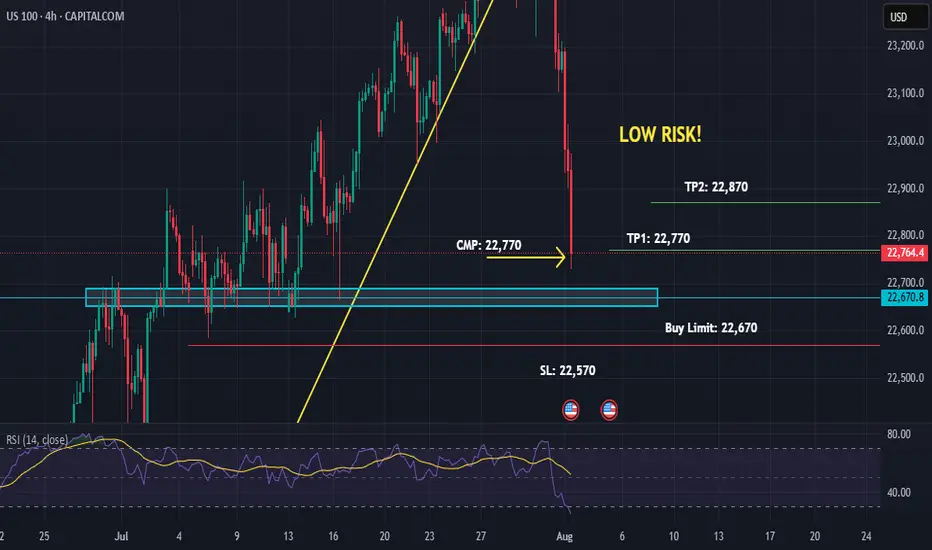
US100 Buy-Limit on Support 4HUS100 Buy-Limit on Support 4H
01-08-25
06:57 PM
Low Risk Trade because market is bearish!
DJ30/US30 LONG Reason for trade:
1. Expanding flat in play
2. Equal highs (LIQUIDITY)
3. Currently at the order block area (Ready)
Entry: 43647
Stop Loss: 43386
Take Profit: 45246
Strategy: Wait for a 30 minute engulfing candle closure.
Once in profit of 1:1 R, place the trade at BE
Blessings, in CHRIST.

Xlm -Just hit my T2 target7/23- My first post
-Xlm was $.42
7/24- T2 (top of range) hit $.4
7/27-Pumped 15%
as anticipated
8/1 -T2 bottom Hit (WT)
Could go lower and hit WT Low...
But I love it when a plan comes together.
I hope my T3 doesn't get hit (after this bounce).
May the trends be with you.

Target Calls $100 CallsTGT Technical Breakdown — August 1st
Target (TGT) remains within a well-defined ascending channel that began forming around April 9th, showing a consistent pattern of higher highs and higher lows. Today, price action has touched the lower trendline support of this channel near $99.50, which also coincides with a key psychological level.
While this area has historically attracted buyers, yesterday’s post-earnings reaction, which saw the stock fall several points, raises major concern about potential bearish sentiment in the short term. This makes the next move crucial.
Trade Plan & Critical Levels
🔎 Entry Trigger: I’m not entering yet. My entry will only be considered at $100.55, and even then, only if the price breaks this level with conviction — specifically, I want to see a strong bullish "power candle" to validate buyer momentum.
🛑 Stop Loss: $97.50 — just below the current trendline and a key invalidation point for this bullish structure.
📈 Targets Upon Confirmation:
$103.63
$105.00
$107.00
$108.73
Summary
The structure is still bullish, but yesterday’s earnings-driven drop introduces caution. $100.41–$100.55 remains the "must-break" zone. If bulls can clear this level with strength, momentum could carry the stock to the above targets. Otherwise, failure to hold the $99.50 support could see a breakdown toward the $97.50 area or lower.

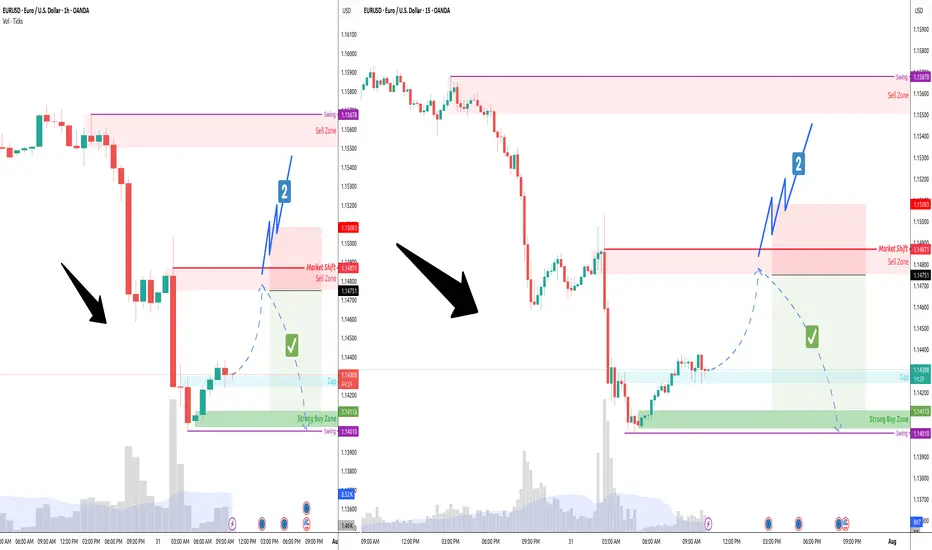
EURUSD 60/15 Pullback ShortOverall down trend. Now the price is located at the defending gap and stay above. Expected to break up and reach the sell zone then drop. Set alarm on lower sell zone and monitor.
LINKUSDT 12H#LINK has broken below the neckline of the double top pattern on the 12H timeframe.
📌 Place your buy orders near the key support levels:
$15.90 – $15.42
If the price reclaims the neckline and breaks above it, the potential upside targets are:
🎯 $18.96
🎯 $20.28
🎯 $21.54
⚠️ As always, use a tight stop-loss and apply proper risk management.

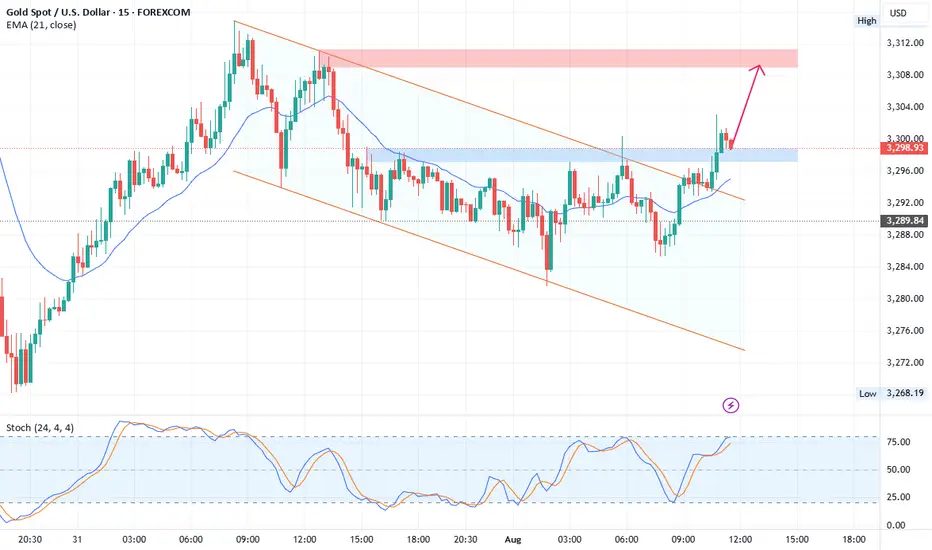
XAUUSDXAUUSD breakout falling channle and resistance zone.
Buy above 3295
Stop Loss: 3291
1st TP: 3308
2nd TP: 3313
3rd TP: 3322
4th TP: 3333
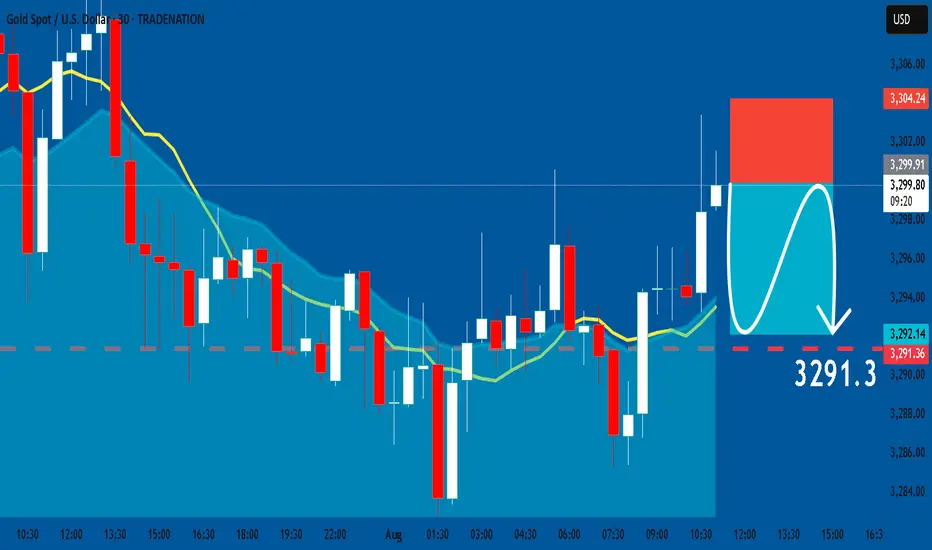
GOLD: Short Trading Opportunity
GOLD
- Classic bearish formation
- Our team expects fall
SUGGESTED TRADE:
Swing Trade
Sell GOLD
Entry Level - 3299.9
Sl - 3304.2
Tp - 3291.3
Our Risk - 1%
Start protection of your profits from lower levels
Disclosure: I am part of Trade Nation's Influencer program and receive a monthly fee for using their TradingView charts in my analysis.
❤️ Please, support our work with like & comment! ❤️

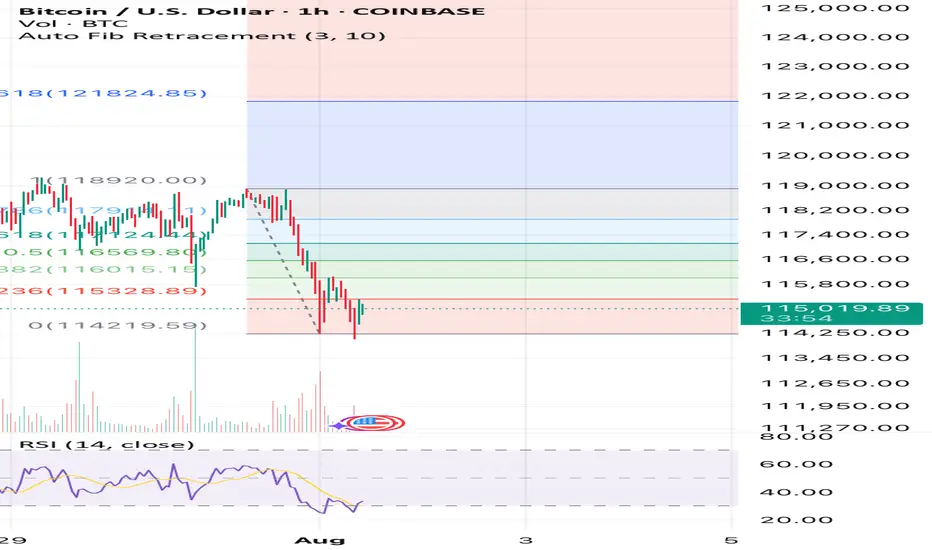
Bitcoin willIt hold if we stay above $115k ?? Fixing up last post I’ve deleted now as image was not good. Anyway simple RSI and Auto Fib Retrace with only general CRYPTOCAP:BTC market understanding backing this. This isn’t finacial advice at all. It’s pure speculation this post and anything related to it. I’m
Not a finacial advisor and I will not be held accountable for anyone’s actions that I didn’t do.
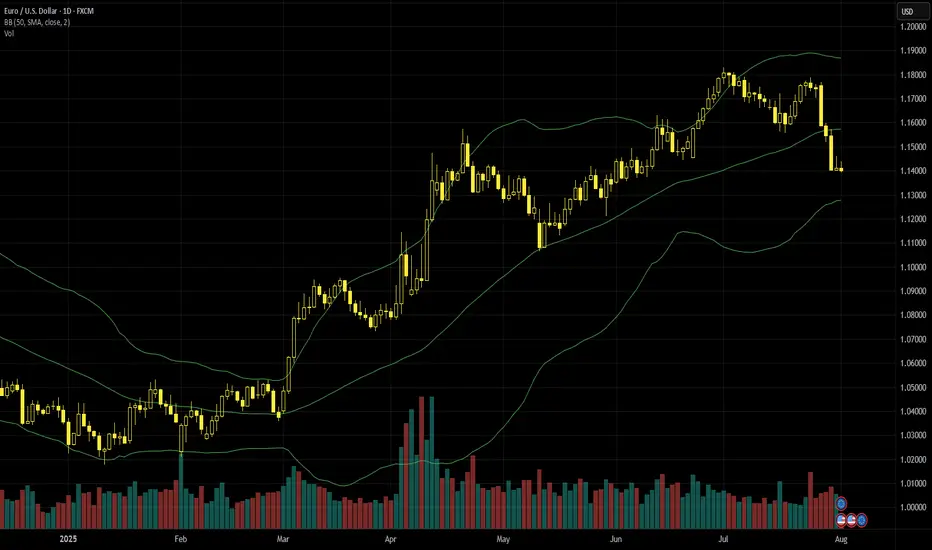
Euro-dollar retreats after the trade deal and divergent GDPEuro-dollar reached six-week lows on 1 August as traders continued to digest the trade deal between the EU and the USA which is widely viewed as being negative for the former. 30 July GDP releases from the eurozone and the USA also showed that American growth is much stronger, but eurozone-wide flash GDP for the second quarter was still slightly better than anticipated. The focus now turns to reactions to new tariffs and the NFP.
$1.14 looks like an important technical reference which might resist testing depending on the results of the job report. With fairly low volume relative to April’s peak and a clear oversold signal from the slow stochastic, a pause around here seems more likely than immediate continuation lower if considering only TA. 31 July’s near-doji slightly below the 100 SMA might suggest some demand for buying.
The obvious short-term resistance would be the confluence of the 50% monthly Fibonacci retracement and the 100 SMA around $1.147. The 61.8% Fibo slightly below $1.13 might be an area of support. Short-term performance depends primarily on the result of the NFP and the reaction to these; the consensus of 110,000 for total nonfarm seems too low relative to the average over the last several months, so a surprise higher might be more likely than lower.
This is my personal opinion, not the opinion of Exness. This is not a recommendation to trade.
Market Stuck in Limbo? XAGUSD Update & Likely Range AheadLet’s talk silver.
The market's clearly undecided — no real momentum, just hesitation.
We’re approaching overextended RSI levels, so don’t expect fireworks just yet.
Im Skeptic from Skeptic Lab and In this quick update, I’ll show you what I’m watching for both long and short triggers …
and why a range might dominate the next few days.
👉 Watch till the end to avoid getting trapped by fake breakouts.

GBPUSD long position 01/08/2025English : According to our analysis, we anticipate a bullish scenario.
Morocan Darija : kanchofo d'apres l'analyse dyalna antsanaw tloo3
ATENTION : I only share my ideas, not signals

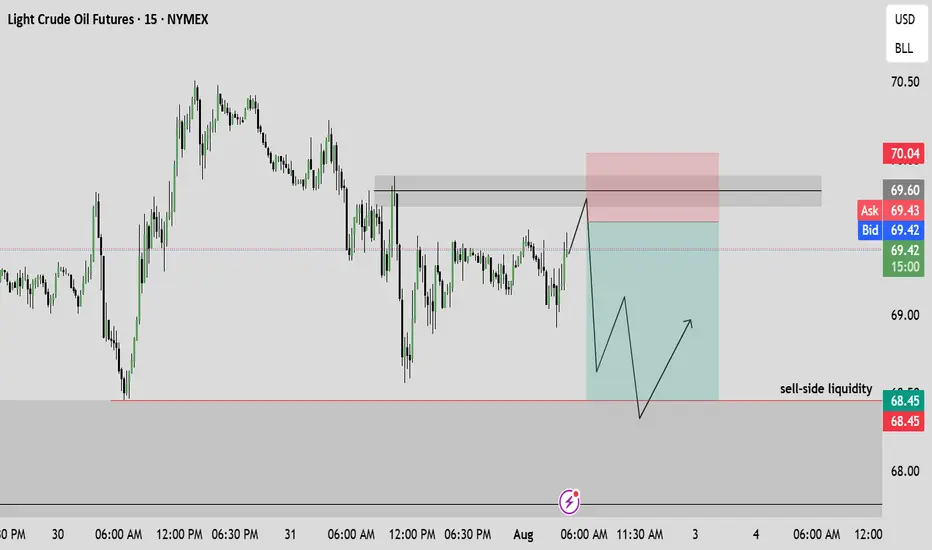
US OILShort term bearish view in US OIL, I want price to drop below the OLD Low before continuing the upside momentum
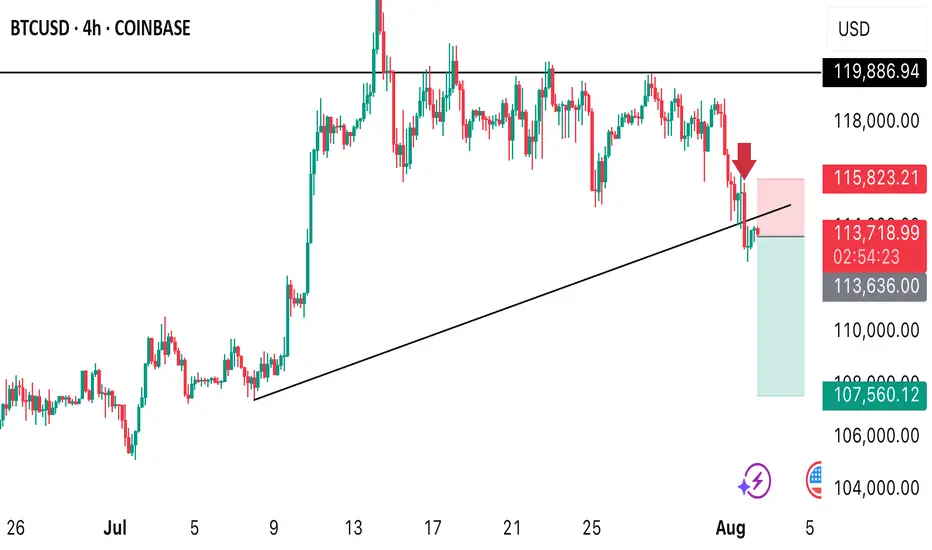
BTCUSD PRICE MIGHT FALL!Price has a high tendency to drop from the current price of 113k as trend breaks. I anticipate a sell opportunity from this market. My target profit level is 107k

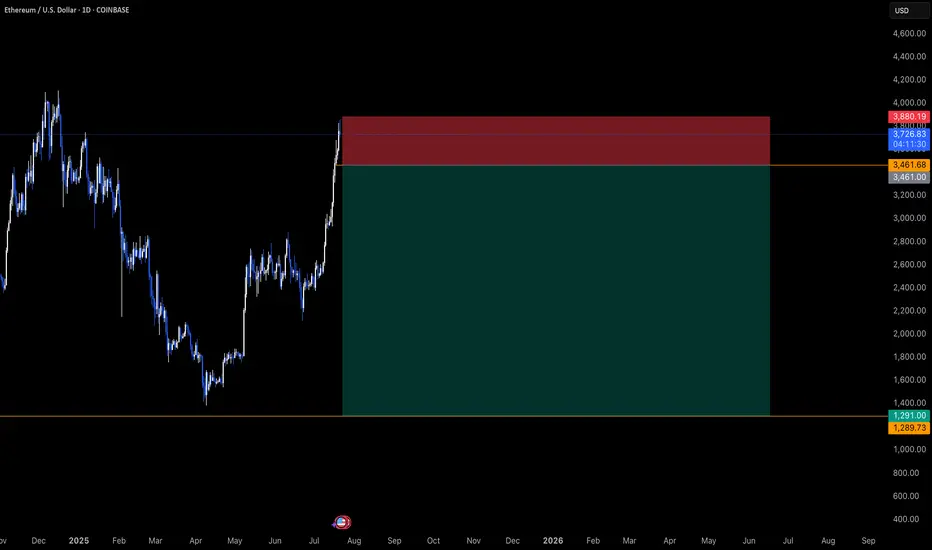
ETHUSD - CURRENT OUTLOOK ON ETHEREUMI am currently expecting the dollar to slowly regain strength, and while this is happen, I expect institutions/large funds to begin profit taking from these price ranges.
"May fortune attend thee, and thy trade prosper." .......L2Earned
GBP/USD: Post-Impulse Sell Setup from Ending DiagonalThe chart depicts a completed 5-wave impulsive structure, culminating at the top of wave (5). The internal wave structure of the final fifth wave forms a classic ending diagonal pattern, typically signaling a trend reversal or deep correction.
After this extended fifth wave, the price has started rolling over, confirming the start of a corrective decline. The wave count now expects an ABC correction targeting the previous wave 4/2 demand zone, highlighted in red.
Target 1 (T1): 1.33608
Target 2 (T2): 1.32436
Stop Loss (SL): 1.35988
Ending diagonal at the top of wave (5) signals exhaustion of bullish momentum.
Clear bearish divergence (not shown here) is commonly seen with this pattern.
The price has broken the short-term structure and is now forming lower highs.
Target zone aligns with previous wave 2 consolidation – a typical retracement zone for post-impulse corrections.

BTC Daily Elliott Wave CountAs mentioned in my analysis on youtube post on Total Market Cap short-term, the daily bullish case is now verified, canceling the bearish case with a break through the daily bearish invalidation level.
This past week price action suggests a move towards the completion of a blue wave x. Make sure to check out my latest analysis on short-term Crypto Total Market Cap.
The link to the chart:
Bullish Count
