Elliott Wave Analysis – XAUUSD August 1, 2025📊
________________________________________
🔍 Momentum Analysis:
• D1 Timeframe:
Momentum has reversed to the upside. Based on this signal, we expect a bullish trend to continue for the next 5 daily candles — likely until mid-next week.
• H4 Timeframe:
Momentum has also turned upward → This suggests that from now until the U.S. session, the price will likely continue to rise or consolidate with an upward bias.
• H1 Timeframe:
Momentum is currently turning down → We anticipate a short-term corrective move. We should wait for H1 to enter the oversold zone and give a bullish reversal signal before looking for long entries.
________________________________________
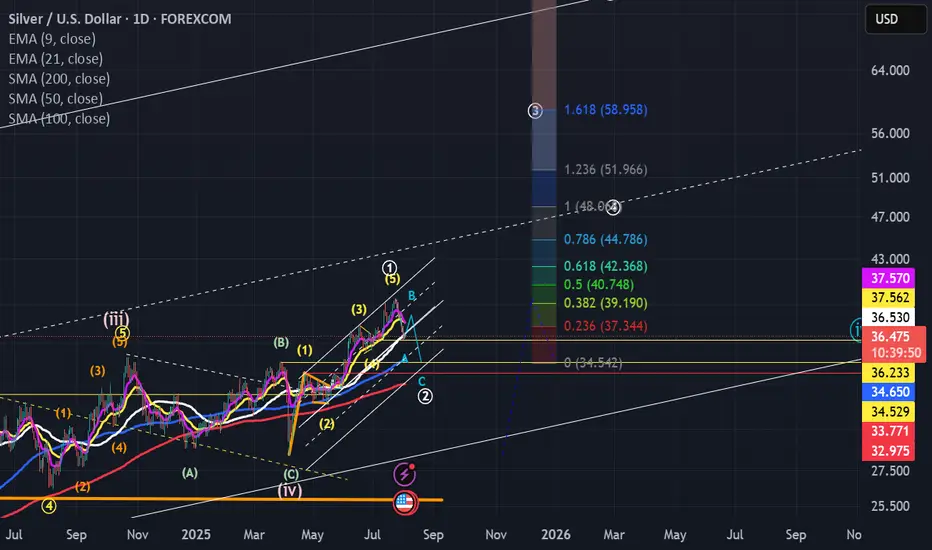
🌀 Wave Structure Analysis:
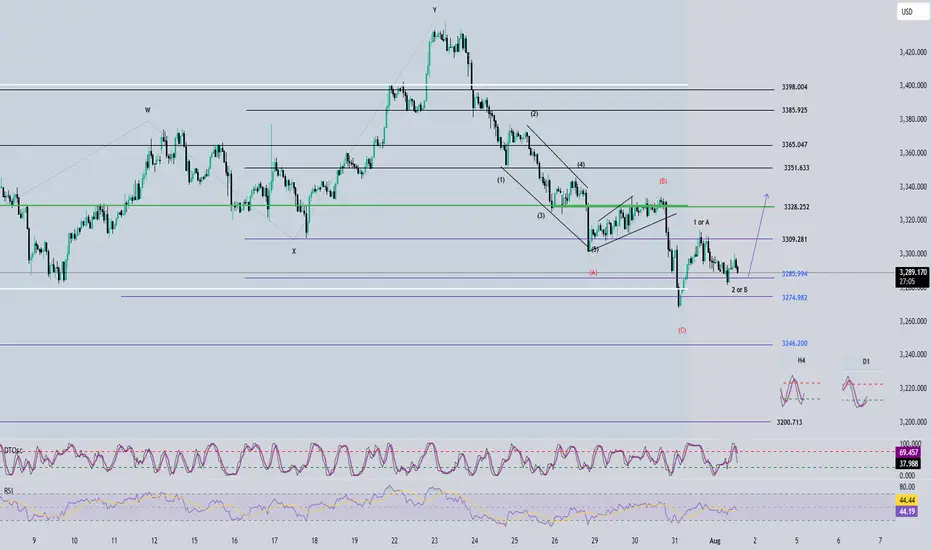
The current wave structure remains complex and lacks clear confirmation. Thus, the current wave labeling should be considered provisional. However, the wave count has not been invalidated, and D1 momentum supports a bullish outlook — so we continue to maintain our wave structure bias.
Important Note:
Wave (C) in red appears relatively short. This leaves open the possibility that the price may continue lower, targeting:
• ⚠️ 3246
• ⚠️ 3200
→ This scenario will be triggered if price breaks below 3268, especially given today's Nonfarm Payroll (NFP) report.
________________________________________
📌 Two Possible Wave Scenarios:
1. Scenario 1: Black Waves 1 – 2 – 3
o Wave 1 (black) is complete.
o We are now in Wave 2 (black) → Preparing for Wave 3.
o Wave 3 tends to be strong, impulsive, and sharp with large candle bodies.
o Target: 3351
2. Scenario 2: Black ABC Correction
o The market is currently in Wave B (black).
o Potential target for Wave C: 3328
________________________________________
🛡 Support Zones & Trade Strategy:
• Support Zone 1: 3290 → A good area for potential buying, but we must wait for H1 to enter the oversold region and show a bullish reversal.
• Support Zone 2: 3275 → Deeper buy zone if the price corrects further.
________________________________________
💡 Trade Plan:
📍 Option 1 – Buy Limit:
• Buy Zone: 3290 – 3289
• Stop Loss: 3280
• Take Profit 1: 3309
• Take Profit 2: 3328
• Take Profit 3: 3351
📍 Option 2 – Buy Limit:
• Buy Zone: 3275 – 3273
• Stop Loss: 3265
• Take Profit 1: 3309
• Take Profit 2: 3328
• Take Profit 3: 3351
________________________________________
📎 Notes:
• Experienced traders should wait for clear confirmation signals on H1 before entering trades.
• New traders may consider using limit orders in the proposed buy zones.
Community ideas
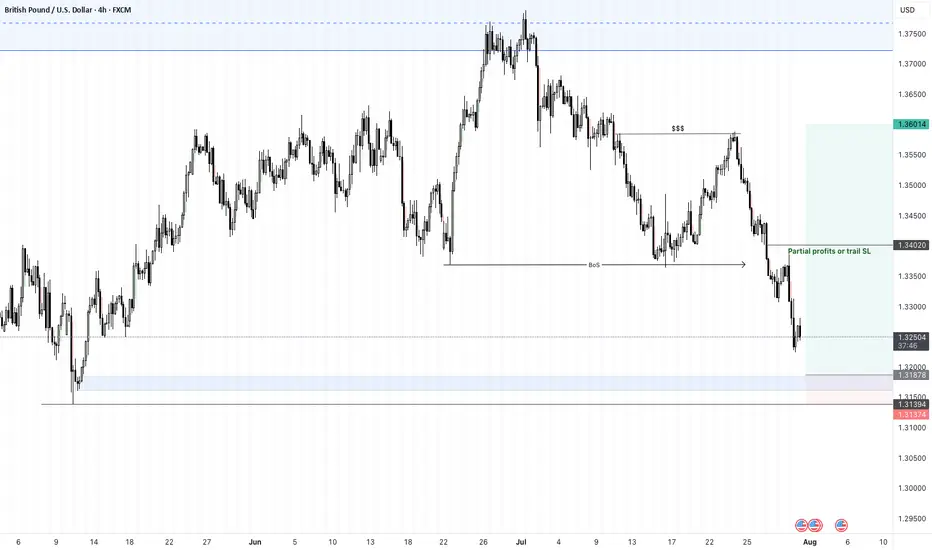
GBPUSD - 31/7/25 - Bullish reversalThe setup is not great, but im expecting a pull back on the dollar which should result in a bullish move on the GBP and EUR.
There is an extreme zone that i would like price to reach to with the possibility of not taking out the previous HL. But lets see.
+ve:
1. Extreme zone that resulted in the bullish move.
2. slight imbalance above the extreme zone
3. Dollar setting up for a pull back that will result in a bullish move on GBP
4. TP is just above the equal high liquidity zone
-ve:
1. close to the higher low and that may be swept
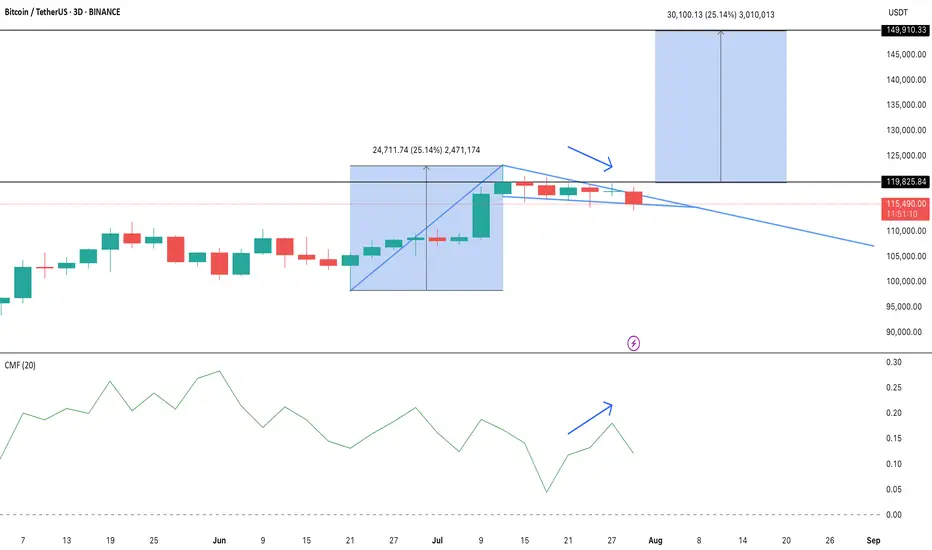
BTC/USDT Analysis – Bullish Pennant Holds Key to $150,000 TargetBINANCE:BTCUSDT is holding just above $115,000, recovering from a 2.4% dip in the last 24 hours, with one technical setup dominating the conversation: a bullish pennant on the 3-day chart.
The pattern formed after a sharp 25% rally earlier this month, creating a classic pole-and-pennant structure. Multiple breakout attempts have failed so far, with long wicks signaling heavy volatility, but the pattern remains valid as long as the BINANCE:BTCUSDT price stays above the $114,000 support zone.
A confirmed 3-day candle close above $119,700—the top of recent failed breakouts—would likely trigger the next leg higher. A measured move from the pole projects an upside target near $150,000, aligning with long-term bullish expectations.
Supporting this setup, the Fund Flow Ratio has been making lower highs, suggesting fewer coins are heading to exchanges and potential sell pressure is easing. At the same time, Chaikin Money Flow (CMF) on the 3-day chart is forming higher highs, signaling quiet accumulation despite recent price dips.
Until either level breaks, BINANCE:BTCUSDT trades in a pivotal range. Bulls want a clean breakout above $119,700, while a drop below $114,000 would invalidate the pattern and open the door to further downside.
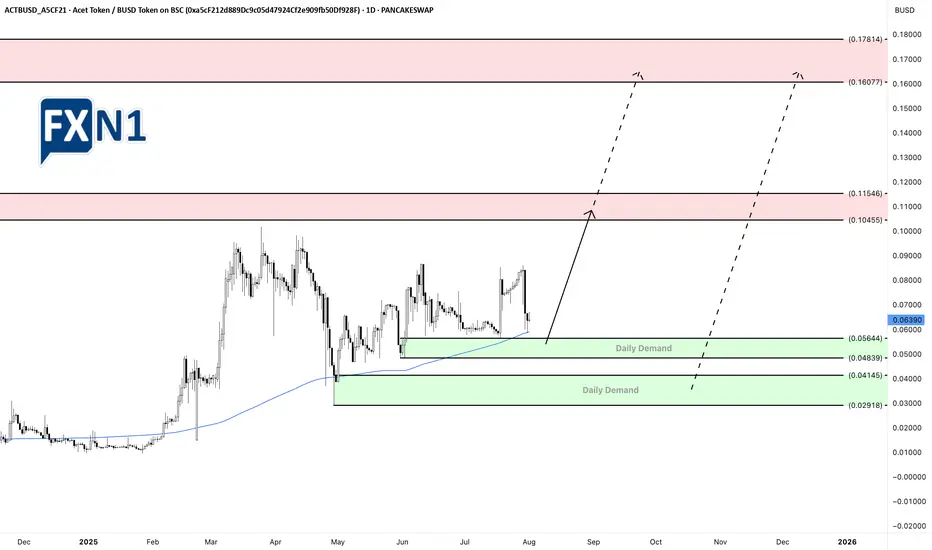
Acet Token’s Price Analysis: Levels and Future PotentialsThe Acet Token (ACT) is currently nearing a critical daily demand zone at 0.05644, suggesting a potential opportunity for a bullish move or a strategic entry at a discounted rate. Additionally, there is another fresh daily demand level at 0.04145, which could present an even more attractive entry point for those willing to buy at a lower price. Looking ahead, the token might retest higher levels around 0.10445, which stands as our primary target for future gains.
Acet (ACT) stands out in the crowded cryptocurrency field by pioneering the "Initial Zero Supply" model, aimed at tackling issues related to token oversupply. Developed by Thai trader and entrepreneur Acme Worawat, Acet is more than just a digital asset—it represents a movement towards integrating cryptocurrencies into larger economic systems. Built on Binance Smart Chain (BSC) and compliant with the BEP-20 standard, Acet employs a Zero Initial Supply strategy, where tokens are generated through Liquidity Mining. This process involves users staking assets in designated pools, with smart contracts ensuring transparent, secure, and efficient token issuance.
✅ Please share your thoughts about ACT in the comments section below and HIT LIKE if you appreciate my analysis. Don't forget to FOLLOW ME; you will help us a lot with this small contribution.
AUDCAD; Heikin Ashi Trade IdeaIn this video, I’ll be sharing my analysis of AUDCAD, using FXAN's proprietary algo indicators with my unique Heikin Ashi strategy. I’ll walk you through the reasoning behind my trade setup and highlight key areas where I’m anticipating potential opportunities.
I’m always happy to receive any feedback.
Like, share and comment! ❤️
Thank you for watching my videos! 🙏

Silver under pressure!Silver prices dropped sharply following a sudden plunge of over 20% in U.S. copper futures, triggered by a surprise decision from the Trump administration to cancel import tariffs on refined copper. This move caused turmoil in the markets and impacted related assets such as silver.
From a technical perspective, silver is trading in a general downtrend on the 4-hour chart, forming lower lows and lower highs, maintaining a bearish structure.
If the price rises to the 37.034 level, it is likely to reverse downward to continue the bearish trend, targeting the 36.45 and 35.60 levels in the medium to long term.
However, if the price climbs above 37.26 and closes a 4-hour candle above that level, the bearish scenario would be invalidated, and this breakout could signal a trend reversal from bearish to bullish.

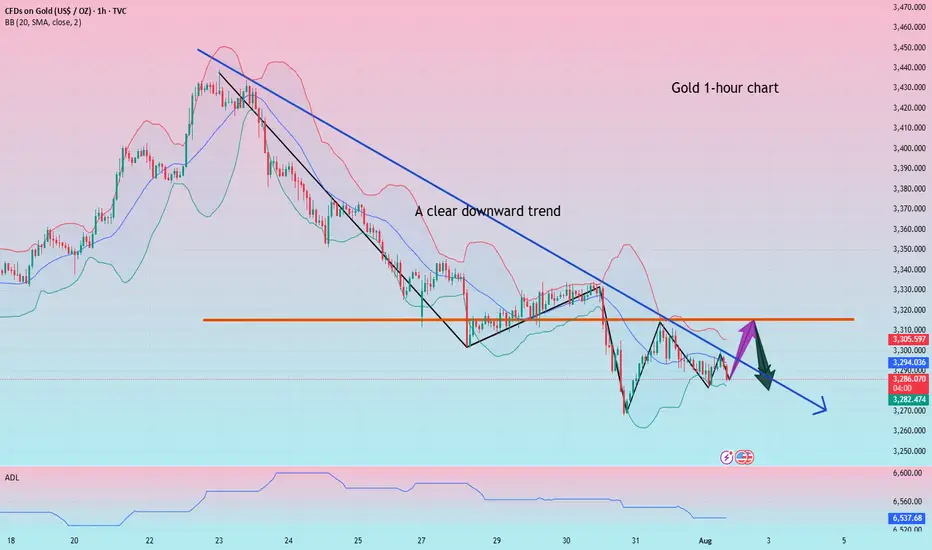
Gold rebound is weak, short below 3315
Gold remains weak, with multiple intraday rebounds failing to maintain momentum. The upper moving average continues to suppress the market, and the short-term market remains dominated by bears. Today, we are following the trend and taking a bearish stance. The key upside level is around 3315. If it reaches this level before the US market opens or if it peaks in the short term, we will short sell. The non-farm payroll data will be released today, and we will consider reversing our direction based on the situation after the data.
Gold prices have once again encountered resistance to their upward trend, and the volatile pattern continues. The gold price trend is trending lower highs, and today's low is expected to be lower than yesterday's. Therefore, our intraday short target could be 3268 or even lower, so it's crucial to seize the right entry point.
If you're new to the market, come to me. I'll teach you how to trade while you learn. If you're already in the market and struggling, come to me. I'll help you avoid repeating the same mistakes. If you've already experienced this market and are battered, come to me. I'm confident I can help you regain confidence. If you're stuck in a position, I'll develop a strategy tailored to your entry point. Because everyone's trapped positions are different, the solutions will vary, some suitable for conservative traders and others for aggressive ones. However, I can't offer a perfect answer to every situation. I suggest you bring your order with you. Once you contact me, I'll use the most appropriate method to resolve your situation and help you exit the market.
Specific Strategy
Short gold at 3315, stop loss at 3325, target at 3280
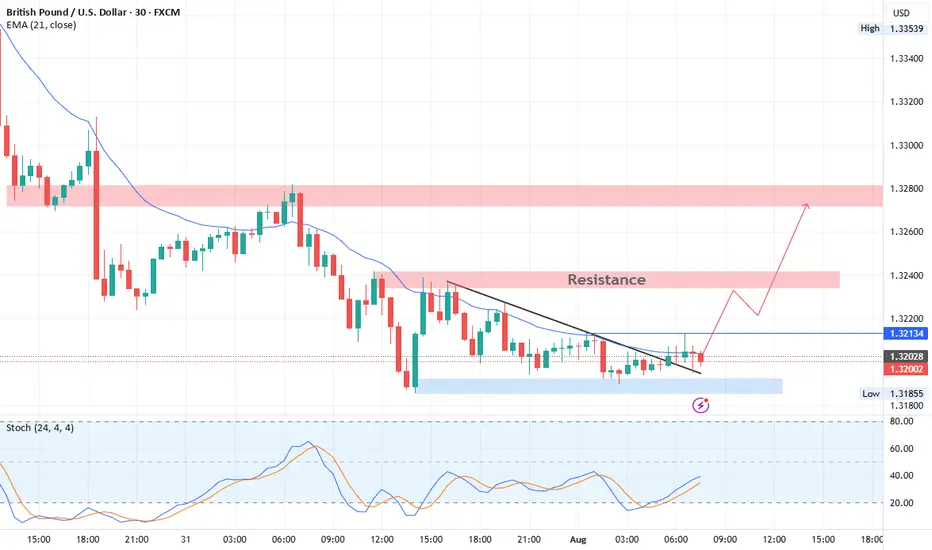
GBPUSD Technical BreakdownTrendline Breakout:
Price has decisively broken above a short-term descending trendline, signaling a potential shift in intraday momentum from bearish to bullish.
Support Zone (1.3185 – 1.3195):
This demand area has provided a strong base, with multiple successful rejections confirming buyer interest.
Resistance Levels:
Near-term resistance: 1.3213 (minor breakout level – watch for retest)
Key upside targets: 1.3240 followed by the major supply zone at 1.3275 – 1.3290
📈 Trade Outlook:
Bias: Bullish above 1.3213
Entry Idea: Look for bullish confirmation on a retest of 1.3213 as support
Targets:
TP1: 1.3240
TP2: 1.3275 – 1.3290
Invalidation: A sustained move below 1.3185 would invalidate the setup and reopen downside risk.
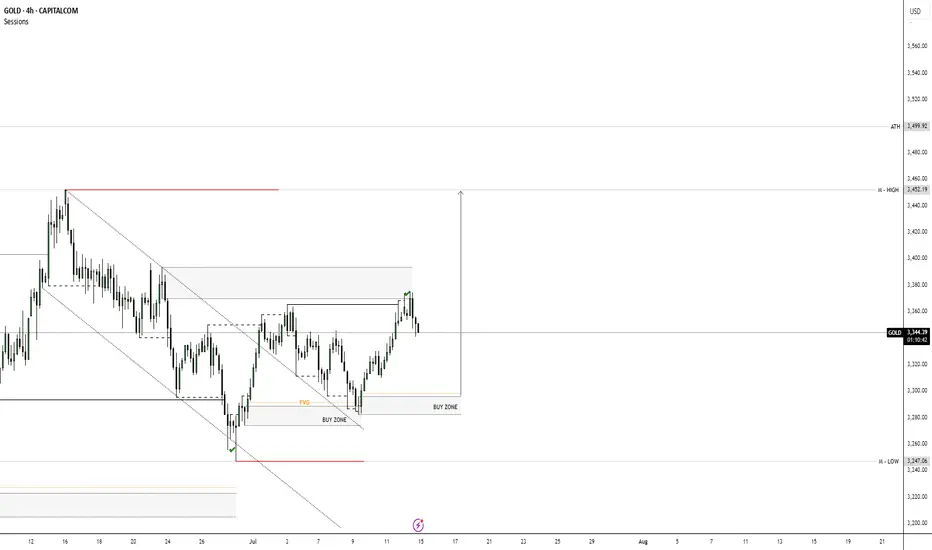
XAUUSD ANALYSYS 💸GOLD💸
Market Outlook: Bullish
• Price broke out of a downtrend channel and is now forming higher highs and higher lows — clear sign of a trend reversal.
• Current move is a pullback after a strong push up.
⸻
📍 Key Zones:
• Buy Zones and Fair Value Gaps (FVGs) are marked.
• These are areas where buyers may step in again.
• Price is pulling back into these zones — potential long entry area.
⸻
🎯 Target:
• The top red line marks a liquidity zone or resistance.
• Price is likely aiming to reach this area next.
⸻
📈 Trade Setup Idea:
• Buy on pullback to the FVG / Buy Zone.
• Stop Loss: Below the Buy Zone.
• Take Profit: At the previous high (resistance zone).
⸻
⚠️ Risk to Watch:
• If price breaks below the Buy Zone, bullish setup is invalidated — wait for new structure.
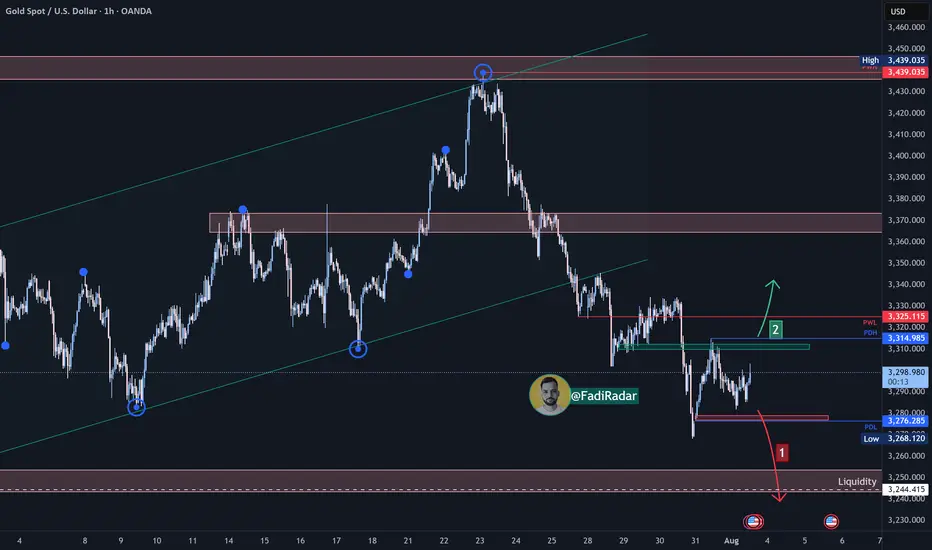
Gold (XAU/USD) Analysis:Gold remains in a downward trend and is currently moving sideways in a consolidation phase in the short term. The bearish outlook still dominates, with a potential move toward levels like $3,245.
1️⃣ A break and close below $3,276 may trigger a drop toward the strong support zone at $3,245.
2️⃣ However, if bullish momentum pushes the price above $3,310, this opens the path toward $3,330, a key level where a bearish rejection might occur.
📈 If the price holds above $3,330, a continuation toward $3,350 becomes likely.
⚠️ Disclaimer:
This analysis is not financial advice. It is recommended to monitor the markets and carefully analyze the data before making any investment decisions.
My alternate wave count for silverBelow is a slighly altered wave count for silver...it shows we have completed wave 5(yellow) which is a wave 1 (white) and are now in the process of working out wave 2 (white)...the first leg down (a) has just completed...and wave b of the ABC should start and complete over the next few days...follwed by one more low (wave c)...around the $34-$34.50 area.
I do not expect a move below $34 due to all the support on the chart at this level (look left and you will see that the $34 was a major prior resistance zone...when resistance is broken it becomes support.
If this count is the correct one (again it is my alternate to the one posted previously), it meas a bit more patience is required over the next few weeks...before we see a major move up (above $50) will start.
BTCUSD – Bullish Recovery Setup Forming Near Trendline Support🧠 Market Structure & Technical Breakdown
The BTCUSD 4H chart showcases a well-formed descending triangle or falling wedge structure with clearly respected major and minor descending trendlines. Currently, price action is testing a dynamic support zone, highlighted in green, which has been a strong reaction area in the past.
This area aligns with a bullish accumulation zone, from which buyers have previously stepped in to initiate impulsive moves. Given the confluence of diagonal support and horizontal price reactions, we may be on the verge of a bullish breakout opportunity.
📍 Key Zones & Trendlines
✅ Green Support Channel (Demand Zone): Acting as a key pivot for multiple recent rejections, this area (~114,000–113,000) is now being revisited again, offering potential buy interest.
📉 Minor Trendline: A short-term descending resistance around 120,000—likely the first barrier in case of a bounce.
📉 Major Trendline: A more extended dynamic resistance line connecting swing highs, currently intersecting near the 124,000 region.
🔄 Potential Price Scenarios
Primary Bullish Setup (MMC Plan):
Price bounces off the green demand zone.
Breaks above the minor trendline (~120K).
Pullback retest to confirm breakout.
Continuation toward the major breakout level (~124K and beyond).
Invalidation / Bearish Case:
A clean breakdown below 113,000 with strong bearish momentum would negate this setup, likely targeting the psychological support near 110,000.
🧠 MMC Mindset: Trade with Patience & Confluence
This is a classic accumulation-to-breakout scenario. Smart traders wait for confirmation—especially as BTC often exhibits false breakdowns before a major move. Monitor candle behavior, volume, and reaction to the minor trendline.
Let the market show signs of strength (like bullish engulfing, pin bars, or a breakout-retest) before committing to the upside. Avoid FOMO; the key is discipline and precision entry at structural break points.
✅ Trade Plan Summary:
Watch zone: 113,000–114,500 for bullish price action
Breakout level: Minor trendline (~120,000)
Target zone: 123,500–124,000 (Major resistance)
Stop-loss idea: Below 112,800 (Invalidation of structure)

ETHUSD BROKE THE LOWER BORDER OF THE WEDGE. PRICE IS MOVING TOWAETHUSD BROKE THE LOWER BORDER OF THE WEDGE. PRICE IS MOVING TOWARDS THE LOCAL SUPPORT.
Yesterday, Ethereum saw its largest monthly increase since July 2022, thanks to strong inflows into exchange-traded funds and increased activity in the Ethereum treasury. US exchanges are working to obtain regulatory approval for a standardized framework for listing crypto funds. Coinbase and JPMorgan have joined forces to provide Chase customers with access to crypto products.
Despite these positive developments, the short-term outlook does not indicate a bullish setup. It appears that all the information has already been factored into the price. The pair moves towards the local support of 3,500.00. However, in the long term, these developments are favorable for investment.

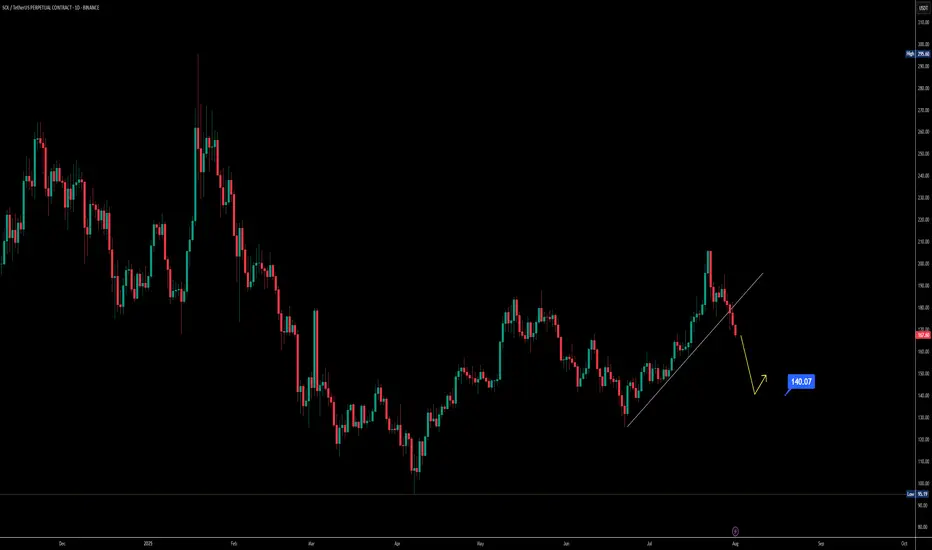
$SOL Loses Key Support | Eyes on $140 & $95 Zones📉 CRYPTOCAP:SOL Loses Key Support | Eyes on $140 & $95 Zones
🕵️♂️ On the daily timeframe, #Solana has officially lost its key support near $140, which previously acted as a strong bounce zone. A failure to reclaim this level could open the gates for a deeper drop toward the $95–$100 support range.
📊 Indicators signal downside:
RSI is trending downward
MACD shows a bearish crossover
Stochastic RSI confirms continued selling pressure
⚠️ Macro pressure adds fuel to the fire: August 1st tariff tensions, with expected news from Trump on charging Paris, are weighing down global risk assets. Historically, August tends to be a bearish month for crypto markets.
🎯 Key Levels to Watch:
Immediate Resistance: $140
Major Support: $95–$100
🧠 Trade wisely and manage risk accordingly.
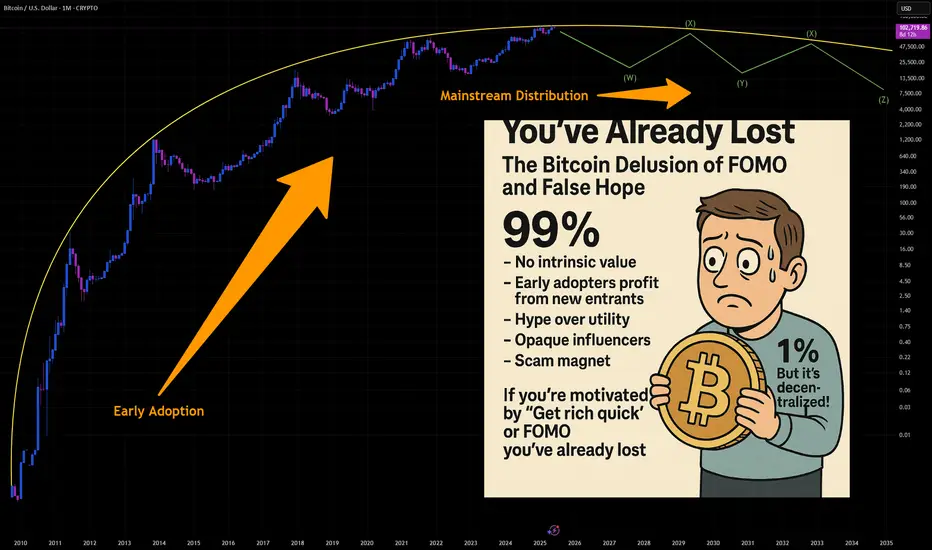
You've Already Lost: The Bitcoin Delusion of FOMO and False HopeLet’s get one thing straight: if you’re staring at Bitcoin, squinting past the red flags, and convincing yourself it’s not a Ponzi scheme because of that one shiny feature that screams “legit,” you’re not investing—you’re auditioning for the role of “next victim.” And if your motivation is the fear of missing out (FOMO) or the fantasy of getting rich quick, well... congratulations. You’ve already lost.
The 99%: Red Flags Waving Like It’s a Parade
Let’s talk about the indicators—the ones that make Bitcoin look suspiciously like a Ponzi scheme. No, it’s not technically one, but the resemblance is uncanny:
- No intrinsic value: Bitcoin isn’t backed by assets, cash flow, or a government. It’s worth what the next person is willing to pay. That’s not investing. That’s speculative hot potato.
- Early adopters profit from new entrants: The people who got in early? They’re cashing out while newcomers buy in at inflated prices. That’s the classic Ponzi dynamic: old money out, new money in.
- Hype over utility: Bitcoin’s actual use as a currency is minimal. It’s slow, expensive to transact, and volatile. But hey, who needs functionality when you’ve got memes and moon emojis?
- Opaque influencers: From anonymous creators (hello, Satoshi) to crypto bros promising Lambos, the ecosystem thrives on charisma, not accountability.
- Scam magnet: Bitcoin has been the currency of choice for over 1,700 Ponzi schemes and scams, according to a University of New Mexico study cs.unm.edu . That’s not a coincidence. That’s a pattern.
The 1%: The “But It’s Decentralized!” Defense
Ah yes, the one redeeming quality that Bitcoin evangelists cling to like a life raft: decentralization. No central authority! No government control! It’s the financial revolution!
Except… decentralization doesn’t magically make something a good investment. It just means no one’s in charge when things go wrong. And when the market crashes (again), you can’t call customer service. You can tweet into the void, though.
FOMO: The Real Engine Behind the Madness
Let’s be honest. Most people aren’t buying Bitcoin because they believe in the tech. They’re buying because they saw someone on TikTok turn $500 into a Tesla. FOMO is the fuel, and social media is the match.
Bitcoin’s meteoric rises are often driven by hype cycles, not fundamentals. Tesla buys in? Price spikes. El Salvador adopts it? Price spikes. Your cousin’s dog walker says it’s going to $1 million? Price spikes. Then it crashes. Rinse, repeat.
This isn’t investing. It’s gambling with a tech-savvy twist.
The Punchline: You’ve Already Lost
If you’re ignoring the overwhelming signs of speculative mania and clinging to the one feature that makes you feel better about your decision, you’re not ahead of the curve—you’re the mark. And if your motivation is “I don’t want to miss out,” you already have. You’ve missed out on rational thinking, due diligence, and the ability to distinguish between innovation and illusion.
Bitcoin might not be a Ponzi scheme in the legal sense. But if it walks like one, talks like one, and makes early adopters rich at the expense of latecomers… maybe it’s time to stop pretending it’s something else.
INDEX:BTCUSD NYSE:CRCL NASDAQ:HOOD TVC:DXY NASDAQ:MSTR TVC:SILVER TVC:GOLD NASDAQ:TSLA NASDAQ:COIN NASDAQ:MARA
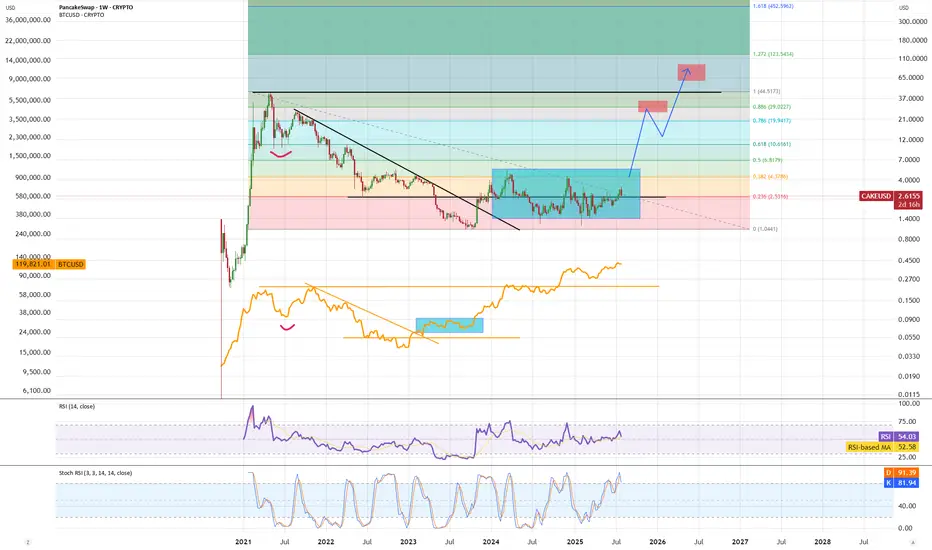
CAKE - positive signs for move upCAKE is still in accumulation range. When looking at pattern we see similarities with BTC where CAKE has completed 1st impulse from the bottom and as long as we stay above fibb 0.236 S range we are ready for next impulse moving price higher, going for test of fibb 0.886 range where a bit of consolidation and then wick to new ATH to complete bigger impulse up.
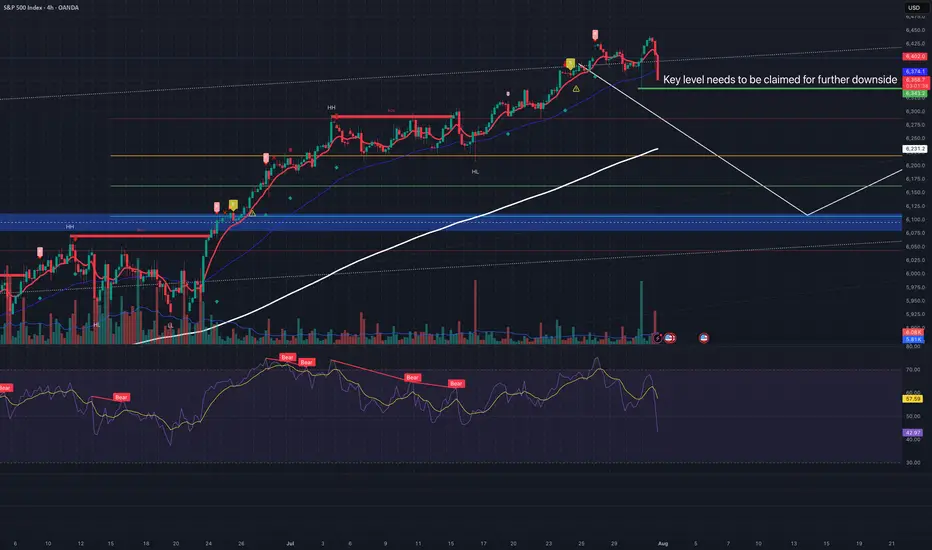
SPY and its games -FOMC buy level needs to be taken out After 3 days of back and forth, the trend line is the deciding factor for me on the bearish bias.
Once the FOMC buy level is taken with at least 4hr closure, sellers are in control.
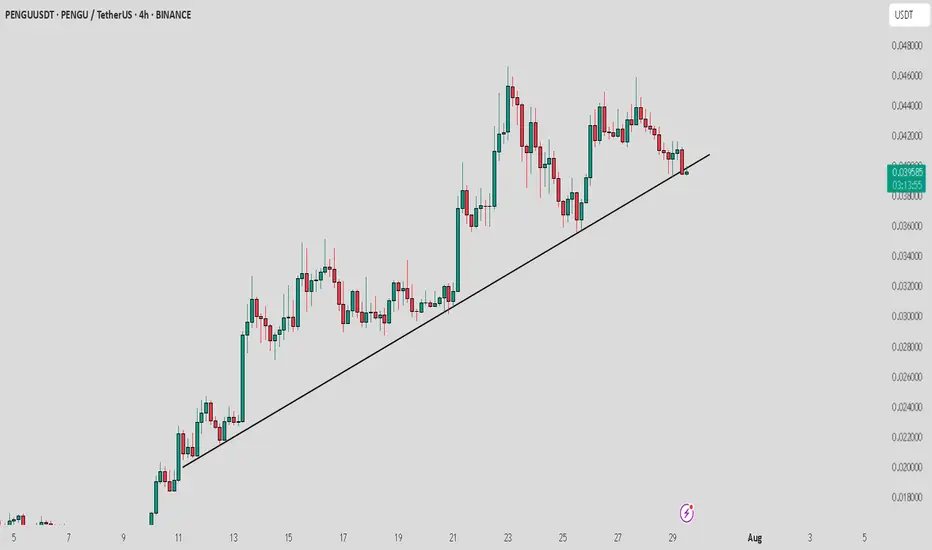
PENGU / USDT : Breaking down from Trendline supportPENGU/USDT is breaking down from the trend line support, but the retest is still in progress. Watch for rejection at key levels.
Pro Tip: Wait for confirmation of rejection before entering the trade and always apply proper risk management to safeguard your position.
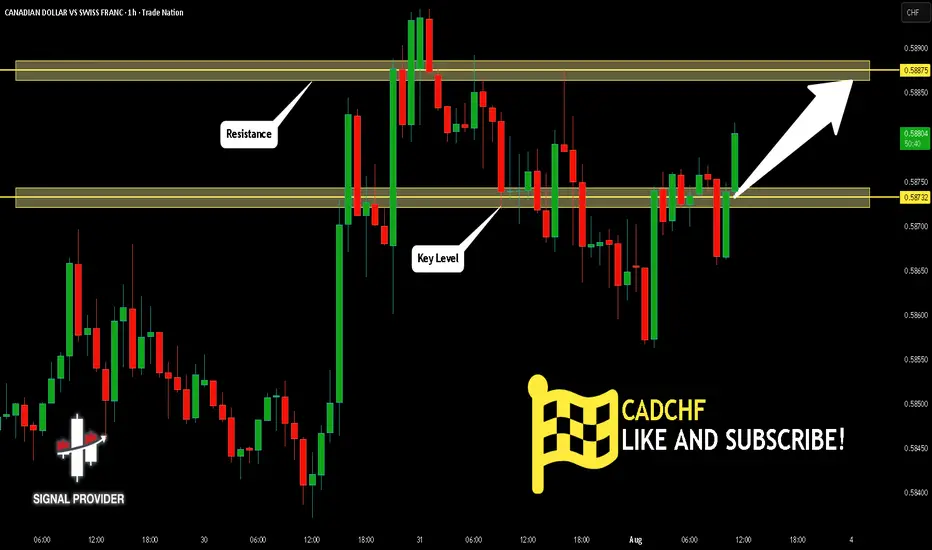
CADCHF Will Grow! Long!
Please, check our technical outlook for CADCHF.
Time Frame: 1h
Current Trend: Bullish
Sentiment: Oversold (based on 7-period RSI)
Forecast: Bullish
The market is trading around a solid horizontal structure 0.587.
The above observations make me that the market will inevitably achieve 0.588 level.
P.S
Please, note that an oversold/overbought condition can last for a long time, and therefore being oversold/overbought doesn't mean a price rally will come soon, or at all.
Disclosure: I am part of Trade Nation's Influencer program and receive a monthly fee for using their TradingView charts in my analysis.
Like and subscribe and comment my ideas if you enjoy them!
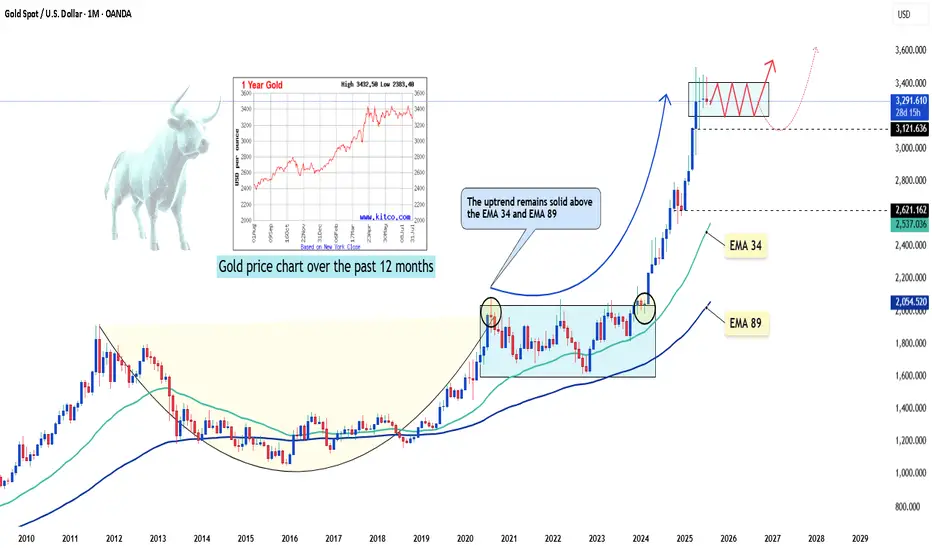
XAUUSD – the calm before the next breakout?Hello traders, what’s your take on the current trend in OANDA:XAUUSD ?
Looking back over the past 12 months, gold has delivered a truly impressive performance. From around $2,380 in August 2024, the precious metal surged to an all-time high of $3,432 by April this year — a gain of more than $1,000 in less than a year. But what’s more telling than the rise itself is how the market behaved afterward: instead of crashing, gold has maintained a high consolidation range, suggesting the uptrend is still very much alive.
This powerful rally didn’t happen in isolation. In a world marked by uncertainty, gold has once again asserted its role as a safe-haven asset. Inflation remains persistent across major economies, geopolitical tensions continue to stretch from Eastern Europe to the Middle East and Asia, and de-dollarization efforts by countries like China and Russia are reshaping global capital flows. None of these events alone could shake the markets, but together, they have laid the groundwork for gold’s sustained relevance.
From a technical standpoint, the long-term bullish structure remains intact. Following its peak at $3,432, gold has entered a modest correction phase — one that may well be a healthy consolidation before the next directional move.
Interestingly, while many investors remain cautious, the chart paints a different story: a market that isn’t afraid, but simply catching its breath. The real question is no longer “Can gold hold above $3,400?” but rather “Is the market gearing up for a fresh breakout — or a deeper correction?”
We may not be able to predict the future, but we can observe how price reacts at key levels. And sometimes, it’s in these seemingly quiet phases that the biggest turning points begin to form.
What do you think — is gold preparing for another leg up?
Drop your thoughts in the comments below! 👇
BTCUSD Short Setup – 4H Bitcoin has broken below a key dynamic support zone, and current price action signals a potential continuation to the downside. This short entry is supported by multiple technical confluences:
🔻 Bearish Confluences:
Fibonacci Retracement Rejection: Price rejected the 61.8% Fib retracement zone near $114,978, confirming a potential local top.
Trend Structure: Clear lower high, lower low structure forming on 4H – momentum favors sellers.
EMA Cloud Pressure: Price is decisively below the multi-band EMA cloud, showing sustained bearish pressure and trend bias.
Volume Profile Gap: Price is entering a low-volume node between $113.8k and $112k, increasing likelihood of a sharp move down.
Bearish Candlestick Pattern: A strong bearish engulfing candle formed after the retracement – a classic reversal confirmation.
🎯 Fibonacci-Based Targets:
TP1 – $11205 (38.2%): Initial demand zone and minor support.
TP2 – $11024 (61.8%): Mid-extension level, aligns with prior consolidation.
TP3 – $10731 (100%): Full measured move target if the downtrend accelerates.
SL: Placed just above the recent swing high at $11678, protecting against false breakouts.

