#BTC Update #14 – Aug 02, 2025#BTC Update #14 – Aug 02, 2025
Unfortunately, Bitcoin has closed below its current channel and now appears to be retesting that level. If this retest confirms, I expect a pullback down to the $110,000 zone. However, if Bitcoin manages to re-enter the channel, its first target will be $118,800. Although it’s a descending channel, moving within it suggests a relatively stable market. Closing below it may not end well and could deepen the retracement. That's why I recommend caution with all coins right now.
Even though it seems like a distant possibility at the moment, don’t forget there’s also an imbalance zone around the $103,500 level. A sharp wick or a significant drop could bring Bitcoin back to revisit that area. The probability is currently low, but it can’t be ruled out completely. I don’t recommend rushing into any long or short positions at this stage.
Community ideas

XRP VS AI ?Hi,
This is fun, come on XRP $4.95
Average Speed (Points/Day) 0.053
Retracement Amount (Points) 0.80
Retracement % 51.28%
Probability of Retracement % 5-10%
Projected Next Move Size (Points) 2.09
Next Projected High Price 4.95
Estimated Duration to Next Target 39.4 days
Projected End Date 2025-09-10
All the best
Not a guru

SOL Sol next move idea.
Sol's final leg down before the final leg up for this bullrun. Fill the daily imbalances come to 70 % fib retracement level also a volume POC on a discount area below 50% of the dealing range and the daily trendline.

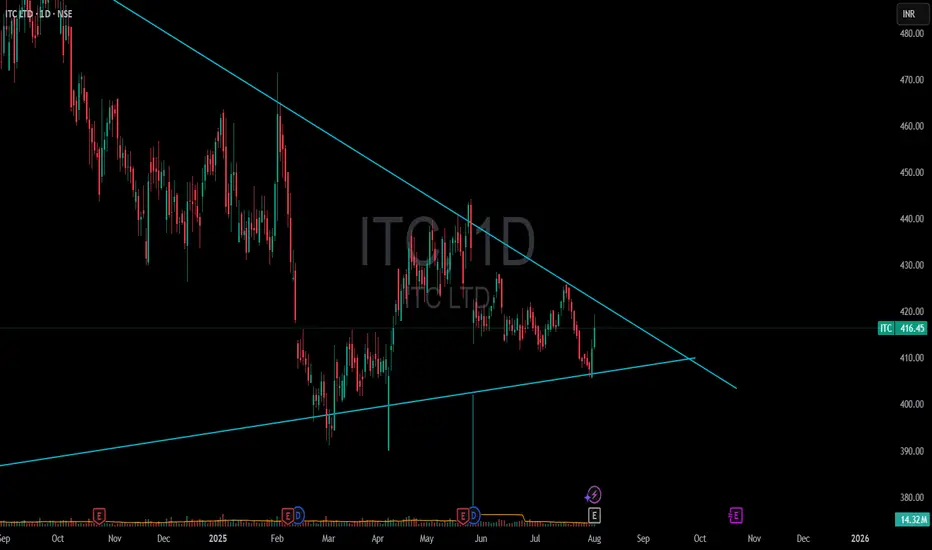
ITC 1D🔺 Triangle Pattern (likely Symmetrical/Ascending Triangle)
Current Price Zone: ₹416
Pattern Type: Likely Ascending Triangle (if higher lows are forming against a horizontal resistance)
Resistance Level: Around ₹416–420
Breakout Confirmation: Needs a strong bullish candle above resistance with significant volume.
📊 What to Watch:
Volume:
A genuine breakout should happen with above-average volume. Watch the 50-period or 20-period average volumes on daily or 1H chart.
Breakout Candle:
Should close above ₹420 ideally. A breakout without closing above resistance is risky.
Retest Possibility:
Sometimes, price may break out and retest the breakout level before continuing the uptrend. Don’t panic if it slightly dips and holds support near ₹416.
🎯 Target Levels After Breakout:
You can calculate the triangle breakout target like this:
Target = Height of triangle + Breakout point
Let’s assume the base of triangle is from ₹375 to ₹416 = ₹41 range
Breakout Target = ₹416 + ₹41 = ₹457
📌 Extended Target (Momentum-based): ₹475–₹500 zone
📌 If volumes + broader market support: ₹500+ is possible, especially in swing or positional setups.
📉 Invalidation (Risk Management):
If after breakout, price falls below ₹410–408 with volume, it could be a false breakout.
Keep a stop-loss below previous swing lows or support trendline.
🧠 Summary:
✅ Triangle breakout with volume = bullish confirmation
🎯 Targets: ₹457 → ₹475 → ₹500
❗ Risk zone: below ₹410
🔁 Retest is common before upmove continues
Disclaimer: The information provided is for educational and informational purposes only and should not be considered as financial advice. Investing in the stock market involves risk, and past performance is not indicative of future results. Please consult with a certified financial advisor or conduct your own research before making any investment decisions. We are not responsible for any losses incurred as a result of using this information. Stock market investments are subject to market risks; read all related documents carefully.
RIOT: Looks pretty bad, but still has a chance to recoverBreaking down into the big bad channel maybe was the first warning of a false breakout. August first price action just made things a whole lot worse. The hope here is that RSI is tanked and has multiple pints of bullish divergence. But the bad news is, the overall price action is still a very 3 waves structure. If price falls into wave 1 territory, then it is pretty much game over. It could be a leading diagonal, or it could be another x wave to bring the price back down to the bottom of the channel yet again. BTC is also trying to maintain must keep support level. So, if next week we see a sharp recovery, then the 5 waves structure may still be intact. However, if price breaks down below $10, then best to stay out of it until things settle down. I took some profit at the top of the channel and got stopped out for most of my position for now. I will hold the rest with a stop at $9.5. If price recovers, then will ride the final wave towards $18.

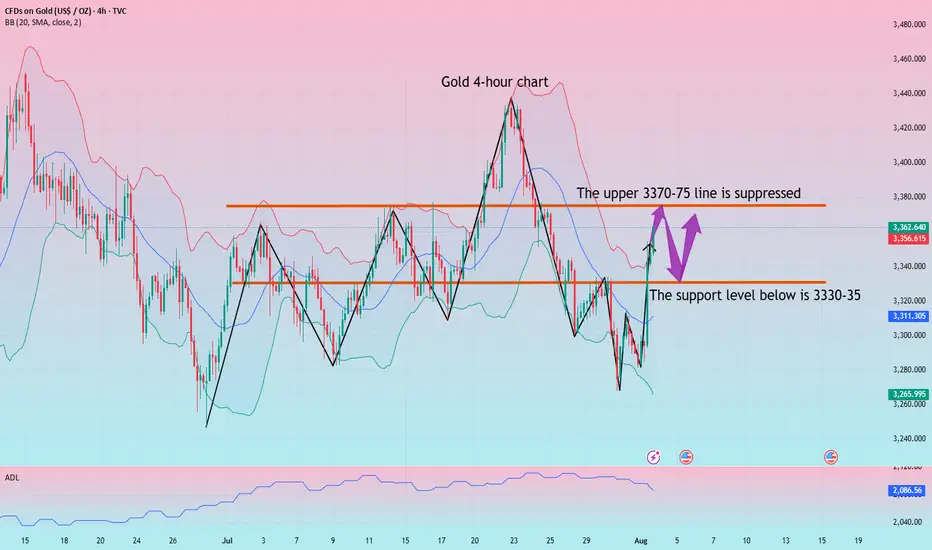
Analysis of gold market operation strategies and ideas next week
Gold rallied unilaterally on Friday following positive non-farm payroll data, reaching a new high for the week. This week's candlestick formed a hammer pattern, suggesting further upside potential next week. Bulls continued their push late Friday, closing at 3363. Next week, we will continue to monitor short-term resistance around 3370-3375. We will continue to buy on pullbacks. If your current trading is not satisfactory, I hope I can help you avoid investment setbacks. Welcome to discuss your options!
Based on a 4-hour analysis, short-term resistance will be seen around 3370-3375 next week, with a key resistance around 3395-3400. We will continue to buy on pullbacks. In the intermediate range, we recommend maintaining a cautious wait-and-see approach. I will provide detailed trading strategies during the trading session, so please stay tuned.
Gold Trading Strategy:
Go long on gold pullbacks to 3330-335, with a stop-loss at 3318 and a target at 3370-3375. Hold on if it breaks above this level.
XRPUSD 4 Hour BottomXRP has broken out of the weekly wedge leaving a long weekly candle stick close. Price has pulled back indicating it it ready for the next leg higher. Daily candle closed bullish and 4 hour time from has double bottom.

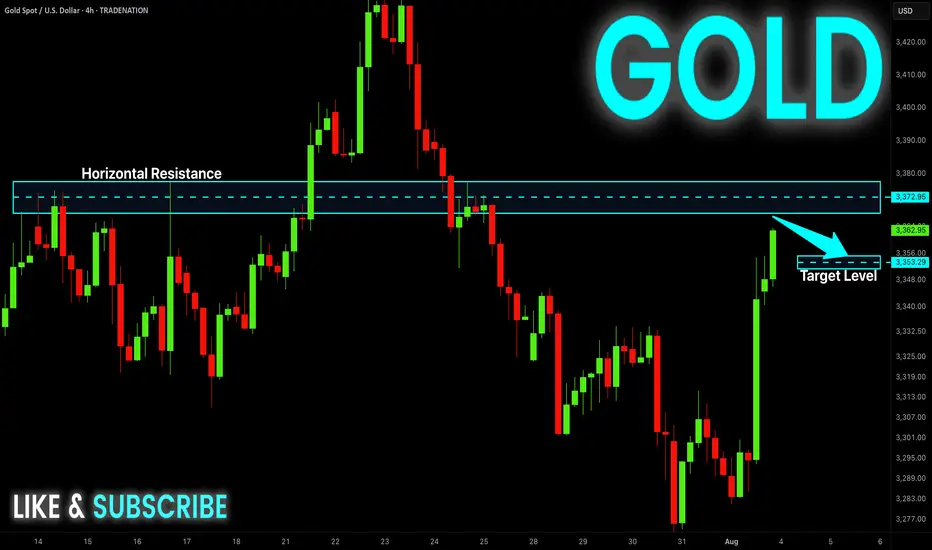
GOLD Short From Resistance! Sell!
Hello, Traders!
GOLD surged up sharply
On Friday and is already
Retesting the horizontal
Resistance of 3377$
From where we will be
Expecting a local pullback
On Monday as Gold
Is locally overbought
Sell!
Comment and subscribe to help us grow!
Check out other forecasts below too!
Disclosure: I am part of Trade Nation's Influencer program and receive a monthly fee for using their TradingView charts in my analysis.
EURUSD has broken & hovering near resistance.EURUSD has broken & hovering near resistance. US dollar has started weaking again due to Tariff war.

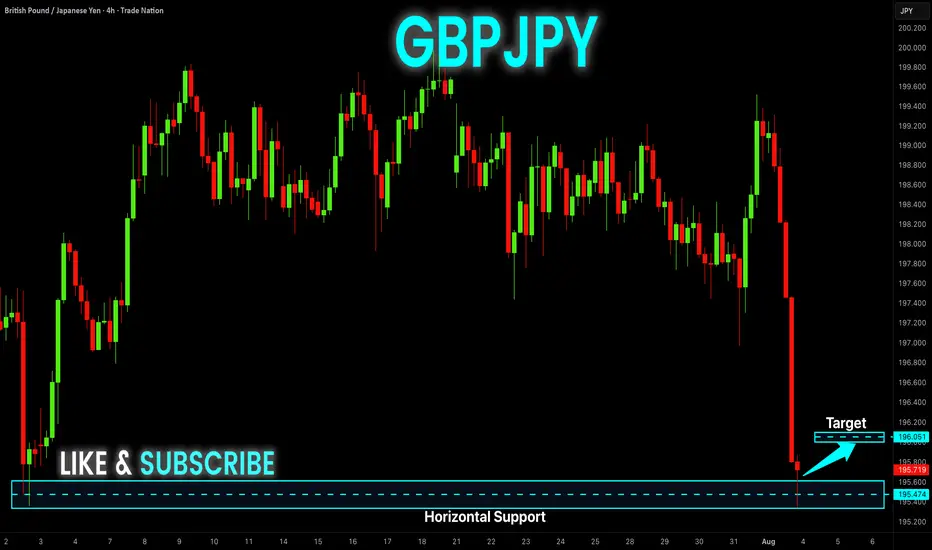
GBP-JPY Risky Long! Buy!
Hello,Traders!
GBP-JPY collapsed on Friday
And the pair's final move
Was absorbed by the horizontal
Support of 195.400 so as the
Pair is oversold we will be
Expecting a local rebound
And a correction on Monday
Buy!
Comment and subscribe to help us grow!
Check out other forecasts below too!
Disclosure: I am part of Trade Nation's Influencer program and receive a monthly fee for using their TradingView charts in my analysis.
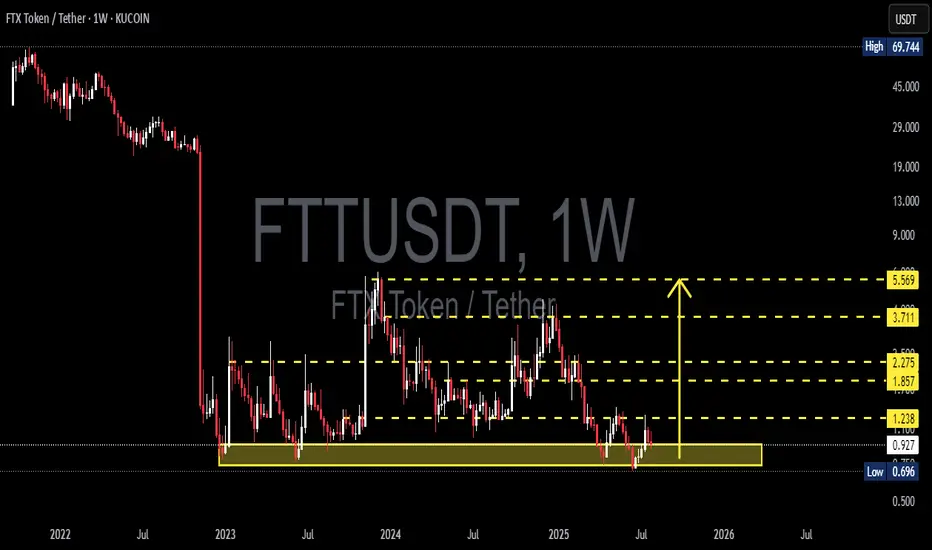
FTTUSDT at the Edge! Breakdown or Massive Breakout?📌 Overview: A Rebirth from the Dead Zone
FTT/USDT is currently in one of its most technically compelling phases in the past two years. After suffering a catastrophic 98% crash following the collapse of the FTX ecosystem in 2022, price action now shows signs of long-term accumulation at a historically strong demand zone — potentially forming a solid base for a medium to long-term recovery.
The crucial support zone between $0.70 and $0.90 has been tested multiple times since late 2022 and has consistently held against extreme sell pressure. This suggests the presence of a strong historical demand area. Now that the price is once again reacting bullishly from this zone, the door is opening for a potential technical rebound.
---
🧠 Forming Pattern: Accumulation & Bottoming Structure
1. Base Accumulation Range:
A long period of sideways movement after the major crash.
Indicates exhaustion of selling pressure and possible stealth accumulation by smart money.
2. Potential Double Bottom or Rounded Bottom:
If this rebound holds, a double bottom could be confirmed with a breakout above $1.238.
A rounded bottom formation could signal a major reversal rally if backed by volume and catalysts.
---
🟢 Bullish Scenario (Reversal in Progress):
If buyers hold the current support and push through resistance levels:
🔓 Break above $1.238 = key reversal confirmation.
🚀 Potential bullish targets:
$1.857 – Previous minor resistance.
$2.275 – Former breakout zone.
$3.711 – Key structural level with historical liquidity.
$5.569 – Major psychological and technical target.
Strong confirmation if the breakout is supported by volume and a full-bodied weekly candle.
---
🔴 Bearish Scenario (Further Downside):
If price fails to hold the support zone:
📉 A breakdown below $0.696 would invalidate the bullish setup and could lead to:
New price discovery below $0.50
A potential “death spiral” if sell volume increases rapidly.
This scenario is extreme and would heavily depend on broader market sentiment and the future of the FTX recovery process.
---
🧭 Key Levels & Technical Insights:
Element Details
Strong Demand Zone $0.70 – $0.90 (multi-tested since 2022)
Bullish Trigger Level Break & retest of $1.238 with volume
Reversal Targets $1.857, $2.275, $3.711, and $5.569
Bearish Breakdown Loss of $0.696 = potential for new lows
Early Momentum Current bounce suggests possible start of reversal
---
💡 Final Thoughts:
> "FTT is no longer in a panic phase — it’s in a decision phase: will it rise as a ‘Phoenix Token’ from the ashes of FTX, or fall back into obscurity?"
Given the technical setup and long-term structure, this could be one of the most pivotal moments for FTT. Traders and investors should watch this level closely — the next major move is likely to begin from this very zone.
#FTTUSDT #FTTAnalysis #CryptoReversal #AltcoinWatch #TechnicalAnalysis #SupportResistance #BullishSetup #BearishScenario #DoubleBottom
KIMLUN - DMI and RSI shows BULLISH SIGNAL KIMLUN - CURRENT PRICE : RM1.31
KIMLUN is in an uptrend for medium term as the price is making higher high and higher low. Supported by positive readings in technical oscillators such as DMI (+DI is above -DI) and RSI (above 50), it increases the bullish scenario. At current price trading near SMA 20, there is possibility for price reach upper band in bollinger bands indicator. Nearest support will be RM1.24 (-5.34%) and 1st target will be RM1.41 (+7.63%).
ENTRY PRICE : RM1.30 - RM1.31
TARGET : RM1.41 and RM1.47
SUPPORT : RM1.24
Notes : On the fundamental side, KIMLUN shows a strong recovery in earnings. For FY2022, company was loss RM7.2 million. Then the company rebounded with a profit of RM7.1 million in FY2023. For FY2024, company registered strong performance of profit RM50.3 million.

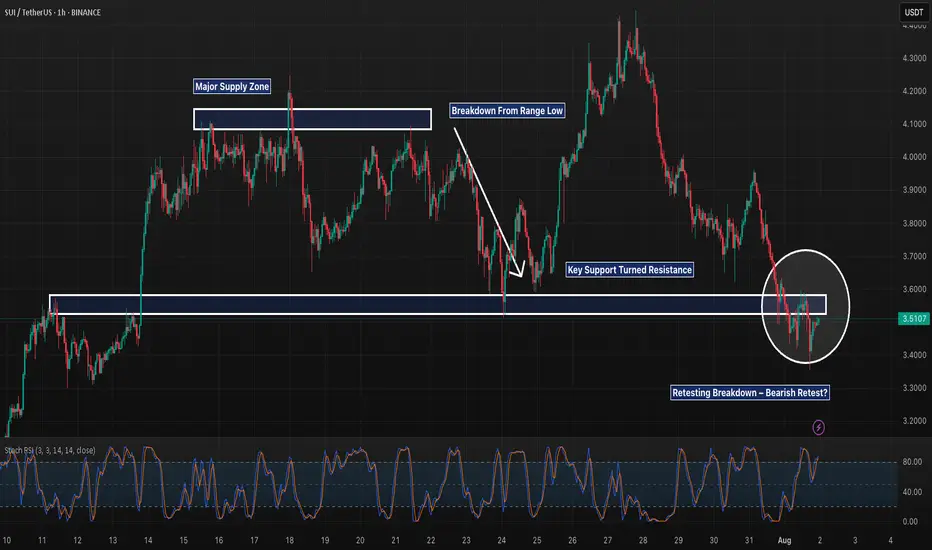
SUI 1H – Breakdown & Retest of Key Support, But Will It Reject?SUI 1H – Breakdown & Retest of Key Support, But Will It Reject or Reclaim?
Description:
SUI just completed a textbook range breakdown after weeks of sideways chop between ~$3.60–$4.10. The prior support floor has now flipped into resistance, and the recent bounce appears to be retesting that structure. If this retest gets rejected, continuation toward lower support zones (potentially $3.30 and below) becomes likely.
However, reclaiming and holding above $3.60 could trap late shorts and fuel a squeeze. Structure still favors bears for now, but it’s decision time.
📌 Breakdown structure
📌 Bearish retest
📌 Eyes on confirmation or invalidation
This is the battle zone — stay sharp.
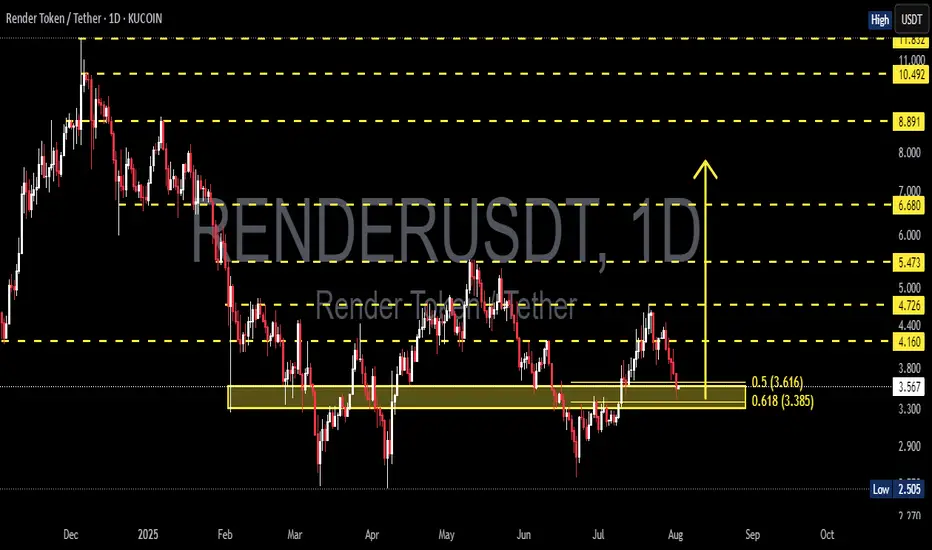
RNDR/USDT at a Critical Turning Point: Golden Pocket as the Key?✨ Overview:
Render Token (RNDR) is currently testing a crucial support zone — the Golden Pocket Fibonacci Retracement between 0.5 (3.616) and 0.618 (3.385). This zone not only represents a significant retracement level but has historically acted as a strong demand area, often serving as a springboard for major price reversals.
---
🧠 Detailed Technical Analysis:
🔸 Support Zone & Golden Pocket
Price has retraced back to the 0.5 – 0.618 Fibonacci zone, a high-probability reversal area.
This zone has acted as a demand base multiple times since February 2025.
How the price reacts here will likely define the next major trend direction.
🔸 Market Structure
The overall structure shows a mid-term downtrend, marked by lower highs and lower lows.
However, the current price action shows slowing bearish momentum, indicating potential hidden accumulation.
A potential double bottom pattern could be forming, hinting at a bullish reversal if confirmed.
---
📈 Bullish Scenario:
1. Strong Rebound from the Golden Pocket
Watch for bullish candlestick patterns (e.g., pin bar, bullish engulfing) near $3.38–$3.61.
Initial resistance levels: $4.16 – $4.72
If broken, mid-term targets could extend to $5.47 – $6.68
2. Double Bottom Confirmation
A confirmed double bottom with a neckline breakout around $4.16 would greatly strengthen bullish momentum.
3. Increased Buying Volume
A spike in volume during the rebound would validate bullish sentiment and potential trend reversal.
---
📉 Bearish Scenario:
1. Breakdown Below the Golden Pocket
If the price breaks below $3.385 with strong volume, we could see a move down toward $2.77, the next significant support.
2. Weak Bounce / Lower High
A failed breakout above $4.16 may indicate a bearish continuation after a temporary relief rally.
---
📌 Summary:
RNDR is currently at a technically sensitive zone. The Golden Pocket between $3.38 and $3.61 is the key area to watch. A strong bullish reaction could signal the start of a trend reversal, while a breakdown could trigger further downside continuation. Traders are advised to wait for clear confirmation via price action before committing to any strong positions.
---
🔖 Key Levels to Watch:
Level Description
3.38 – 3.61 Golden Pocket (Potential Buy Zone)
4.16 Minor Resistance
4.72 Bullish Breakout Trigger
5.47 – 6.68 Mid-Term Reversal Targets
2.77 Strong Support if Breakdown Occurs
---
🧩 Chart Patterns Observed:
Potential Double Bottom – early bullish reversal signal.
Golden Pocket Reaction Setup
Descending Structure – still intact but weakening.
---
🔍 Trade Ideas:
🔄 Wait-and-see approach: Wait for clear bullish confirmation on daily candles.
🎯 Aggressive Long Entry: Around 3.40–3.60 with a tight stop-loss.
⚠️ Short Opportunity: If a strong breakdown below 3.38 occurs with volume confirmation.
#RNDR #RenderToken #RNDRUSDT #CryptoAnalysis #GoldenPocket #FibonacciRetracement #DoubleBottom #PriceAction #SupportResistance #AltcoinSetup #CryptoSignals #TechnicalAnalysis
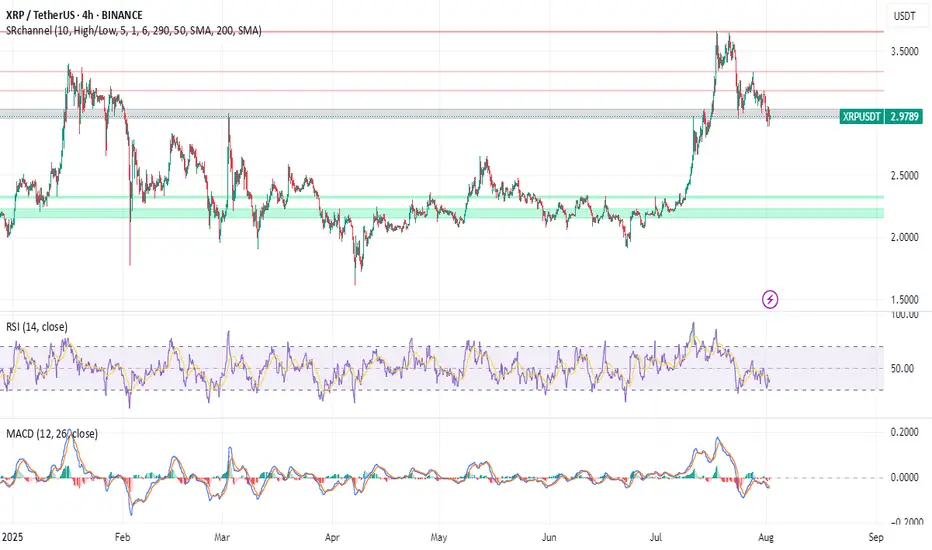
XRP Price Prediction: Is a Breakout to $15 Imminent? XRP Breakout Targets $15 — Analyst Says 'This Is Just The Start': Is XRP Set to Explode?
The cryptocurrency world is once again turning its attention to XRP, the token developed by Ripple Labs, as bullish analysts predict an imminent and explosive rally. After a strong run-up earlier in 2025, XRP has pulled back slightly and is now approaching a critical support zone. Some analysts are now calling for a $15 breakout target, even as the token hovers near $2.80, a level many see as a pivotal point for the next leg of the bull market.
Let's dive into the latest developments, technical analysis, and market sentiment surrounding XRP — and why some believe "this is just the start."
XRP Price Overview: Current Positioning
As of early August 2025, XRP is trading around the $2.85 mark, down from its recent high near $3.70. While this pullback may concern short-term traders, technical analysts argue that this retracement is healthy and necessary for the formation of a higher low, a common pattern in bullish market structures.
The key price levels to watch include a support zone between $2.80 and $2.95, resistance at $3.70, downside risk to $2.20 if $2.80 fails, and upside targets of $5 in the short term and $15 in the mid-term.
Why $2.80 Is So Important
The $2.80 support level is emerging as a make-or-break price zone. It aligns with multiple technical indicators including the 0.618 Fibonacci retracement from the previous rally, the Value Area High (VAH) from recent price accumulation zones, and Higher Time Frame (HTF) structure showing consistent support around this level in recent months.
If XRP manages to hold this level and establish a higher low, it could kick off a new bullish wave, potentially targeting $5 in the short term and beyond in the medium term.
Analysts Call for $15 XRP — Is It Possible?
Several key factors support the bull case. Institutional interest continues to grow as Ripple's partnerships with banks and financial institutions support long-term utility. Legal clarity has improved significantly after years of regulatory uncertainty, with the SEC lawsuit largely resolved, removing a major overhang. Technical indicators including bullish divergence on the RSI, MACD bullish crossover, and increasing volume all support upward momentum. Additionally, as Bitcoin stabilizes, funds are flowing into major altcoins, including XRP, as part of the typical altcoin rotation cycle.
August Rally Incoming? Bullish Divergence Signals 20% Upside
Technical analysts have identified a bullish divergence forming on the daily and 4-hour charts — a classic signal that often precedes a strong move upward. This divergence appears as the price makes lower lows while the RSI makes higher lows, suggesting momentum is shifting in favor of the bulls.
If confirmed, this divergence could catalyze a 20% rally in August, potentially pushing XRP back above $3.40 and testing the critical $3.70 resistance. A clean break above this level would likely open the floodgates for further gains.
$3.70: The Gatekeeper to Higher Highs
While there's excitement around the potential for XRP to hit $5 or even $15, the path forward must first go through $3.70. This resistance level has stalled price action multiple times in 2025 and will likely serve as a psychological and technical barrier.
Two scenarios are possible: a break above $3.70 would open the door to $5 and $7 targets quickly, while a rejection at $3.70 could lead to a pullback toward $2.20, especially if $2.80 fails.
Traders Hedge With New XRP Rival: Remittix
As XRP consolidates, some traders are diversifying their holdings into Remittix (RTX), a new cross-border payments token that promises enhanced scalability and compliance tools. RTX has gained traction recently, especially among DeFi-native traders seeking alternatives to XRP's centralized development model.
Remittix highlights include strong tokenomics with a deflationary model and staking rewards, a real-world use case targeting remittance markets in Asia and Africa, and a PayFi Wallet with beta slated for launch in Q3 2025, offering seamless integration with fiat on/off ramps.
While Remittix is gaining momentum, XRP's brand recognition, liquidity, and institutional partnerships still give it a significant edge in the payments space.
XRP Price Forecast: Short-Term and Long-Term Outlook
In the short term over the next 30 days, the bullish scenario involves holding $2.80 support, breaking $3.70, and rallying to $5. The bearish scenario would see XRP lose $2.80, drop to $2.20, and consolidate.
For the mid-term outlook in Q4 2025, if the bullish trend continues and macro conditions remain favorable, XRP could target $7 to $10 by the end of the year. In a full altseason scenario, $15 is not out of reach, according to some analysts.
Key Catalysts That Could Drive XRP Higher
Several catalysts could propel XRP higher. Institutional adoption continues to expand as Ripple's partnerships, especially in the Middle East and Asia-Pacific, lay the groundwork for long-term utility. CBDC integration presents another opportunity as Ripple works with multiple central banks on developing Central Bank Digital Currencies. Any progress here could significantly boost XRP's real-world use.
ETP listings could bring new inflows as XRP may benefit from exchange-traded products in Europe and Asia, especially if more crypto-based ETFs gain traction globally. The macro environment also favors growth, with a dovish Fed, weakening USD, and rising crypto adoption all creating a fertile environment for altcoins like XRP to thrive.
Community Sentiment: Is the XRP Army Ready?
The XRP community, also known as the XRP Army, remains one of the most passionate and active in the crypto space. Social media sentiment has turned increasingly bullish, with hashtags like #XRPToTheMoon and #XRP15 trending on X (formerly Twitter).
However, analysts caution against overexuberance, noting that market cycles can be volatile and unpredictable.
Risks to Watch
While the bullish case is compelling, it's important to consider the risks. Macro-economic shocks from a sudden shift in interest rates or recession fears could impact crypto markets broadly. Regulatory setbacks remain possible — although Ripple has gained legal clarity in the U.S., future regulations in Europe or Asia could cause volatility.
Network risks from any technical issues or security breaches could erode trust and trigger selloffs. Competition from new projects like Remittix, Stellar (XLM), and other payment-focused tokens could eat into XRP's market share.
Final Thoughts: Is XRP Set to Explode?
With XRP hovering near a critical support zone at $2.80, all eyes are on whether bulls can defend this level and push the token back into an uptrend. If successful, the next moves could be explosive, with analysts forecasting $5 in the short term and potentially $15 or higher before the end of 2025.
While risks remain, the technical setup, improving fundamentals, and renewed community optimism all point toward a bullish continuation — if key levels hold.
As always, investors should stay informed, manage risk, and avoid emotional decisions in this fast-moving market.
Summary
XRP currently trades around $2.85 with key support at $2.80 and major resistance at $3.70. Short-term targets point to $5 while mid-term projections suggest $10 to $15 is possible. Downside risk exists to $2.20 if support fails. Bullish catalysts include legal clarity, growing utility, and increasing adoption, while bearish risks encompass macro shocks, competition, and potential regulation.
Disclaimer
This article is for informational purposes only and is not financial advice. Cryptocurrency investments are highly volatile and involve significant risk. Always do your own research (DYOR) and consult with a financial advisor before making investment decisions.
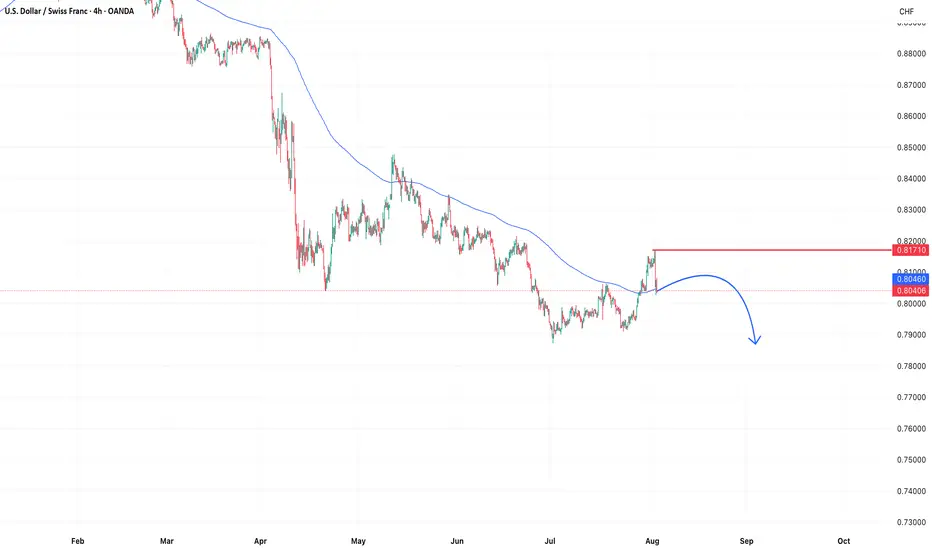
USDCHFUSDCHF is expected to continue its downtrend next week. After a weak recovery attempt, selling pressure remains dominant. Traders should keep an eye on key support zones for potential trading opportunities.
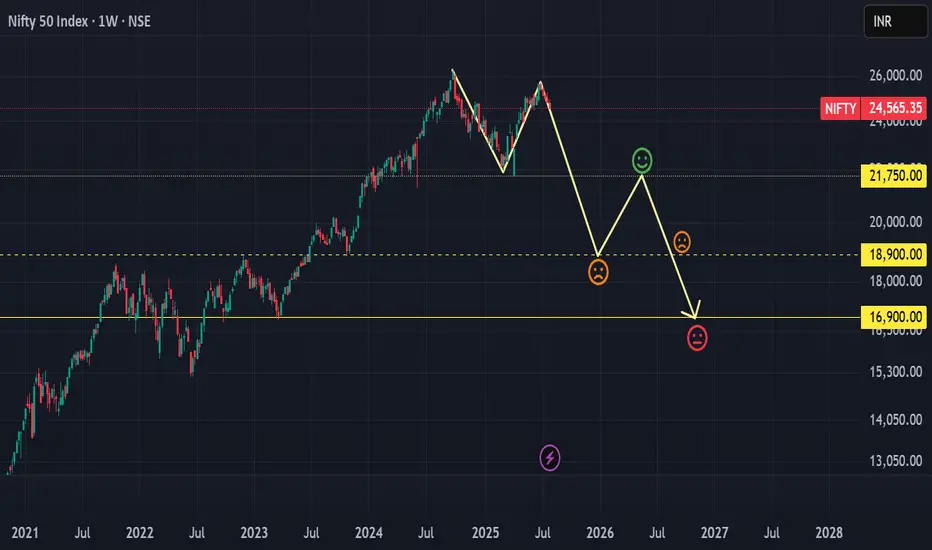
Bitcoin – Time to Book Profits?📉 Bitcoin – Time to Book Profits? 📈
Bitcoin (BTCUSD) has had a phenomenal run! On Nov 22, 2022, it bottomed out at around $15,500 — and then, on July 14, 2025, it smashed records by hitting an all-time high of $123,000! 💥
That’s a jaw-dropping gain of approximately 693% in just under 3 years! 🤑📊
🚨 But all that glitters isn't gold...
📉 Technical outlook based on Elliott Wave Theory suggests we might be in either:
An extended Wave 4 correction, or
A fizzling Wave 5 move that’s losing steam.
🔍 Adding to this concern:
Volume is below average – a classic warning sign 🚨
Price action shows weakening momentum
No strong buying confirmation near the highs
👉 The pattern now resembles a potential distribution phase, not a fresh breakout. That means: The smart money might already be booking profits.
💡 What should investors do?
If you’ve ridden the wave up — consider taking some money off the table. This could be a good time to lock in gains and wait for a better re-entry opportunity. Remember, discipline beats excitement in trading.
📛 Caution is advised — especially for late entrants who might get caught in a correction or a prolonged sideways phase.

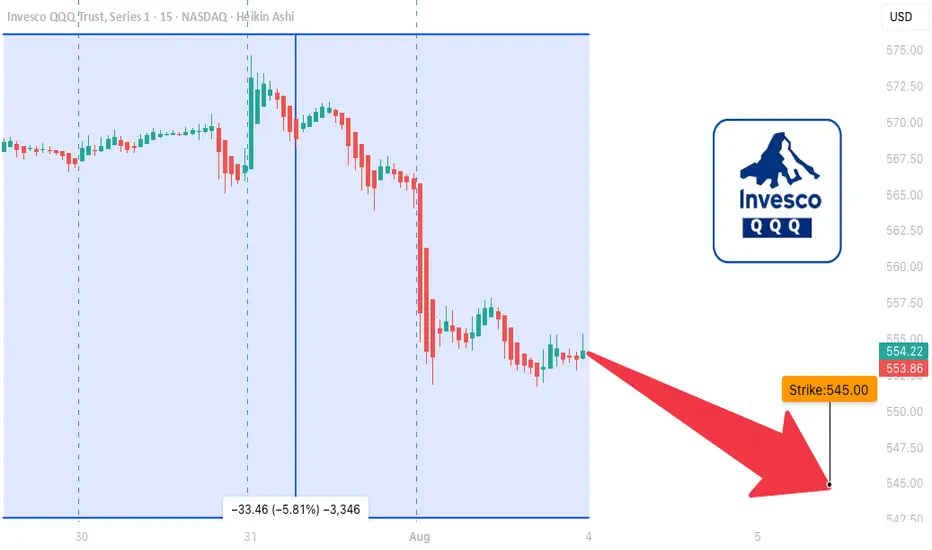
QQQ LEAP Trade Thesis – Aug 1, 2025
🧠 **QQQ LEAP Trade Thesis – Aug 1, 2025**
🎯 **Setup**: High-conviction LEAP PUT
📉 **Bias**: 🔻 *Moderate Bearish*
📆 Horizon: Long-Term (12+ months)
---
📊 **Multi-Model Intelligence Summary**
🧪 **Grok (xAI)**
• Monthly RSI = bearish 📉
• Trading near 52W highs = overvalued 💥
• Suggests: \$545 PUT
🧠 **Gemini (Google)**
• High conviction bearish
• Suggests: \$590 PUT (expensive premium)
🧬 **Claude (Anthropic)**
• RSI breakdown = confirmed weakness
• Recommends: \$530 PUT for max downside
🦾 **Meta (LLaMA)**
• Moving averages turning over
• Suggests: \$555 PUT – moderate confidence
🛰️ **DeepSeek**
• Long-term RSI confirms bearish drift
• Volatility ideal for LEAP entries
• Recommends: \$545 PUT
---
📍**MODEL CONSENSUS**
✅ Bearish trend across all models
✅ Favorable volatility (VIX ✅)
✅ Overvaluation = downside pressure
⚠️ Strike variance across models → we anchor at **\$545** for balance
---
💼 **TRADE SETUP (LEAP PUT)**
• 🔻 Direction: PUT (Short)
• 🎯 Strike: **\$545**
• 📆 Expiry: **2026-09-18** (413 days)
• 💰 Entry Price: **\$38.33**
• 🎯 Target: **\$76.66**
• 🛑 Stop: **\$24.91**
• ✅ Confidence: **75%**
• ⏰ Entry: Monday Open
• 📏 Size: 1 contract
---
📌 **Narrative**:
Every model says the same thing: RSI rollover, inflated price, and perfect LEAP conditions. Institutions are neutral → retail can front-run the decay. You don’t often get long-dated PUTs this clean.
🎯 Asymmetric risk/reward.
📉 Macro setup aligns.
🎯 Strong long-term positioning play.
---
🧠 Stay smart. Position early. Ride the macro shift.
🔔 Like + Follow for more AI-driven trade setups.
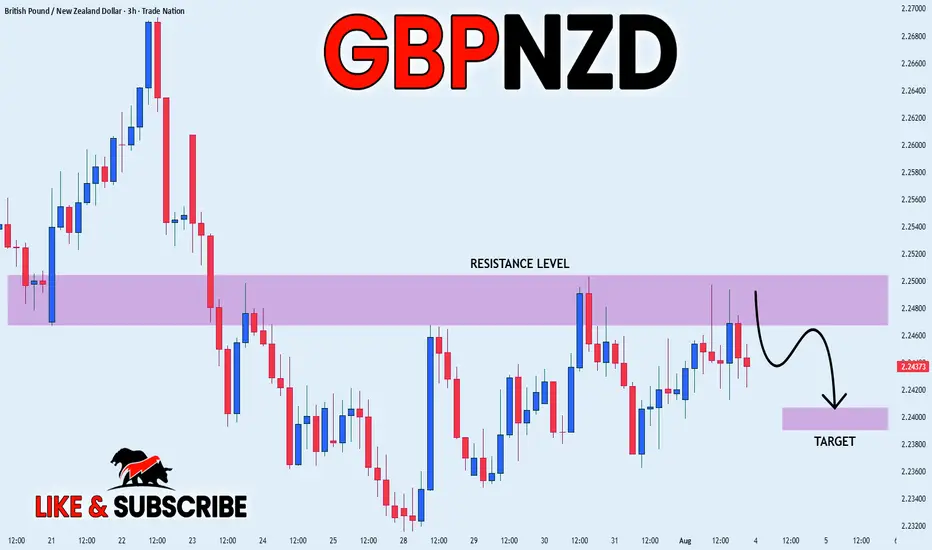
GBP_NZD BEARISH BIAS|SHORT|
✅GBP_NZD has retested
A resistance level of 2.2500
And we are seeing a bearish reaction
With the price going down so we are
Bearish biased now and we will be
Expecting the pair to go further down
SHORT🔥
✅Like and subscribe to never miss a new idea!✅
Disclosure: I am part of Trade Nation's Influencer program and receive a monthly fee for using their TradingView charts in my analysis.
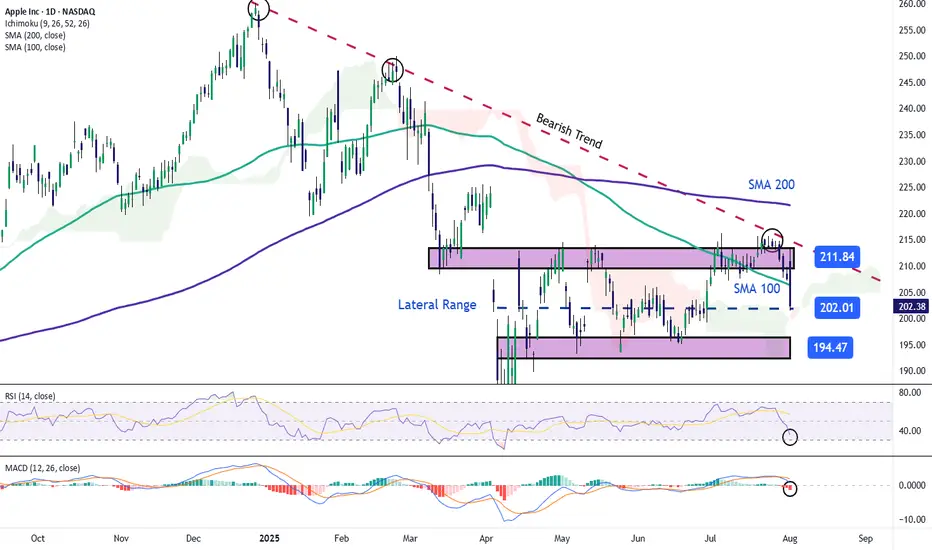
Apple Stock Falls Despite Strong EarningsApple stock is down more than 4% in the final session of the week, following the company’s earnings release yesterday. Apple reported earnings per share of $1.57, beating expectations of $1.43, while total revenue reached $94.04 billion, surpassing the $89.53 billion forecasted by the market.
However, despite the strong results, the stock is once again facing a notable short-term bearish bias as investor concerns grow. The primary issue is the perception that Apple is falling behind in the race for artificial intelligence, especially compared to its main competitors. In addition, shortly after the earnings announcement, it was noted that the company may face challenges in sustaining growth throughout the remainder of 2025, which has fueled additional downward pressure on the stock.
Sideways Range Emerges
In recent weeks, Apple’s price action has consolidated within a clear lateral range, with resistance around $211 and support near $194. So far, price fluctuations have not been strong enough to break this structure, and the latest bearish candlestick has reinforced the validity of the channel. For now, this sideways range remains the most relevant technical formation to watch in the upcoming sessions.
Technical Indicators
RSI:
The RSI line is falling rapidly and is now approaching the oversold zone at the 30 level. If the indicator reaches that threshold, it could suggest a technical imbalance, opening the door to a short-term bullish correction.
MACD:
The MACD histogram has moved into negative territory in recent sessions, suggesting a clear dominance of bearish momentum in the moving average structure. If this persists, selling pressure may continue to build in the near term.
Key Levels to Watch:
$211 – Main Resistance: Upper boundary of the current range. A breakout above this level could trigger a stronger bullish trend.
$200 – Psychological Support: Round number zone, a breakdown here could activate an immediate bearish bias for the next sessions.
$194 – Key Support: Corresponds to recent weekly lows. A move below this level would likely confirm a more extended bearish trend.
Written by Julian Pineda, CFA – Market Analyst
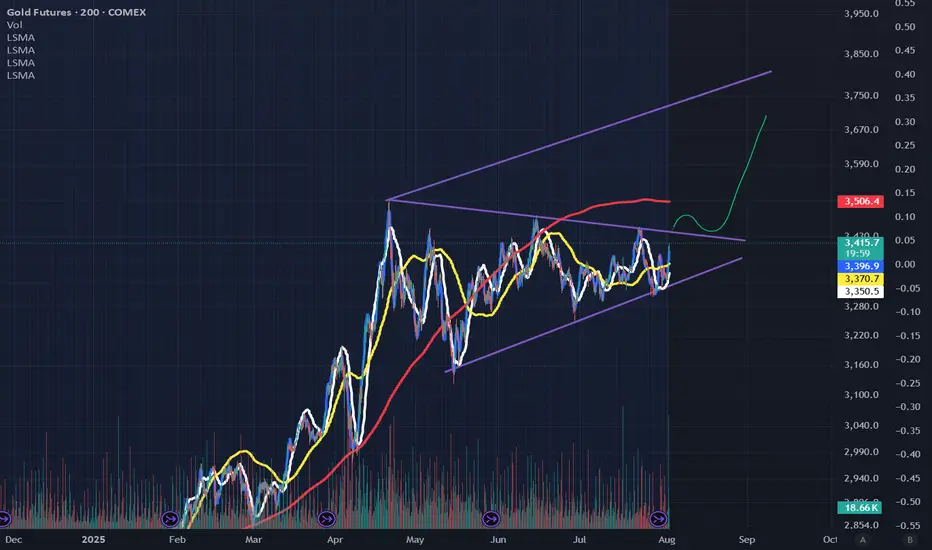
Gold completing a 4-month Bull Flag consolidation, 3800 next! We can see the classic bull flag consolidation pattern which has been going on ever since the stock market decided to go on a rager!
Even with that going on, smart money continues to buy gold on the dips as you should too.
Once Trump installs a phoney new BLS chief and moves to pressure the Fed by nominating a new governor after Kugler's departure the message will be clear:
1) the BLS and the Fed are no longer independent
2) the US dollar is going to tank
3) Gold is going to boom!
Good luck and happy trading!
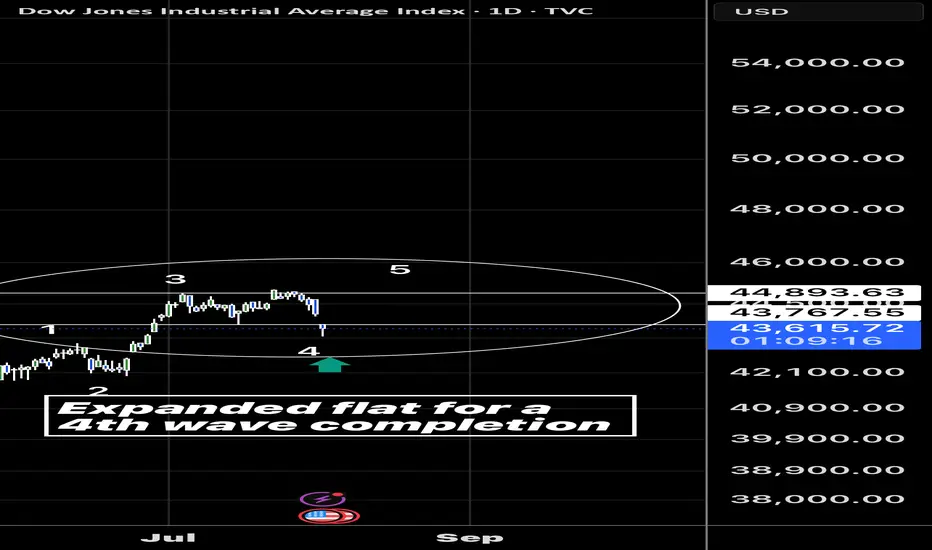
Expanded flat on the Dow for 4th wave completion? If it is we can see some new highs… a close back above 43760 today would set it up