The Curtain Falls on the Script: Why I Believe It's Time to StopHello everyone, this is EC.
From late June through July, we experienced a full-fledged primary uptrend in crypto, driven by a weakening U.S. Dollar. From the script preview to the execution of the plan, every step has been clearly documented.
However, today, I want to share a different, more cautious perspective: I believe this script may be nearing its end.
I. Reviewing the Script and the "Bubble's" Manifestation
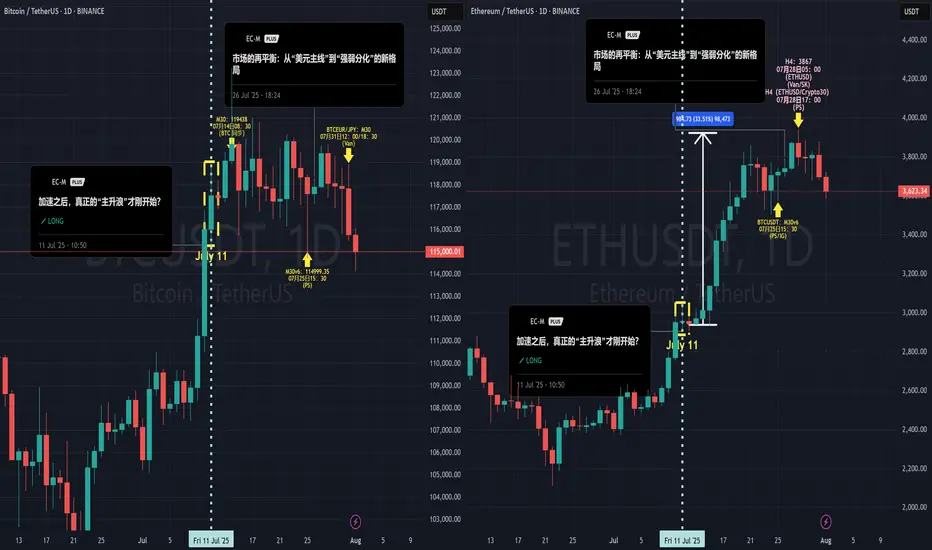
After our call on July 4th that the "main bull wave" was starting, the market perfectly delivered on our expectations. What was more interesting was the clear internal divergence we saw, which precisely confirms our thesis about the "bubble phase" from my June 20th article, "The Restlessness Before the Storm."
When the market's sentiment "balloon" is inflated to its limit, capital flows from the leader (BTC) to assets with higher elasticity (ETH).
The data shows that from July 11th until now, ETH took the baton and rallied approximately 35%, while BTC gained only around 6% in the same period. When BTC is already showing signs of fatigue while ETH is still in a solo rally, that in itself is a major signal that the bubble is nearing its end.
II. A Shift in the Winds: The Hand Inflating the Balloon is Loosening
I've chosen to end this script at this moment based on signal changes on two levels:
The "External Factor" Shift: The Potential Strengthening of the USD
As I pointed out in my July 28th analysis, "The Market's Rebalancing," the market has entered a phase of "strength-weakness divergence." This trend is now becoming more evident: the U.S. Dollar, cushioned by the extreme weakness of currencies like the Japanese Yen, has begun to show signs of a broad strengthening. Concurrently, U.S. and European stock markets are pulling back in sync, and global risk appetite is cooling.
The external environment that fueled the bubble (a weak USD) is beginning to falter.
The "Internal Factor" Signal: The Needle Point Inside the Balloon
The crypto market itself is also showing warning signs of resistance (see attached ETH daily chart). When the leading asset, ETH, begins to show signs of stagnation and distribution at its highs, it's like the balloon meeting the needle point. The exhaustion of internal momentum is a more direct warning than changes in the external environment.
III. Conclusion: Don't Be Greedy for the Last Dessert
When the core logic driving the rally (a weak USD) begins to waver, and the market simultaneously shows internal signs of exhaustion, my choice is to end this script and take profits off the table.
This doesn't mean I think crypto will crash immediately. But "no longer suitable to hold" implies that, in my view, the risk/reward ratio at the current level is no longer attractive. A grand feast is coming to an end, and being greedy for the last dessert is not a wise move. Shifting from "buying the dip" to "cautious observation" is the rational choice.
Thank you for your attention and for following along this past month.
#Crypto #BTC #ETH #TradingView #MarketAnalysis #RiskManagement
Community ideas
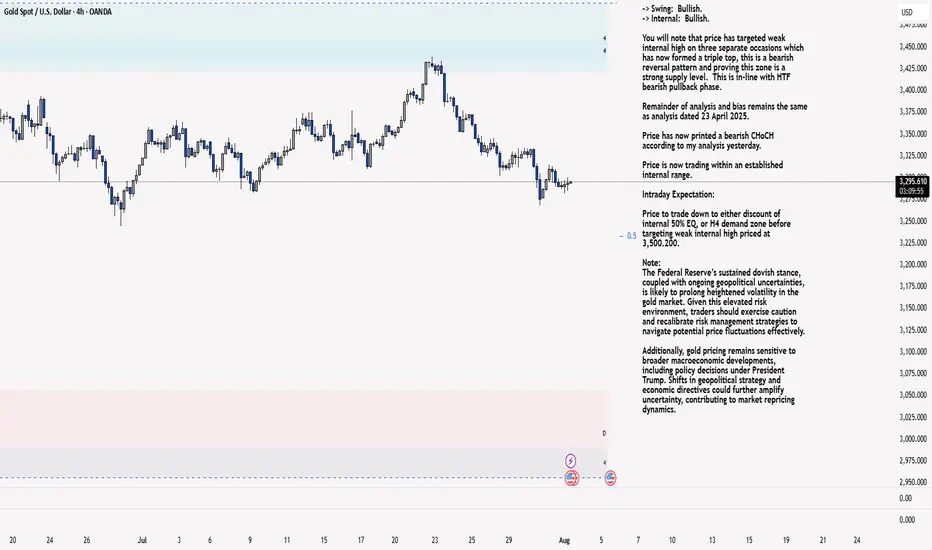
XAU/USD 01 August 2025 Intraday AnalysisH4 Analysis:
-> Swing: Bullish.
-> Internal: Bullish.
You will note that price has targeted weak internal high on three separate occasions which has now formed a triple top, this is a bearish reversal pattern and proving this zone is a strong supply level. This is in-line with HTF bearish pullback phase.
Remainder of analysis and bias remains the same as analysis dated 23 April 2025.
Price has now printed a bearish CHoCH according to my analysis yesterday.
Price is now trading within an established internal range.
Intraday Expectation:
Price to trade down to either discount of internal 50% EQ, or H4 demand zone before targeting weak internal high priced at 3,500.200.
Note:
The Federal Reserve’s sustained dovish stance, coupled with ongoing geopolitical uncertainties, is likely to prolong heightened volatility in the gold market. Given this elevated risk environment, traders should exercise caution and recalibrate risk management strategies to navigate potential price fluctuations effectively.
Additionally, gold pricing remains sensitive to broader macroeconomic developments, including policy decisions under President Trump. Shifts in geopolitical strategy and economic directives could further amplify uncertainty, contributing to market repricing dynamics.
H4 Chart:
M15 Analysis:
-> Swing: Bullish.
-> Internal: Bullish.
H4 Timeframe - Price has failed to target weak internal high, therefore, it would not be unrealistic if price printed a bearish iBOS.
The remainder of my analysis shall remain the same as analysis dated 13 June 2025, apart from target price.
As per my analysis dated 22 May 2025 whereby I mentioned price can be seen to be reacting at discount of 50% EQ on H4 timeframe, therefore, it is a viable alternative that price could potentially print a bullish iBOS on M15 timeframe despite internal structure being bearish.
Price has printed a bullish iBOS followed by a bearish CHoCH, which indicates, but does not confirm, bearish pullback phase initiation. I will however continue to monitor, with respect to depth of pullback.
Intraday Expectation:
Price to continue bearish, react at either M15 supply zone, or discount of 50% internal EQ before targeting weak internal high priced at 3,451.375.
Note:
Gold remains highly volatile amid the Federal Reserve's continued dovish stance, persistent and escalating geopolitical uncertainties. Traders should implement robust risk management strategies and remain vigilant, as price swings may become more pronounced in this elevated volatility environment.
Additionally, President Trump’s recent tariff announcements are expected to further amplify market turbulence, potentially triggering sharp price fluctuations and whipsaws.
M15 Chart:
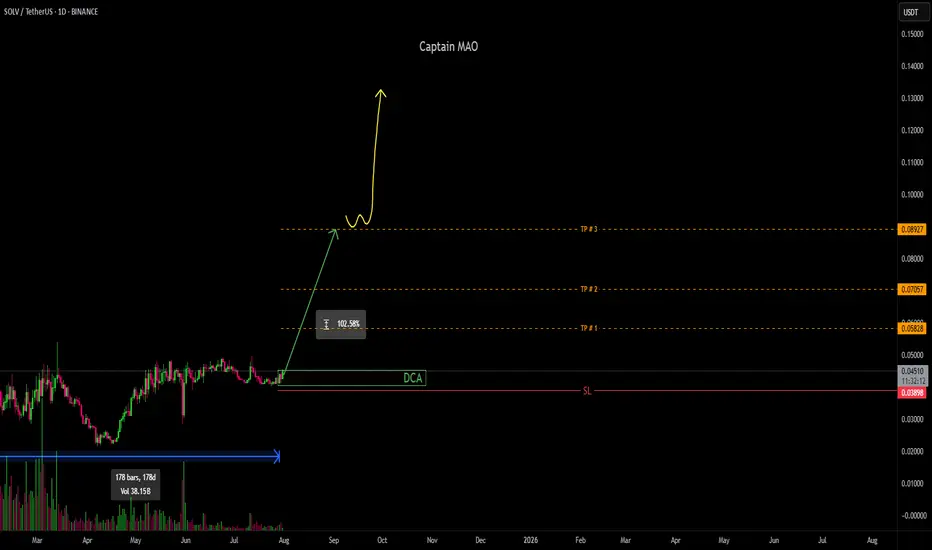
SOLV/USDT +100%has been consolidating in a tight accumulation range for an extended period (~6 months), consistently defending the $0.04 support zone. Price action suggests a potential base-building phase, with buyers repeatedly absorbing dips below $0.04 and establishing a clear floor.
A breakout scenario is developing as SOLV attempts to challenge the key resistance at $0.05 ,Above this level will see big push toward $0.09 zone
XRP/USD Breakout Watch: $3.22 Target in SightA key blue trendline on the XRP/USD chart that reflects market sentiment. If price breaks above it with strong volume, we could see a rally toward $3.22.
Support zone: $0.55–$0.60
Bullish case: Improved sentiment, easing tariffs, and regulatory cooling
Strategy: Wait for breakout confirmation before entering
Share your thoughts — are you preparing for a breakout?

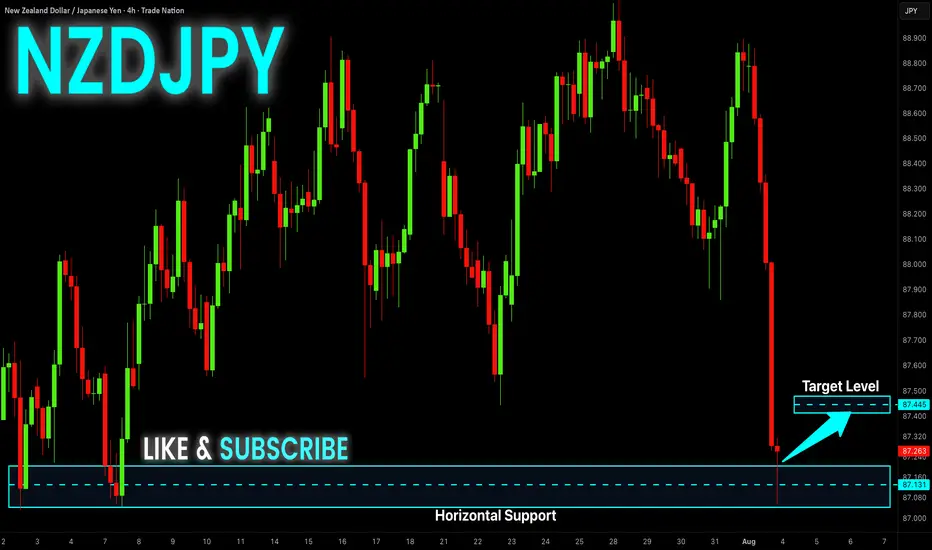
NZD-JPY Local Long! Buy!
Hello,Traders!
NZD-JPY is retsting a
Strong horizontal support
Level around 87.044 and
As the pair is locally
Oversold we will be expecting
A local rebound and a move
Up on Monday!
Buy!
Comment and subscribe to help us grow!
Check out other forecasts below too!
Disclosure: I am part of Trade Nation's Influencer program and receive a monthly fee for using their TradingView charts in my analysis.

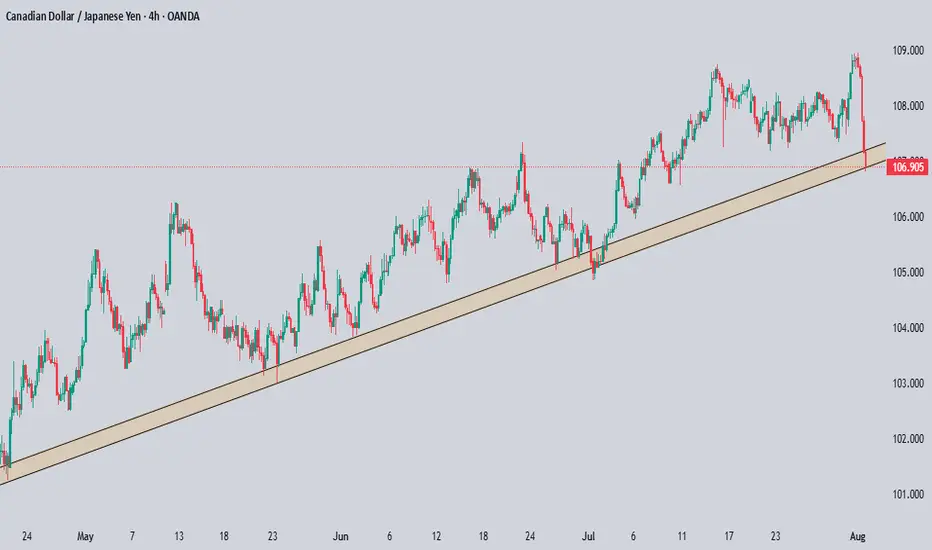
CADJPY Technical & Order Flow AnalysisOur analysis is based on a multi-timeframe top-down approach and fundamental analysis.
Based on our assessment, the price is expected to return to the monthly level.
DISCLAIMER: This analysis may change at any time without notice and is solely intended to assist traders in making independent investment decisions. Please note that this is a prediction, and I have no obligation to act on it, nor should you.
Please support our analysis with a boost or comment!
USD/MXN Bounces Back Ahead of August 2024 LowUSD/MXN appears to be bouncing back ahead of the August 2024 low (18.4291) as it extends the advance from the July low (18.5116), with the exchange rate trading above the 50-Day SMA (18.8993) for the first time since April.
USD/MXN trades to a fresh weekly high (18.9810) following the failed attempt to push below the 18.5090 (23.6% Fibonacci retracement) to 18.6330 (50% Fibonacci retracement) zone, with a move above 19.3720 (38.2% Fibonacci retracement) bringing the June high (19.4441) on the radar.
A move/close above 19.6280 (23.6% Fibonacci extension) opens up the May high (19.7820), but lack of momentum to hold above 18.7780 (50% Fibonacci retracement) may push USD/MXN back toward the July low (18.5116).
--- Written by David Song, Senior Strategist at FOREX.com

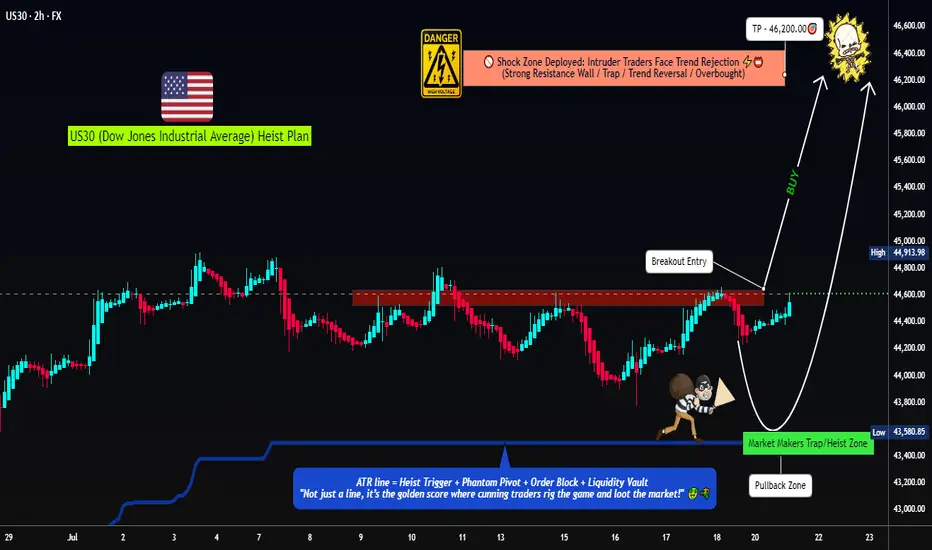
US30 Robbery Blueprint: Breakout, Pullback, Escape Setup💎 Dow Jones Robbery Blueprint: The US30 Vault Crack Plan 💎
(Maximized for reach — within TradingView title limit)
🌟Hi! Hola! Ola! Bonjour! Hallo! Marhaba!🌟
Dear Market Robbers & Money Movers 🕵️♂️💰🚨
This ain't your average analysis — it’s a Thief Trader-style 🔥tactical mission🔥 aimed at the mighty "US30/DJI" (Dow Jones Industrial Average). We're talkin' about a precision heist with a full blueprint: entry zones, trap setups, and escape exits. Read carefully — this ain’t for the faint-hearted traders! 🧠🦾
🧠 Entry Zones (The Break-In) 📈
🛠 ENTRY 1: Crack the wall near 44700.00 – that’s the resistance gate. Wait for confirmation.
🎯 ENTRY 2: Sneak in at the Market Makers’ Trap around 43500.00 – a dirty zone where retailers get baited. Perfect time to strike long!
🧱 DCA/Layering strategy recommended. Stack those buy orders like a thief layering explosives on a safe. 💣💸
🛑 Risk Levels (Escape Routes/Stop Loss)
🔊 "Listen up, vault raiders! Never drop your SL until breakout is confirmed. If you jump early, you might land in a bear trap! 🪤"
🔐 Stop Zones (Based on Strategy):
📌 Swing Buy SL (2H TF): Place at 44100.00 for the stealth buy.
🏦 Institutional SL (Swing Zone): Drop it around 43000.00
🔐 Max Risk SL (3H TF): If you're deep, your last stand is at 39200.00
☝️ SL depends on your position sizing, number of entries, and risk appetite. Trade like a thief, not a gambler.
🎯 Heist Target (Profit Exit)
🏁 Escape Point: 46200.00 — or exit before heat rises! Don’t be greedy. Rob and vanish. 💨💰
🔥 Market Mood: Why the Heist Is On
"US30/DJI" is bullish AF — thanks to:
📊 Macro-Economic Wind at Our Back
📈 Institutional momentum
📰 Strong sentiment and intermarket flows
Check your chart radar: Fundamentals + technicals aligning = green light for robbery! 🟢
⚠️ Tactical Reminder: News Can Jam the Plan
📵 Avoid new entries during major economic releases
🛡 Use trailing SLs to protect running trades
Stay alert, stay alive. 💡
❤️ Support the Robbery Crew
Hit that 💥BOOST💥 — your love fuels our next mission.
Join us and ride daily heist plans with Thief Trading Style 🏴☠️🚀💰
AMZN - LONG Swing Entry PlanNASDAQ:AMZN - LONG Swing Entry Plan
Entry Zone 1: $220.00 – $217.00
→ Open initial position targeting +8% from entry level.
Entry Zone 2: $212.00 – $209.00
→ If price dips further, average down with a second equal-sized entry.
→ New target becomes +8% from the average of Entry 1 and Entry 2.
Edit Zone : $192.00 – $190.00
→ If reached, enter with double the initial size to lower the overall cost basis.
→ Profit target remains +8% from the new average across all three entries.
Risk Management:
Stop Loss:
Risk is capped at 12% below the average entry price (calculated across all executed positions including the Edit Zone).
Position Sizing Approach:
Entry 1: 1x
Entry 2: 1x
Edit Zone: 2x
→ Total exposure: 4x
→ Weighted average determines final TP and SL calculations.
______________________________________
Legal Disclaimer
The information provided in this content is intended for educational and informational purposes only and does not constitute financial, investment, or legal advice or recommendations of any kind. The provider of this content assumes no legal or financial responsibility for any investment decisions made based on this information. Users are strongly advised to conduct their own due diligence and consult with licensed financial advisors before making any financial or investment decisions.
Sharia Compliance Disclaimer: The provider makes no guarantees that the stocks or financial instruments mentioned herein comply with Islamic (Sharia) principles. It is the user’s responsibility to verify Sharia compliance, and consultation with a qualified Sharia advisor is strongly recommended before making any investment decisions

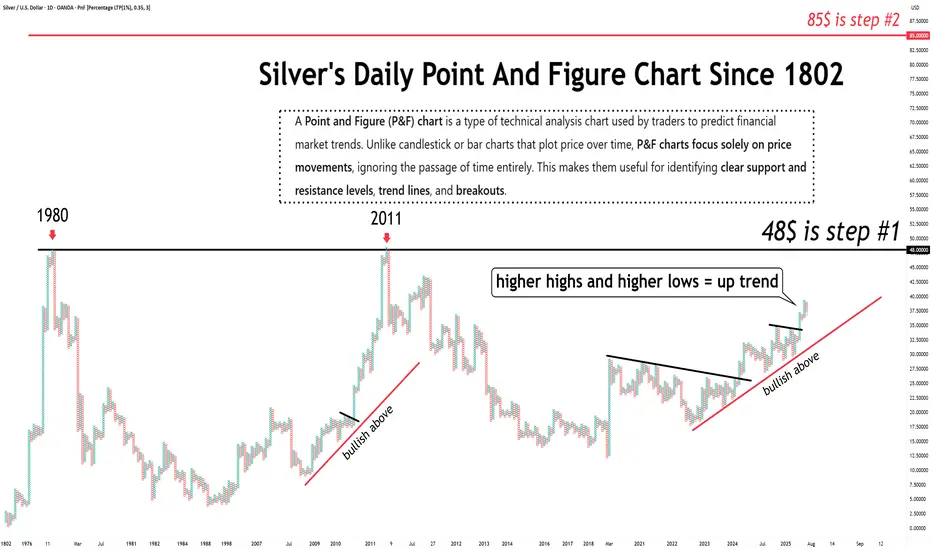
The long term prospects for silver are STILL bullish.Just so we are clear...
The long term prospects for silver are STILL bullish.
Once $48 is cleared, $85 becomes the next target.
this is familier patternis this a cup of tea pattern? i see a cup and handle this is a sign of bullish in next week
GBPJPY pullback for another bullish moveDaily candle closed with strong bullish.
A healthy pullback observed during Asian session.
I'm waiting at marking area for buy entry.
Calculate your own risk & reward.
Good Luck
Correction coming in....This channel is not providing individualized trading or investment advice, nor is it a banking service, brokerage service, trading service, investment service or money management service

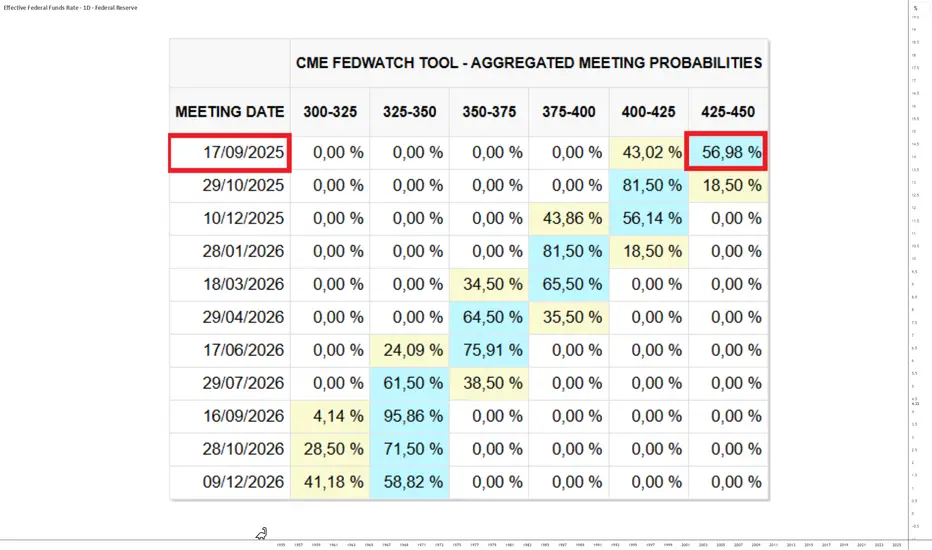
FED: An unlikely rate cut in September, unless…The United States Federal Reserve (FED) unveiled this week a new monetary policy decision, maintaining the status quo on interest rates—hence no change in the federal funds rate since December 2024. This did not prevent the S&P 500 from hitting new all-time highs, driven by GAFAM financial results and even the top ten companies by market capitalization, which now represent 40% of the S&P 500 composition. Jerome Powell’s FED has not indicated any timing for the resumption of rate cuts due to high uncertainty over the impact of tariffs on core PCE inflation (the FED’s preferred inflation measure).
1) The probability of a rate cut on Wednesday, September 17 has dropped below 50%
This week was extremely rich in fundamentals: Powell’s FED spoke, GAFAM released their earnings, PCE inflation was updated, trade agreements were signed, and the NFP report will be published this Friday.
After Powell’s FED reaffirmed there is no urgency to resume rate cuts, the implied probability of a rate cut on September 17 fell below 50%.
The consensus scenario—a September cut—is now questioned by new expectations from high finance and the 12 voting FOMC members.
2) Core PCE inflation, the FED’s favorite index, is no longer falling. The FED’s target is near but disinflation is paused just above it
Is Powell justified in maintaining the status quo? Yes, in absolute terms: disinflation has paused due to tariffs. The chart shows the core PCE inflation curve has flattened. The FED’s target is near, but a further decline would be needed to justify rate cuts. Only concern over labor market health could raise the probability above 50%.
3) Tariffs emerging from recent trade agreements with key U.S. partners are likely to keep PCE inflation above the FED’s target (temporarily)
As trade deals are finalized (China remains pending, deadline later in August), we can assess tariff impacts on core PCE. At this stage—with most deals involving tariffs of 15–20%—the impact on core PCE is estimated at 0.3%. This should keep PCE above the FED’s target early in the fall, but only temporarily, with no second inflation wave expected.
DISCLAIMER:
This content is intended for individuals who are familiar with financial markets and instruments and is for information purposes only. The presented idea (including market commentary, market data and observations) is not a work product of any research department of Swissquote or its affiliates. This material is intended to highlight market action and does not constitute investment, legal or tax advice. If you are a retail investor or lack experience in trading complex financial products, it is advisable to seek professional advice from licensed advisor before making any financial decisions.
This content is not intended to manipulate the market or encourage any specific financial behavior.
Swissquote makes no representation or warranty as to the quality, completeness, accuracy, comprehensiveness or non-infringement of such content. The views expressed are those of the consultant and are provided for educational purposes only. Any information provided relating to a product or market should not be construed as recommending an investment strategy or transaction. Past performance is not a guarantee of future results.
Swissquote and its employees and representatives shall in no event be held liable for any damages or losses arising directly or indirectly from decisions made on the basis of this content.
The use of any third-party brands or trademarks is for information only and does not imply endorsement by Swissquote, or that the trademark owner has authorised Swissquote to promote its products or services.
Swissquote is the marketing brand for the activities of Swissquote Bank Ltd (Switzerland) regulated by FINMA, Swissquote Capital Markets Limited regulated by CySEC (Cyprus), Swissquote Bank Europe SA (Luxembourg) regulated by the CSSF, Swissquote Ltd (UK) regulated by the FCA, Swissquote Financial Services (Malta) Ltd regulated by the Malta Financial Services Authority, Swissquote MEA Ltd. (UAE) regulated by the Dubai Financial Services Authority, Swissquote Pte Ltd (Singapore) regulated by the Monetary Authority of Singapore, Swissquote Asia Limited (Hong Kong) licensed by the Hong Kong Securities and Futures Commission (SFC) and Swissquote South Africa (Pty) Ltd supervised by the FSCA.
Products and services of Swissquote are only intended for those permitted to receive them under local law.
All investments carry a degree of risk. The risk of loss in trading or holding financial instruments can be substantial. The value of financial instruments, including but not limited to stocks, bonds, cryptocurrencies, and other assets, can fluctuate both upwards and downwards. There is a significant risk of financial loss when buying, selling, holding, staking, or investing in these instruments. SQBE makes no recommendations regarding any specific investment, transaction, or the use of any particular investment strategy.
CFDs are complex instruments and come with a high risk of losing money rapidly due to leverage. The vast majority of retail client accounts suffer capital losses when trading in CFDs. You should consider whether you understand how CFDs work and whether you can afford to take the high risk of losing your money.
Digital Assets are unregulated in most countries and consumer protection rules may not apply. As highly volatile speculative investments, Digital Assets are not suitable for investors without a high-risk tolerance. Make sure you understand each Digital Asset before you trade.
Cryptocurrencies are not considered legal tender in some jurisdictions and are subject to regulatory uncertainties.
The use of Internet-based systems can involve high risks, including, but not limited to, fraud, cyber-attacks, network and communication failures, as well as identity theft and phishing attacks related to crypto-assets.
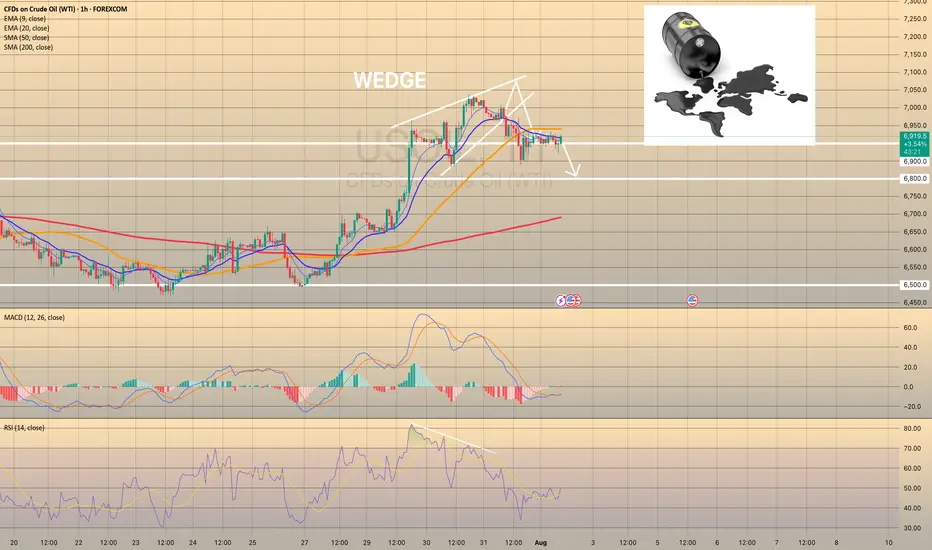
USOIL REACHED THE 6,900.00 SUPPORT LEVEL. WHAT'S NEXT?USOIL REACHED THE 6,900.00 SUPPORT LEVEL. WHAT'S NEXT?
As we told July 31, the price got reversed towards first support level of 6,900.00. Market participants are waiting for the OPEC+ meeting this week, expecting a significant output hike. Currently, the price sits slightly above the support level. Although, the asset trades above this level, considering the current weakness of the asset, further decline is expected. The 6,800.00 support level is the next target here.
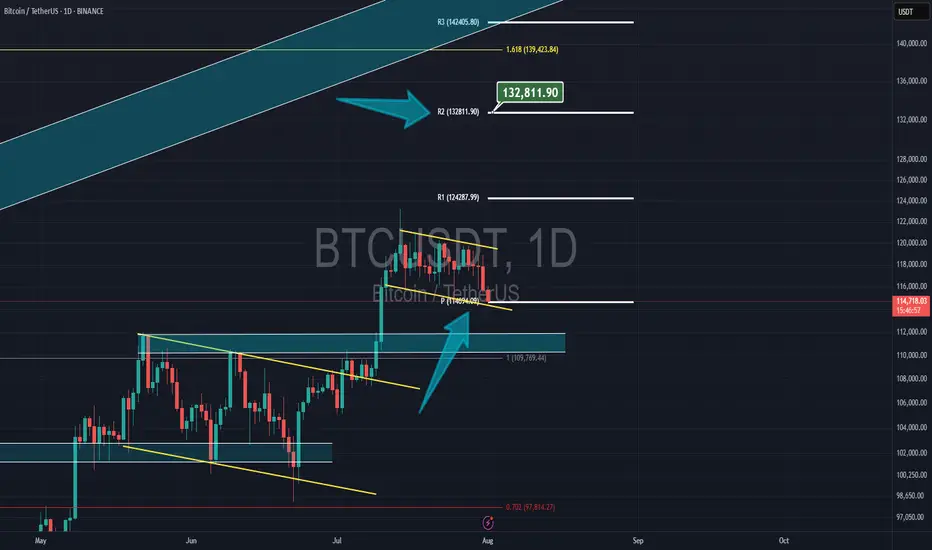
Bitcoin & NEW monthly PivotBitcoin had a correction yesterday but now its still above the new monthly pivot at $14,700 and my target is the 2nd resistance of the pivot at $132,800
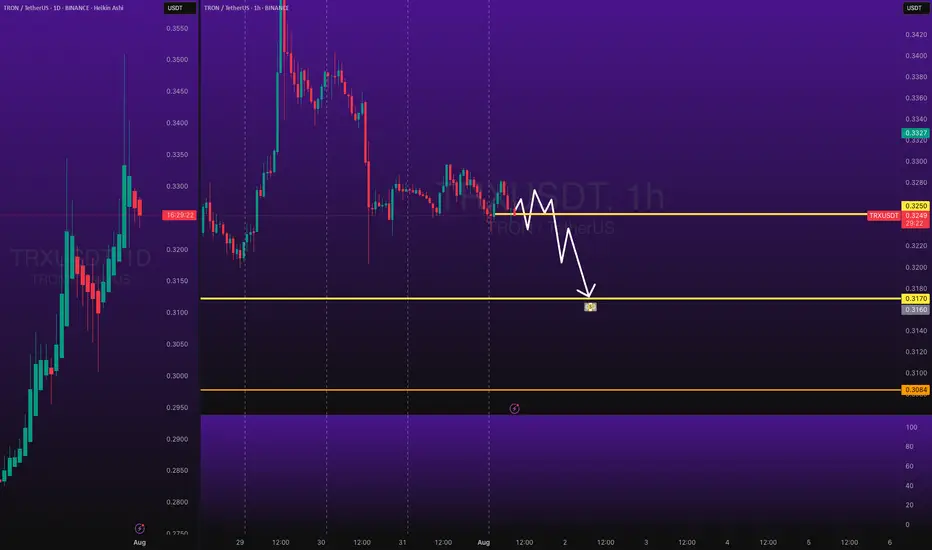
TRXUSDT Short Trade - Price CorrectionsBINANCE:TRXUSDT Short Day Trade - Low Risk, with my back testing of this strategy, it hits multiple possible take profits, manage your position accordingly.
Note: Manage your risk yourself, its risky trade, see how much your can risk yourself on this trade.
Use proper risk management
Looks like good trade.
Lets monitor.
Use proper risk management.
Disclaimer: only idea, not advice
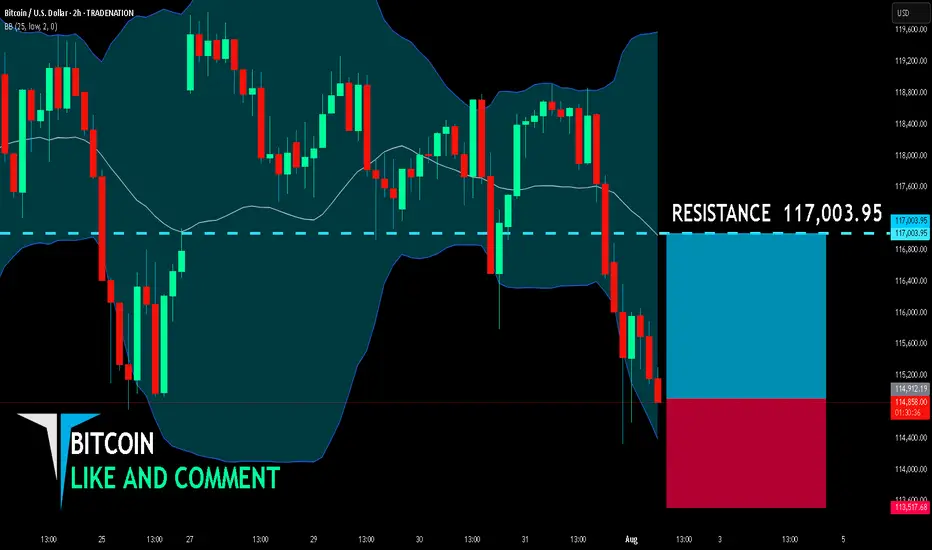
BITCOIN SENDS CLEAR BULLISH SIGNALS|LONG
BITCOIN SIGNAL
Trade Direction: long
Entry Level: 114,912.19
Target Level: 117,003.95
Stop Loss: 113,517.68
RISK PROFILE
Risk level: medium
Suggested risk: 1%
Timeframe: 2h
Disclosure: I am part of Trade Nation's Influencer program and receive a monthly fee for using their TradingView charts in my analysis.
✅LIKE AND COMMENT MY IDEAS✅
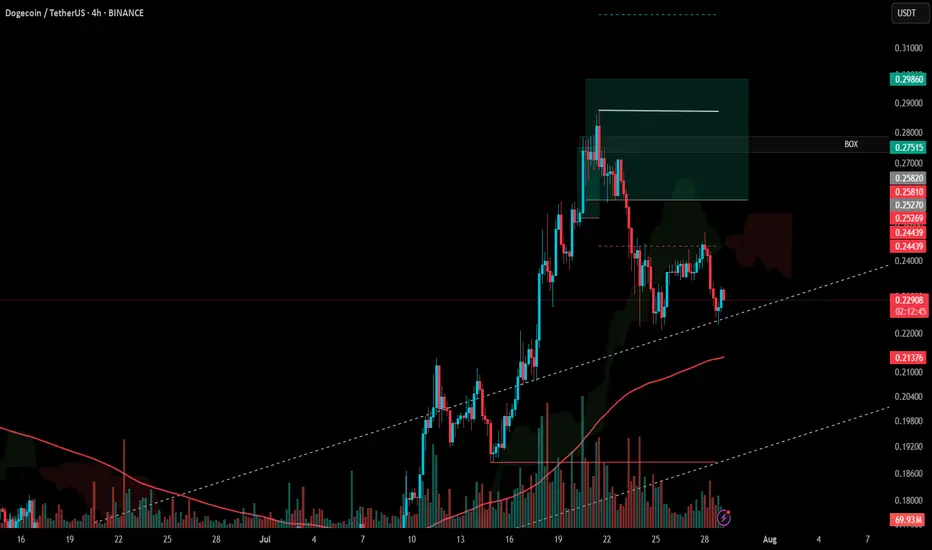
#DOGE Update #3 – July 29, 2025#DOGE Update #3 – July 29, 2025
I’m still holding my Doge position and haven’t been stopped out. I plan to lower my average cost by adding to the position at potential reversal zones. This is how I intend to proceed. My entry level is currently $0.2583, and my target is $0.2986, which means I’m aiming for roughly a 15% profit.
At the moment, the price has pulled back about 11% from that level. There’s nothing to worry about—it’s perfectly normal. Doge is continuing its movement by taking support from the bottom of an upward trend. I’m still in the position and planning to exit with profit without setting a stop.
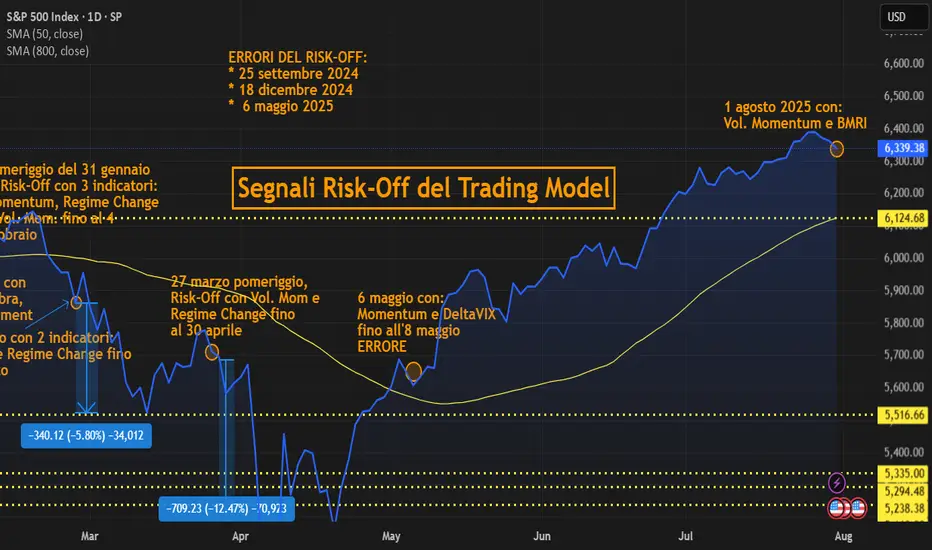
Risk-Off SignalsRisk-Off: 1 August with 2 indicators:
Voil. Momentum and Bear Market Risk Indicators (BMRI)
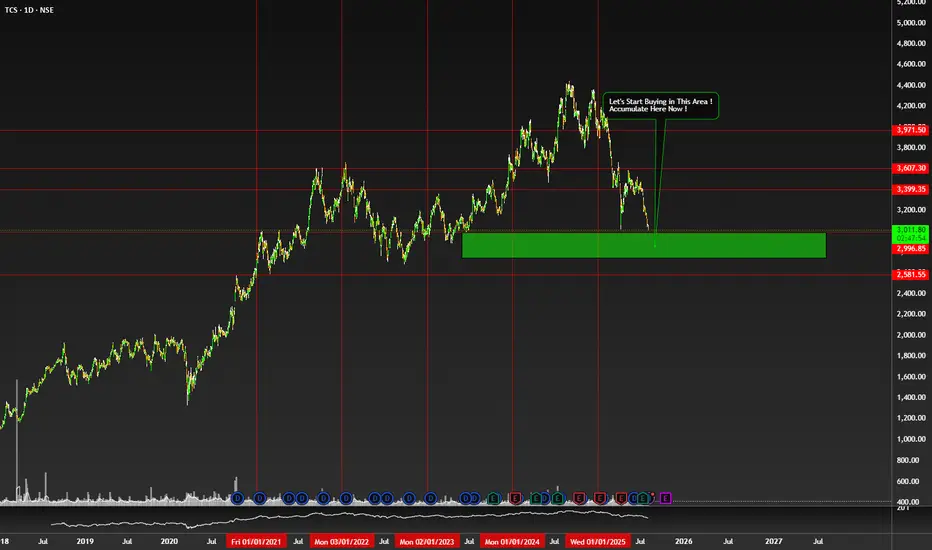
Time To Accumulate $NSE:TCS NSE:TCS
My Trade Opinion
Let's Accumulate here in Green area.
Best time to Buy here.
Don't Buy if Some One Think IT will Dead in india. :D
Future is at Some Time Ahead.
Don't Listen Just Observe it.
Company is Going to Aggressively Progress in Future.