USOIL WTIWest Texas Intermediate (WTI) oil is a major benchmark for crude oil pricing, known for its high quality—being both light and sweet due to its low sulfur content and low density. WTI is sourced primarily from inland Texas and is the underlying commodity for oil futures traded on the New York Mercantile Exchange (NYMEX). The main physical delivery point is Cushing, Oklahoma, a critical U.S. oil storage and trading hub.
Current Price (as of August 1, 2025)
WTI crude oil is trading around $69.15–$69.36 per barrel.
Recently, WTI prices have seen volatility due to global economic factors, including U.S. tariffs, OPEC+ production, and shifts in oil demand. Despite a small decline on the day, oil prices have posted their strongest weekly performance since June, rising over 6% for the week.
Market and Outlook
Recent price movement reflects concerns about global trade tensions, new tariffs, and their impact on economic growth and energy demand. At the same time, supply risks remain due to geopolitical factors such as potential sanctions on Russian oil and U.S.-China trade developments.
Analyst forecasts for the remainder of 2025 suggest continued volatility, with WTI potentially ranging between $56 and $73 per barrel, influenced by demand, OPEC+ decisions, and geopolitical events.
Quick Facts Table
Feature Detail
Type Light, sweet crude
Benchmark NYMEX (U.S.), major global reference
Main Delivery Point Cushing, Oklahoma
Latest Price (Aug 1, 2025) $69.15–$69.36 per barrel
Typical Drivers U.S. tariffs, OPEC+ decisions, trade policy, supply risks, global demand
WTI oil plays a central role in global energy markets, serving as a benchmark for North American and international oil pricing. Its price reflects both supply fundamentals and broader macroeconomic and geopolitical developments.
#OIL #WTI
Community ideas

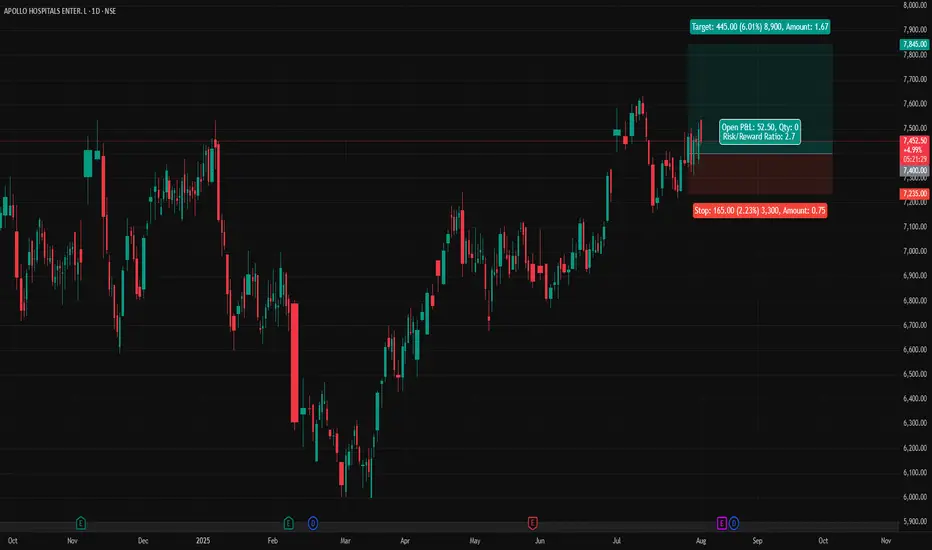
APOLLOHOSP - Apollo Hospitals (Daily chart, NSE) - Long PositionAPOLLOHOSP - Apollo Hospitals Enterprise Ltd. (Daily chart, NSE) - Long Position
Risk assessment: Medium {support structure integrity risk}
Risk/Reward ratio ~ 2.7
Current Market Price (CMP) ~ 7450
Entry limit ~ 7400 on Aug. 01, 2025
Target limit ~ 7845 (+6.01%; +445 points)
Stop order limit ~ 7235 (-2.23%; -165 points)
Disclaimer: Investments in securities markets are subject to market risks. All information presented in this group is strictly for reference and personal study purposes only and is not a recommendation and/or a solicitation to act upon under any interpretation of the letter.
LEGEND:
{curly brackets} = observation notes
= important updates
(parentheses) = information details
~ tilde/approximation = variable value
-hyphen = fixed value
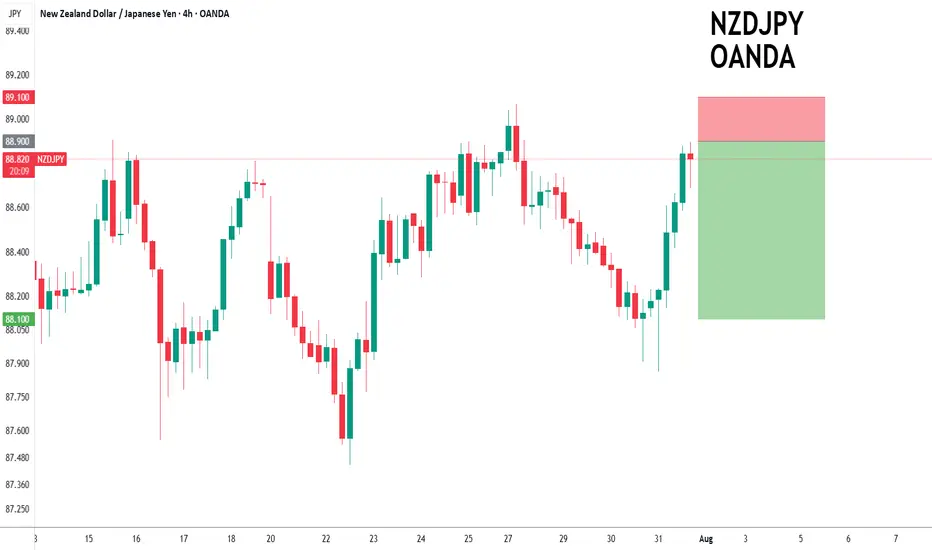
NZDJPY to find sellers at market price?NZDJPY - 24h expiry
Trading has been mixed and volatile.
Price action looks to be forming a top.
We look for a temporary move higher.
Preferred trade is to sell into rallies.
Bespoke resistance is located at 88.90.
We look to Sell at 88.90 (stop at 89.10)
Our profit targets will be 88.10 and 87.90
Resistance: 89.00 / 89.20 / 89.50
Support: 88.40 / 88.10 / 87.90
Risk Disclaimer
The trade ideas beyond this page are for informational purposes only and do not constitute investment advice or a solicitation to trade. This information is provided by Signal Centre, a third-party unaffiliated with OANDA, and is intended for general circulation only. OANDA does not guarantee the accuracy of this information and assumes no responsibilities for the information provided by the third party. The information does not take into account the specific investment objectives, financial situation, or particular needs of any particular person. You should take into account your specific investment objectives, financial situation, and particular needs before making a commitment to trade, including seeking, under a separate engagement, as you deem fit.
You accept that you assume all risks in independently viewing the contents and selecting a chosen strategy.
Where the research is distributed in Singapore to a person who is not an Accredited Investor, Expert Investor or an Institutional Investor, Oanda Asia Pacific Pte Ltd (“OAP“) accepts legal responsibility for the contents of the report to such persons only to the extent required by law. Singapore customers should contact OAP at 6579 8289 for matters arising from, or in connection with, the information/research distributed.
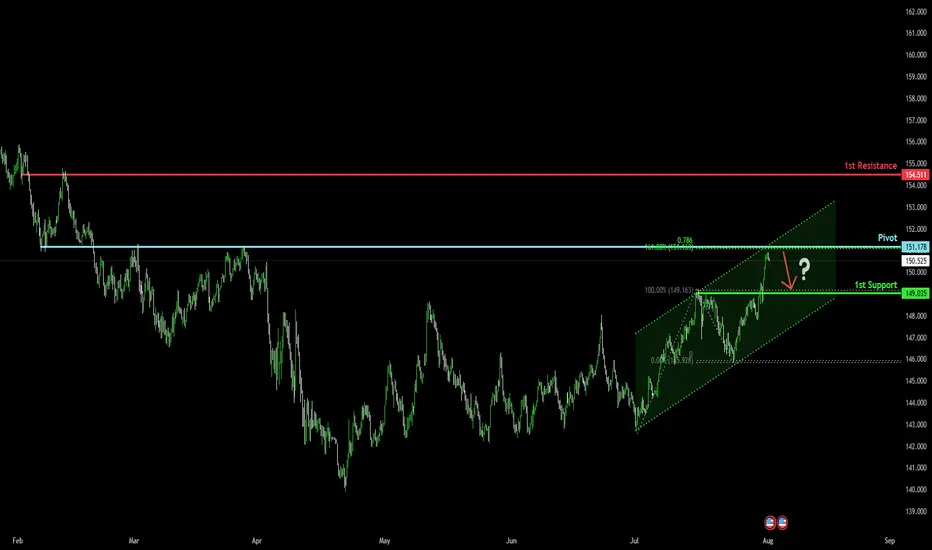
Bearish reversal off overlap resistance?USD/JPY is rising towards the pivot, which has been identified as an overlap resistance and could drop to the 1st support.
Pivot: 151.17
1st Support: 149.03
1st Resistance: 154.51
Risk Warning:
Trading Forex and CFDs carries a high level of risk to your capital and you should only trade with money you can afford to lose. Trading Forex and CFDs may not be suitable for all investors, so please ensure that you fully understand the risks involved and seek independent advice if necessary.
Disclaimer:
The above opinions given constitute general market commentary, and do not constitute the opinion or advice of IC Markets or any form of personal or investment advice.
Any opinions, news, research, analyses, prices, other information, or links to third-party sites contained on this website are provided on an "as-is" basis, are intended only to be informative, is not an advice nor a recommendation, nor research, or a record of our trading prices, or an offer of, or solicitation for a transaction in any financial instrument and thus should not be treated as such. The information provided does not involve any specific investment objectives, financial situation and needs of any specific person who may receive it. Please be aware, that past performance is not a reliable indicator of future performance and/or results. Past Performance or Forward-looking scenarios based upon the reasonable beliefs of the third-party provider are not a guarantee of future performance. Actual results may differ materially from those anticipated in forward-looking or past performance statements. IC Markets makes no representation or warranty and assumes no liability as to the accuracy or completeness of the information provided, nor any loss arising from any investment based on a recommendation, forecast or any information supplied by any third-party.
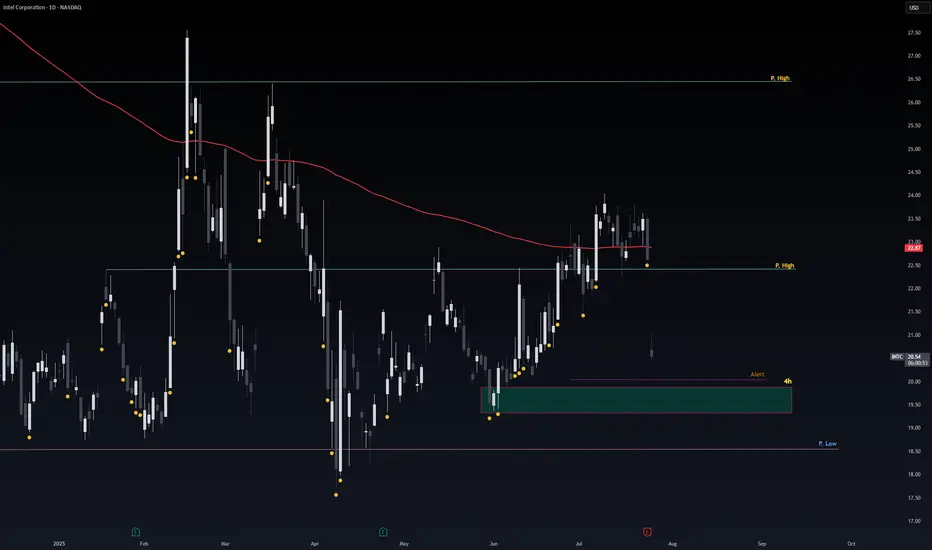
Safe Entry IntelThe 4h Green Zone is Safe & Strong Support for Intel.
If not respected the Pink Line is Second Strong support level.
Note: 1- Potentional of Strong Buying Zone:
We have two scenarios must happen at The Mentioned Zone:
Scenarios One: strong buying volume with reversal Candle.
Scenarios Two: Fake Break-Out of The Buying Zone.
Both indicate buyers stepping in strongly. NEVER Join in unless one showed up.
2- How to Buy Stock (safe way):
On 1H TF when Marubozu/Doji Candle show up which indicate strong buyers stepping-in.
Buy on 0.5 Fibo Level of the Marubozu/Doji Candle, because price will always and always re-test the
Bounce From Final Liquidity or Start of a Bullish Move? Bounce From Final Liquidity or Start of a Bullish Move?
After the FOMC event, gold completed a sweep of the final liquidity zone at 3269–3271 and rebounded strongly, in line with the broader bullish trend. The price has now recovered sharply and is gradually returning to the liquidity zones left behind after yesterday’s sharp drop.
📍 At the moment, gold is reacting around 3295, which aligns with a CP (Compression Point) Zone on the M30 chart. We're seeing a slight pullback here, and another retracement could occur before a strong upward continuation — potentially breaking out of the descending trendline that’s formed over recent days.
📊 Trading Plan & Key Levels
✅ BUY ZONE – Trend Continuation Setup
Entry: 3286–3284
Stop Loss: 3278
Take Profits:
3290 → 3294 → 3298 → 3304 → 3308 → 3312 → 3316 → 3320 → 3330 → …
💡 This is a prime area to look for re-entries into the dominant bullish move. Price action left a clean liquidity zone below after the aggressive upside reaction — ideal for riding the next wave.
❌ SELL ZONE – Only Valid Below VPOC
Entry: 3328–3330 (Volume Point of Control)
Stop Loss: 3335
Take Profits:
3324 → 3320 → 3315 → 3310 → 3305 → 3300
🔻 This is a high-probability short only if price stays below 3330. If gold closes above this VPOC region, the structure shifts to bullish and we should look for sells higher up — around 335x–337x zones.
📅 Monthly Candle Close – Watch for Indecision
As it’s the last trading day of the month, note that the past two monthly candles have printed doji-like wicks, signalling indecision and liquidity grabs. The market is still waiting for a clearer signal from the Fed on the first potential rate cut of the year.
🚫 Avoid emotional trading. This is a highly reactive environment, so careful risk management is key.
🧭 Final Thoughts
Gold continues to respect market structure and liquidity theory. The first major test lies at the 3313 resistance level — if broken, it opens the door to stronger bullish momentum toward the broader VPOC zone.
⏳ Be patient and only act when price confirms your bias.

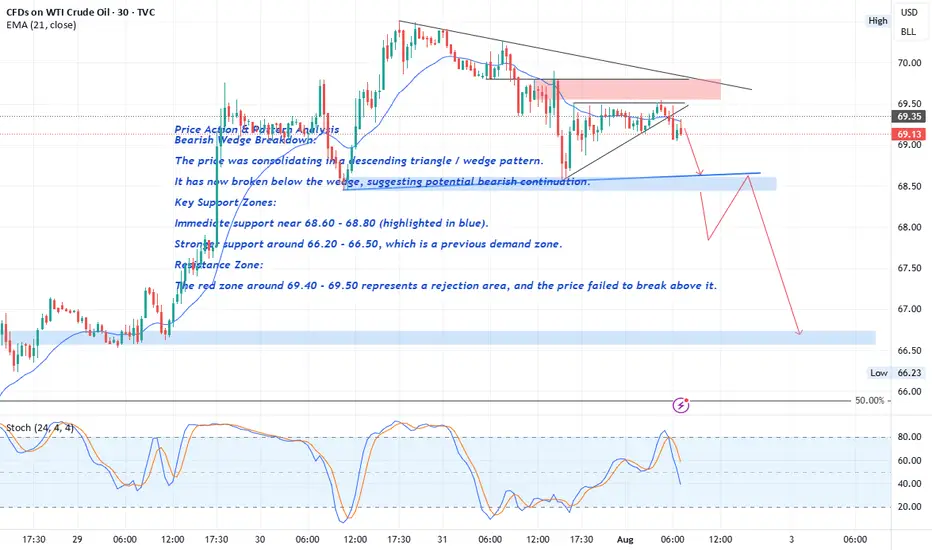
Crude Oil Price Action & Pattern Analysis
Bearish Wedge Breakdown:
The price was consolidating in a descending triangle / wedge pattern.
It has now broken below the wedge, suggesting potential bearish continuation.
Key Support Zones:
Immediate support near 68.60 - 68.80 (highlighted in blue).
FOREXCOM:USOIL
The break of the 68.60 level with a strong bearish candle would serve as confirmation of a Head and Shoulders (H&S) pattern , with solid bearish implications.
Stronger support around 66.20 - 66.50 , which is a previous demand zone.
Resistance Zone:
The red zone around 69.40 - 69.50 represents a rejection area , and the price failed to break above it.
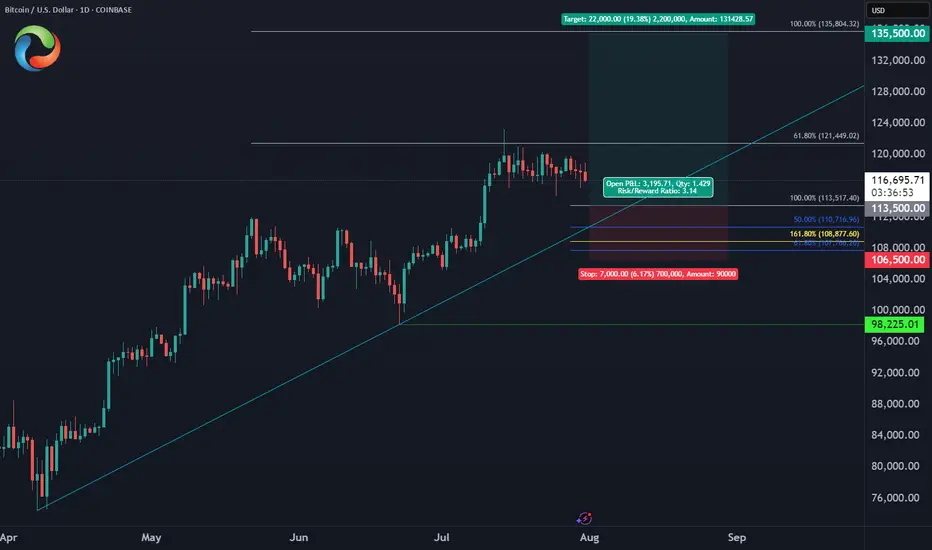
Bitcoin August Trade PlanBINANCE:BTCUSD
✅Entry Zone: $113,500 - $110,700
⛔️Stop: $106,500 (below June low)
🎯Target: $135,500 (ATH liquidity)
🔖Risk/Reward: 1:3
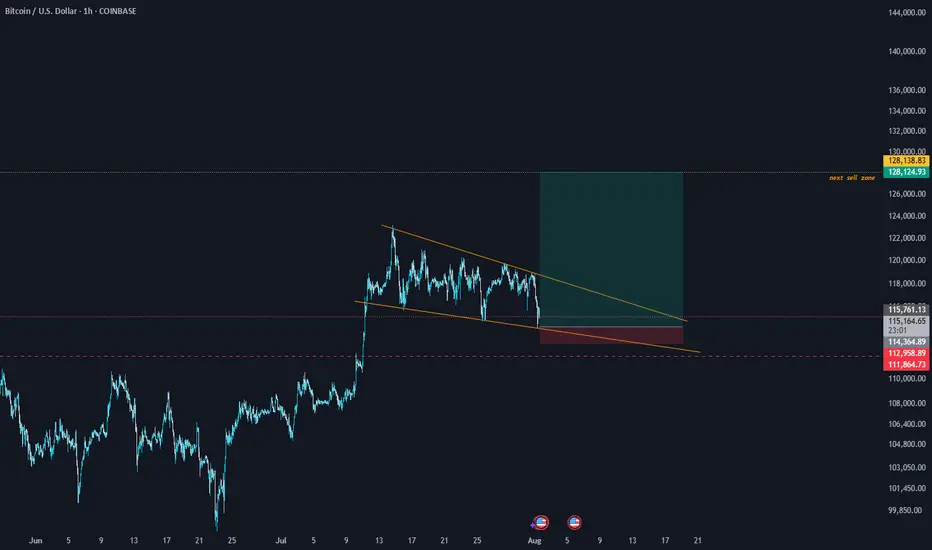
BTCUSD long my predict up to 128100
long possible entry 115150
take profit 128100
stop loss 113000
swing long
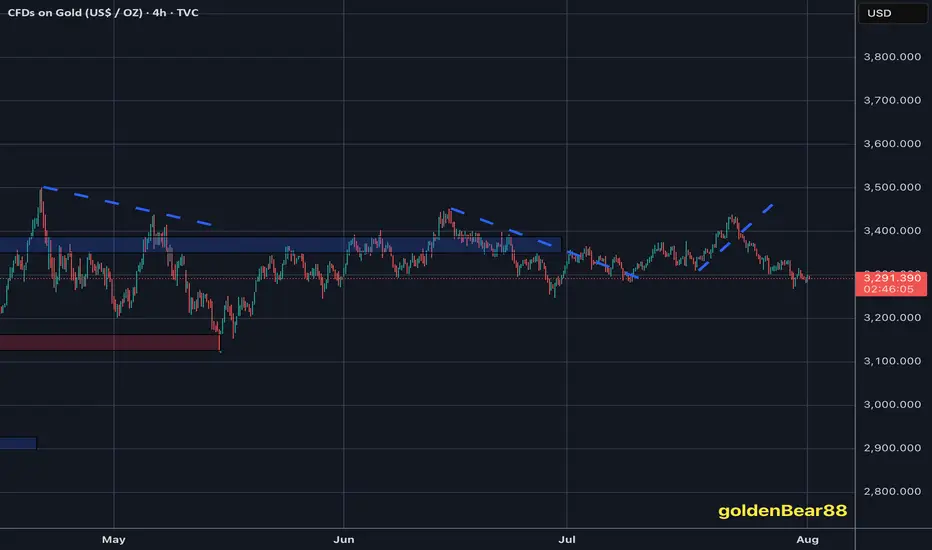
I maintain my #3,277.80 and #3,252.80 TargetsI didn't engaged any re-Sell orders throughout yesterday's session and re-Sold Gold on #3,295.80 ahead of Asian session, with plan to keep orders over-night. However due NFP, Gold might be stationary / ranging until the news as I closed both of my orders on #3,291.80 / each #9.000 Eur Profit and my #3,300.80 pending Sell limit has been triggered over-night which is now running in Profits with Stop on breakeven. I do expect #3,277.80 and #3,252.80 Targets to be met within #1 - #3 sessions and if there aren't NFP numbers, I would keep all three orders / set of Selling orders maintaining my first #3,277.80 Target. Due the news, Gold might fluctuate within Neutral Rectangle until the news.
Technical analysis: My earlier Selling configuration / Technical expectations was confirmed on Hourly 4 chart under prolonged weakness and Price-action respecting the trend-line guarding the downtrend (very Bearish formation) as Hourly 1 chart is already an aggressive Descending Channel (width opened on Williams) that should reach it’s next local Low’s (currently Trading slightly below Double Bottom) and Oversold state near my take Profit of #3,252.80 benchmark. If the bands are widened Traders may witness #3,277.80 test, also if gets invalidated and #3,270.80 gives away, #3,252.80 mark extension test is inevitable. In any case I will update my Targets or levels of Profit taking if I decide to exit earlier than #3,252.80 benchmark to be in accordance with the Daily chart’s period / I already ride Selling wave since #,3,300's and my Profit will be already good to ignore.
My position: DX is soaring, Gold is under Bearish Technical developments and #3,252.80 benchmark is my final Target of current Selling leg. Only factor which can reverse this Intra-day but not postpone is NFP. I expect downside Jobs surprise which may reverse DX from local High's however hot upside surprise will make Gold test #3,252.80 Intra-day. NFP or not I do believe Gold is Bearish. Trade accordingly.
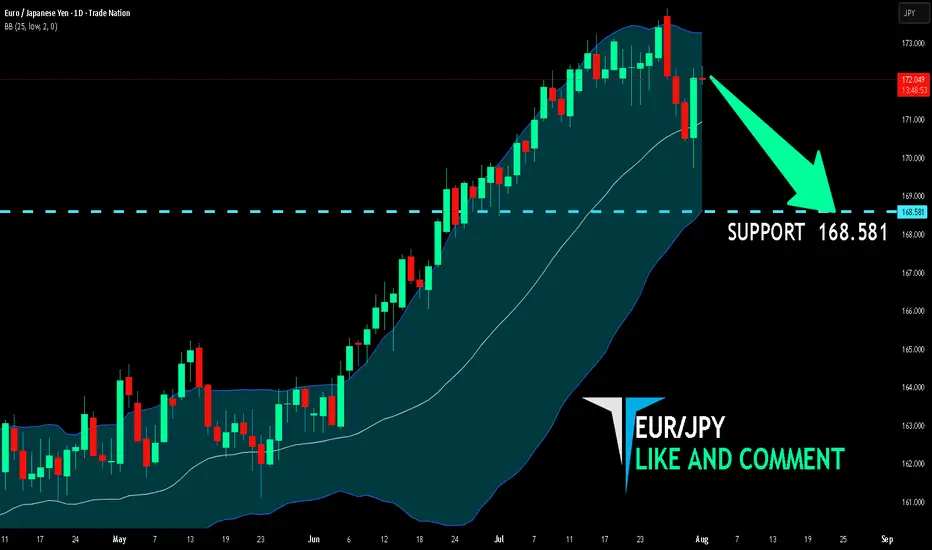
EUR/JPY BEARISH BIAS RIGHT NOW| SHORT
Hello, Friends!
We are now examining the EUR/JPY pair and we can see that the pair is going up locally while also being in a uptrend on the 1W TF. But there is also a powerful signal from the BB upper band being nearby, indicating that the pair is overbought so we can go short from the resistance line above and a target at 168.581 level.
Disclosure: I am part of Trade Nation's Influencer program and receive a monthly fee for using their TradingView charts in my analysis.
✅LIKE AND COMMENT MY IDEAS✅
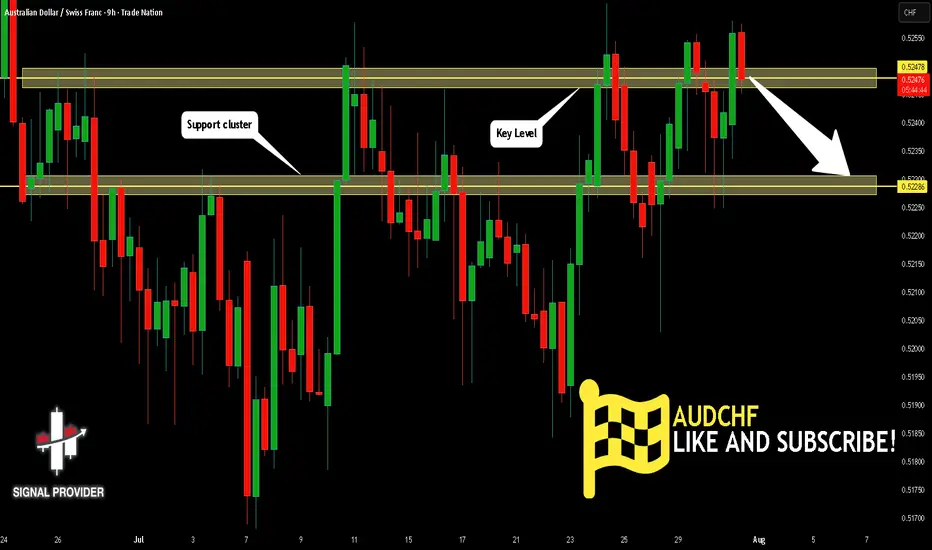
AUDCHF Will Go Down! Short!
Here is our detailed technical review for AUDCHF.
Time Frame: 9h
Current Trend: Bearish
Sentiment: Overbought (based on 7-period RSI)
Forecast: Bearish
The market is on a crucial zone of supply 0.524.
The above-mentioned technicals clearly indicate the dominance of sellers on the market. I recommend shorting the instrument, aiming at 0.522 level.
P.S
Please, note that an oversold/overbought condition can last for a long time, and therefore being oversold/overbought doesn't mean a price rally will come soon, or at all.
Disclosure: I am part of Trade Nation's Influencer program and receive a monthly fee for using their TradingView charts in my analysis.
Like and subscribe and comment my ideas if you enjoy them!
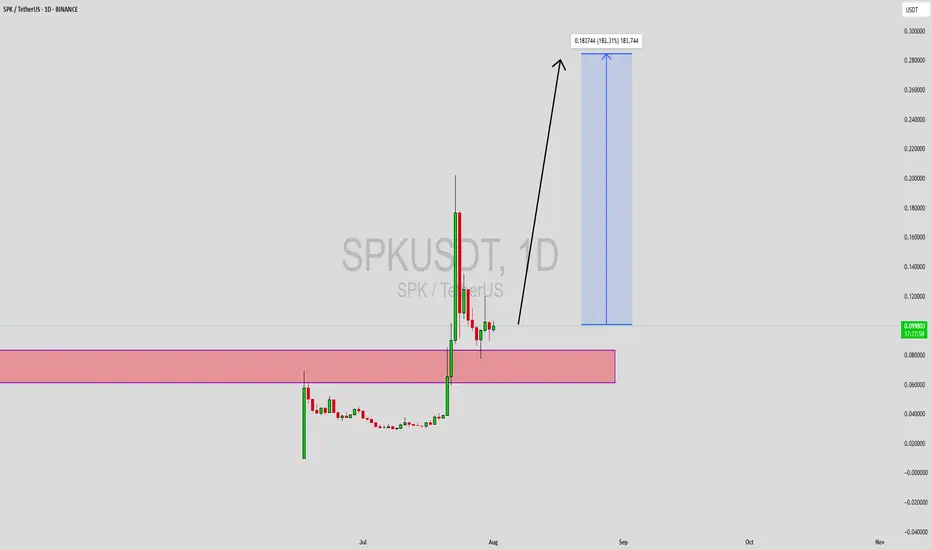
SPKUSDT Forming Bullish ReversalSPKUSDT is currently showing signs of a strong bullish reversal pattern, positioning itself as one of the most technically attractive altcoins on the radar. After an extended downtrend, the price has found solid support at a key demand zone, which has historically acted as a base for significant rallies. The latest price action has formed a clear reversal structure, signaling a potential shift in momentum from sellers to buyers. This early signal of trend reversal is supported by increasing volume, indicating strong accumulation at lower levels.
This setup is gaining traction among traders and crypto investors who are beginning to take interest in SPK due to its attractive risk-to-reward ratio and potential for explosive gains. The expected move targets a 140% to 150% upside, which aligns with previous recovery waves observed in similar patterns. Technical indicators such as the RSI and MACD may also begin to align in favor of bulls, further supporting the thesis for a major trend reversal. This gives traders the confidence to anticipate a breakout rally in the coming weeks.
The fundamentals behind SPKUSDT are also gaining visibility, as the project's roadmap and utility continue to attract community attention. In the current market cycle, low-cap and mid-cap assets that show early reversal signs often outperform during recovery phases. With growing investor interest and a chart that supports a major move, SPKUSDT is a pair that deserves close monitoring. The breakout confirmation above recent resistance levels could act as a strong signal for the next upward leg.
This is a prime opportunity for swing and mid-term traders to take advantage of a potentially explosive move. With volume building and sentiment improving, SPKUSDT could be setting up for a rally that outpaces many other altcoins in the same category.
✅ Show your support by hitting the like button and
✅ Leaving a comment below! (What is You opinion about this Coin)
Your feedback and engagement keep me inspired to share more insightful market analysis with you!
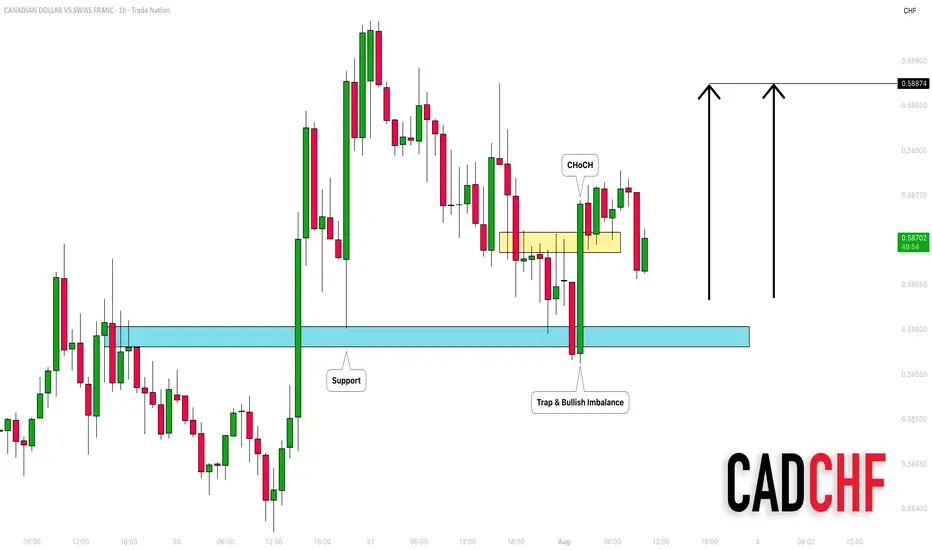
CADCHF: Bullish Move After the Trap 🇨🇦🇨🇭
There is a high chance that CADCHF will go up today.
After a test of a key horizontal support, the price formed
a liquidity grab with a consequent bullish imbalance.
We can expect growth to 0.5887
❤️Please, support my work with like, thank you!❤️
I am part of Trade Nation's Influencer program and receive a monthly fee for using their TradingView charts in my analysis.
RUNE at the Brink: Rebound Opportunity or Breakdown Incoming?🧩 Overview:
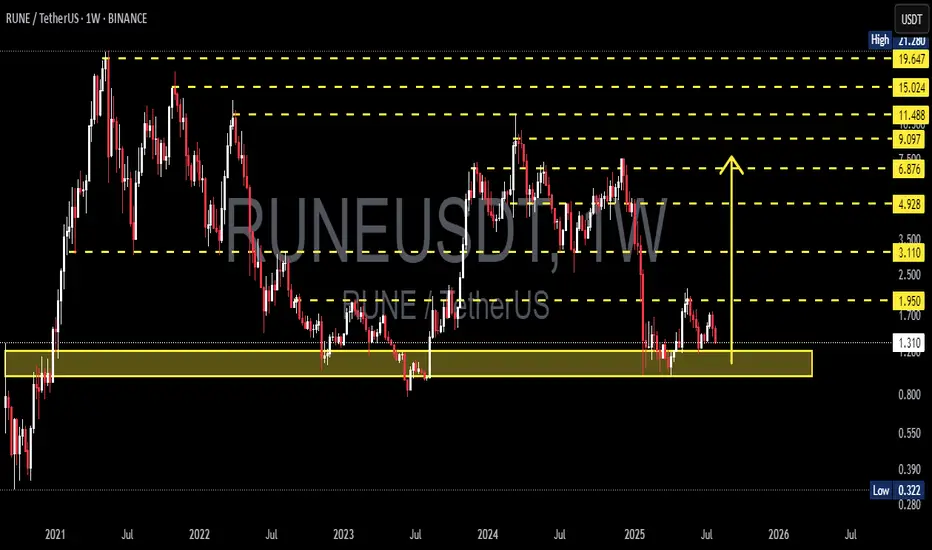
RUNE/USDT is currently hovering at a critical support zone — a historical demand area that has triggered strong bullish rallies in the past. Positioned between $1.00–$1.30, this level has been a battle ground between buyers and sellers. The big question now: Will RUNE bounce for a bullish reversal or break down into deeper lows?
---
🔍 Key Levels Identified:
Major Support Zone (Demand Area): $1.00 – $1.30 (yellow box)
Immediate Resistance: $1.95 → $3.11 → $4.92
Extended Bullish Targets: $6.87 → $9.09 → $11.48 → $15.02
Deeper Bearish Targets (if support fails): $0.80 → $0.55 → $0.32
---
🟢 Bullish Scenario (Recovery Rally):
📌 Key Signal: Strong hold and price reaction above the $1.00–$1.30 zone.
1. Reversal Patterns: Look for double bottom, bullish engulfing, or strong weekly pin bars to signal a potential reversal.
2. Momentum Confirmation: A breakout above $1.95 with high volume could trigger a strong continuation to $3.11 and $4.92.
3. Macro Tailwinds: A broader recovery in Bitcoin and the crypto market could enhance bullish pressure on altcoins like RUNE.
🎯 Mid to Long-Term Bullish Targets:
$3.11 → $4.92 → $6.87+
Potential upside of 200–400%+ from current levels if bullish structure confirms.
---
🔴 Bearish Scenario (Breakdown):
📌 Critical Risk: Weekly candle close below $1.00 with volume confirmation.
1. Support Breakdown: If $1.00 fails, price may revisit previous lows around $0.80 or even test historical demand levels at $0.32.
2. Bearish Continuation Pattern: Sustained lower highs and lower lows suggest downtrend continuation unless invalidated.
3. Volume Pressure: Heavy sell volume on breakdowns reinforces bearish bias.
⚠️ Bearish Targets: $0.80 → $0.55 → $0.322 (historical low)
---
🔄 Pattern & Structure:
Historical Accumulation Zone: The yellow box has been a long-term accumulation area since 2021.
Repeat Behavior: Previous touches to this zone sparked multi-week rallies.
Potential Wyckoff Accumulation: If price forms a sideways range with rising lows, this may be the early stage of a markup phase.
---
🧠 Strategic Outlook for Traders:
✅ Bullish Strategy:
Conservative entry: Wait for breakout + retest of $1.95
Aggressive entry: Accumulate within $1.00–$1.30 zone with tight stop below $0.98
❌ Bearish Strategy:
Short setup on confirmed breakdown below $0.98
Avoid trading without confirmation of direction (no FOMO)
---
🚀 Conclusion:
RUNE is standing at a make-or-break level — a tipping point between a bullish breakout or further bearish pressure. Smart traders don't just predict direction; they prepare for both outcomes. This is not just a technical zone — it's the market’s decision point.
#RUNE #RUNEUSDT #CryptoAnalysis #AltcoinWatch #BreakoutSetup #DemandZone #TechnicalAnalysis #CryptoOutlook #BullishScenario #BearishScenario #Wyckoff
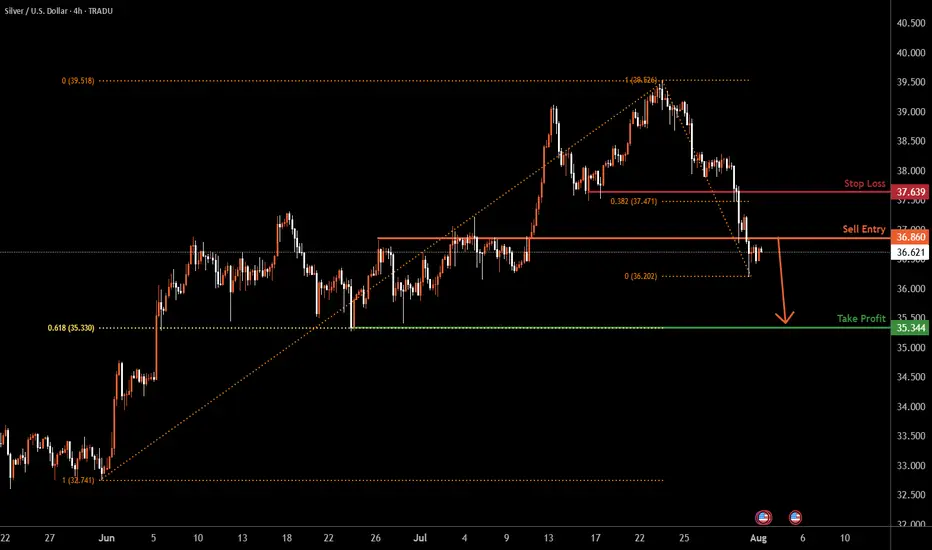
Silver H4 | Potential bearish dropBased on the H4 chart analysis, we could see the price reverse from the sell entry at 3.86, and could drop from this level to the downside.
Stop loss is at 37.63, which is a pullback resistance that is slightly above the 38.2% Fibonacci retracement.
Take profit is at 35.34, which is a swing low support that lines up with th e 61.8% Fibonacci retraecment.
High Risk Investment Warning
Trading Forex/CFDs on margin carries a high level of risk and may not be suitable for all investors. Leverage can work against you.
Stratos Markets Limited (tradu.com ):
CFDs are complex instruments and come with a high risk of losing money rapidly due to leverage. 65% of retail investor accounts lose money when trading CFDs with this provider. You should consider whether you understand how CFDs work and whether you can afford to take the high risk of losing your money.
Stratos Europe Ltd (tradu.com ):
CFDs are complex instruments and come with a high risk of losing money rapidly due to leverage. 66% of retail investor accounts lose money when trading CFDs with this provider. You should consider whether you understand how CFDs work and whether you can afford to take the high risk of losing your money.
Stratos Global LLC (tradu.com ):
Losses can exceed deposits.
Please be advised that the information presented on TradingView is provided to Tradu (‘Company’, ‘we’) by a third-party provider (‘TFA Global Pte Ltd’). Please be reminded that you are solely responsible for the trading decisions on your account. There is a very high degree of risk involved in trading. Any information and/or content is intended entirely for research, educational and informational purposes only and does not constitute investment or consultation advice or investment strategy. The information is not tailored to the investment needs of any specific person and therefore does not involve a consideration of any of the investment objectives, financial situation or needs of any viewer that may receive it. Kindly also note that past performance is not a reliable indicator of future results. Actual results may differ materially from those anticipated in forward-looking or past performance statements. We assume no liability as to the accuracy or completeness of any of the information and/or content provided herein and the Company cannot be held responsible for any omission, mistake nor for any loss or damage including without limitation to any loss of profit which may arise from reliance on any information supplied by TFA Global Pte Ltd.
The speaker(s) is neither an employee, agent nor representative of Tradu and is therefore acting independently. The opinions given are their own, constitute general market commentary, and do not constitute the opinion or advice of Tradu or any form of personal or investment advice. Tradu neither endorses nor guarantees offerings of third-party speakers, nor is Tradu responsible for the content, veracity or opinions of third-party speakers, presenters or participants.
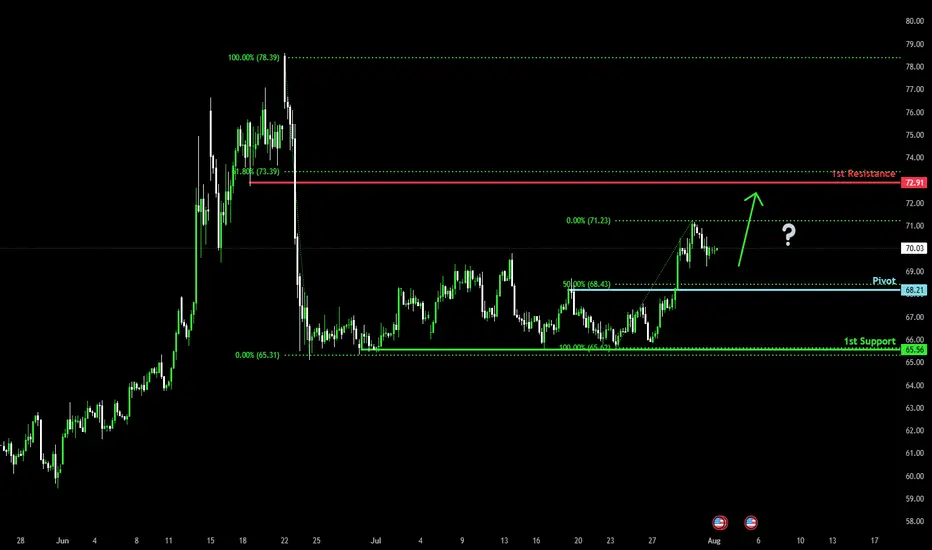
Falling towards 50% Fibonacci support?WTI Oil (XTI/USD) is falling towards the pivot, which has been identified as a pullback support and could bounce to the 1st resistance.
Pivot: 68.21
1st Support: 65.56
1st Resistance: 72.91
Risk Warning:
Trading Forex and CFDs carries a high level of risk to your capital and you should only trade with money you can afford to lose. Trading Forex and CFDs may not be suitable for all investors, so please ensure that you fully understand the risks involved and seek independent advice if necessary.
Disclaimer:
The above opinions given constitute general market commentary, and do not constitute the opinion or advice of IC Markets or any form of personal or investment advice.
Any opinions, news, research, analyses, prices, other information, or links to third-party sites contained on this website are provided on an "as-is" basis, are intended only to be informative, is not an advice nor a recommendation, nor research, or a record of our trading prices, or an offer of, or solicitation for a transaction in any financial instrument and thus should not be treated as such. The information provided does not involve any specific investment objectives, financial situation and needs of any specific person who may receive it. Please be aware, that past performance is not a reliable indicator of future performance and/or results. Past Performance or Forward-looking scenarios based upon the reasonable beliefs of the third-party provider are not a guarantee of future performance. Actual results may differ materially from those anticipated in forward-looking or past performance statements. IC Markets makes no representation or warranty and assumes no liability as to the accuracy or completeness of the information provided, nor any loss arising from any investment based on a recommendation, forecast or any information supplied by any third-party.
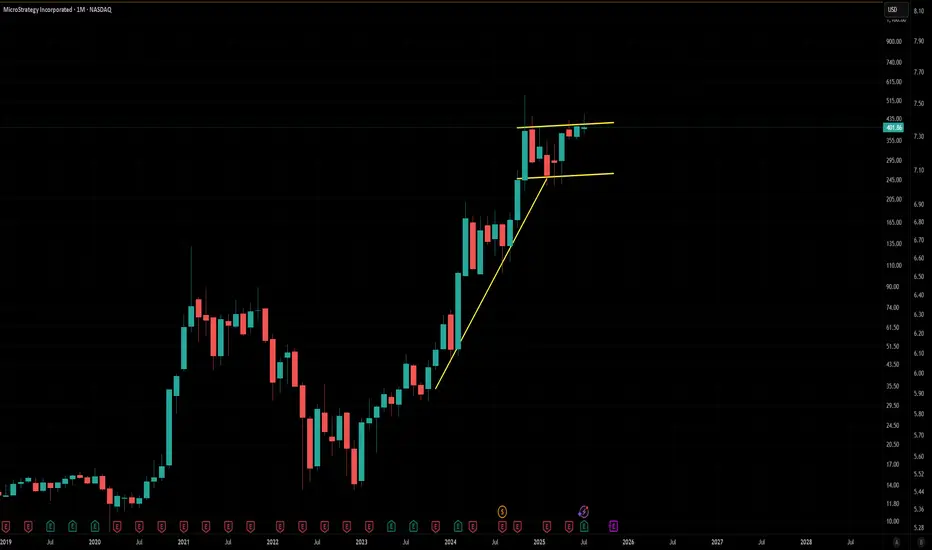
Monthly $MSTR Bullflag MicroStrategy is forming a textbook bull flag on the monthly, right after a massive vertical leg from sub-$200 to over $500.
Strong pole ✅
Tight consolidation near the highs ✅
Monthly closes holding above prior resistance ✅
This thing is coiling under ~$455. Once it breaks, it could easily send toward $800–1000+, especially if CRYPTOCAP:BTC keeps surging. BTC already confirmed a major cup & handle — MSTR just lagging a bit.
High timeframe structure + BTC correlation = explosive potential.
Watching for volume + breakout confirmation. Let’s see if it rips.
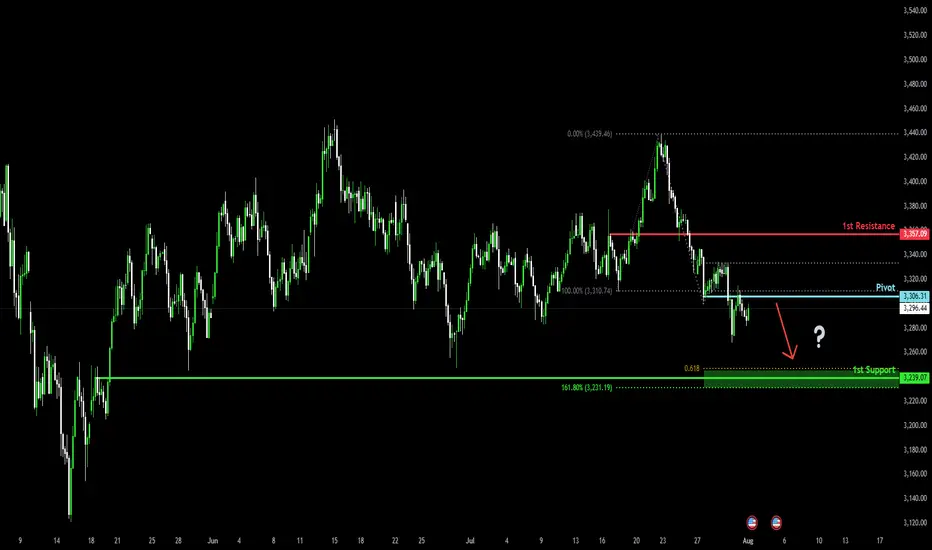
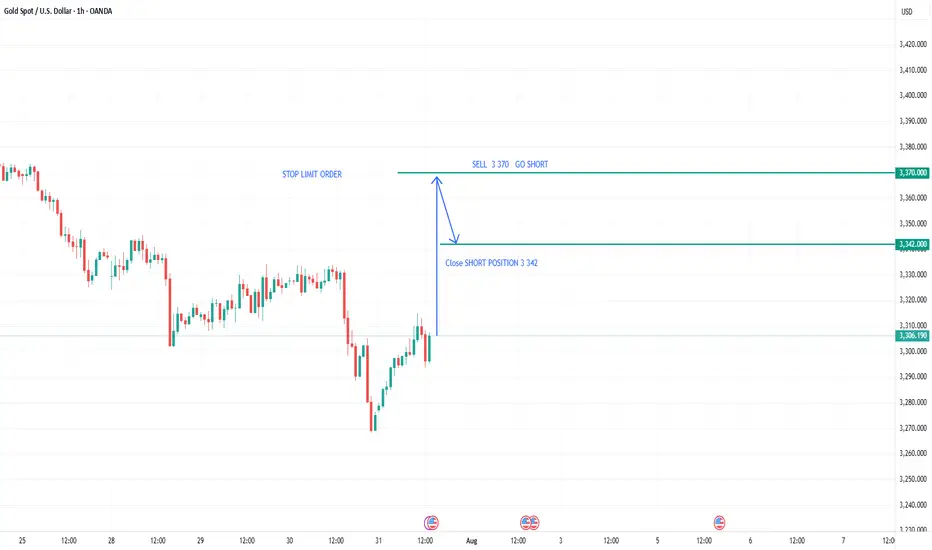
Potential bearish drop?The Gold (XAU/USD) has reacted off the pivot and could drop to the 1st support.
Pivot: 3,306.31
1st Support: 3,239.07
1st Resistance: 3,357.09
Risk Warning:
Trading Forex and CFDs carries a high level of risk to your capital and you should only trade with money you can afford to lose. Trading Forex and CFDs may not be suitable for all investors, so please ensure that you fully understand the risks involved and seek independent advice if necessary.
Disclaimer:
The above opinions given constitute general market commentary, and do not constitute the opinion or advice of IC Markets or any form of personal or investment advice.
Any opinions, news, research, analyses, prices, other information, or links to third-party sites contained on this website are provided on an "as-is" basis, are intended only to be informative, is not an advice nor a recommendation, nor research, or a record of our trading prices, or an offer of, or solicitation for a transaction in any financial instrument and thus should not be treated as such. The information provided does not involve any specific investment objectives, financial situation and needs of any specific person who may receive it. Please be aware, that past performance is not a reliable indicator of future performance and/or results. Past Performance or Forward-looking scenarios based upon the reasonable beliefs of the third-party provider are not a guarantee of future performance. Actual results may differ materially from those anticipated in forward-looking or past performance statements. IC Markets makes no representation or warranty and assumes no liability as to the accuracy or completeness of the information provided, nor any loss arising from any investment based on a recommendation, forecast or any information supplied by any third-party.
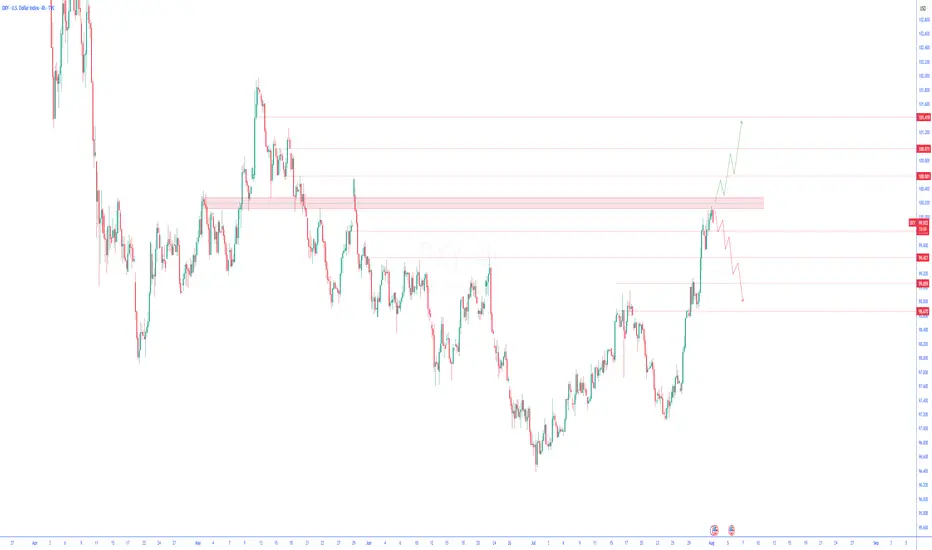
U.S. Dollar Index (DXY) Technical Analysis – 4-Hour TimeframeU.S. Dollar Index (DXY) Technical Analysis – 4-Hour Timeframe
Following yesterday’s economic data from the United States, which included stronger-than-expected GDP growth and consumer confidence figures, the U.S. Dollar Index (DXY) has continued its upward trend with strength. These developments have reinforced expectations for continued monetary tightening—or at least keeping interest rates elevated—which in turn has boosted demand for the dollar.
On the 4-hour chart, after a strong bullish rally, the dollar index has now reached a key resistance zone that previously acted as a major barrier.
Bullish Scenario:
If the current resistance zone is decisively broken and price stabilizes above it, the bullish momentum could extend further toward higher technical levels. This scenario would gain additional strength if upcoming economic data continues to support the dollar.
Bearish Scenario:
However, if the price fails to break through the resistance and signs of buyer weakness begin to emerge, a corrective pullback toward previous support levels may occur. This scenario could be further intensified if weaker economic data is released or if the Federal Reserve signals a more dovish stance.
At the moment, traders are advised to closely monitor the price reaction to the current zone and wait for confirmation before committing to the next move.
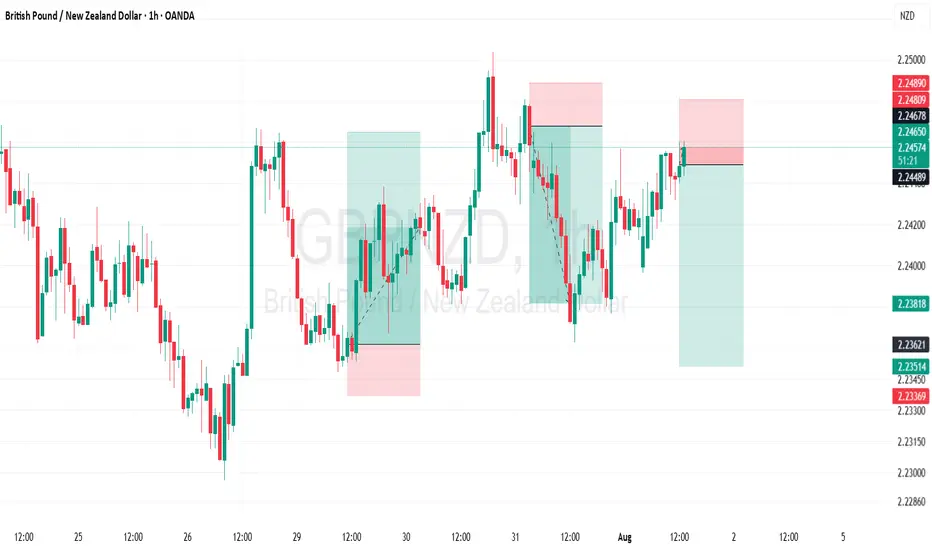
Short on GBPNZD i'm shorting GBP/NZD due to the liquidity zone below, which suggests a potential downside breakout. The pair is approaching a significant support level where previous buy orders are likely clustered. If price breaks through this zone, stop-loss orders could be triggered, accelerating downward momentum. Additionally, fundamental factors
60MIN trade Fibonacci extension trade. Return to Objective Point(1,00) after reaching Expanded Objective Point (1,618)
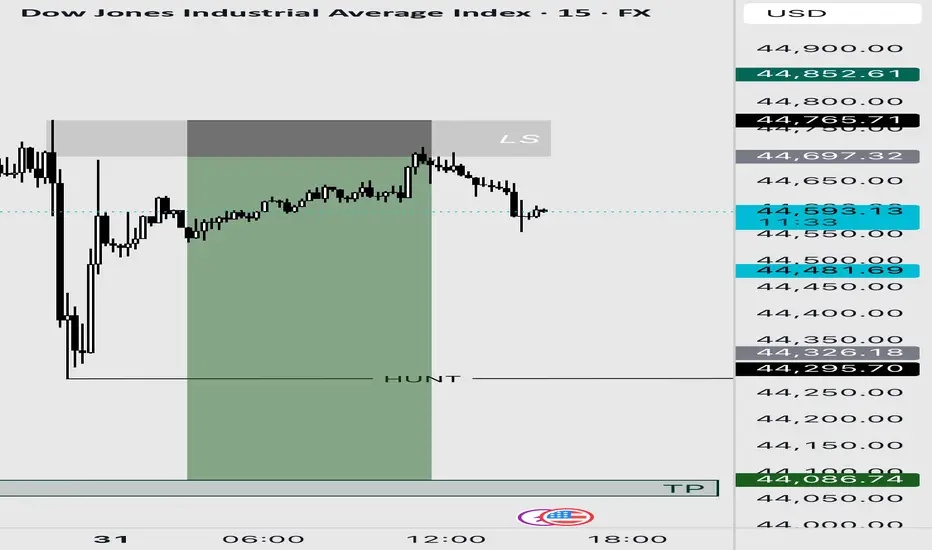
Us30usd sellI entered a sell trade from the LS zone. The PEZ zones were all used up. I set the last one as my TP.