Community ideas
ADA Monthly Buying Opportunity As per my analysis ADA is showing buying opportunity in monthly chart. I hope it will return max 50% of investment in coming months. Trend is bullish, Monthly volume is above the average volume, golden level support. Do your own research before taking any risk.

USDJPY I Technical and Fundamental Analysis Welcome back! Let me know your thoughts in the comments!
** USDJPY Analysis - Listen to video!
We recommend that you keep this on your watchlist and enter when the entry criteria of your strategy is met.
Please support this idea with a LIKE and COMMENT if you find it useful and Click "Follow" on our profile if you'd like these trade ideas delivered straight to your email in the future.
Thanks for your continued support!

Very Bullish!!
Solana chart looks very bullish. The price is currently dropping but I think it is a very healthy correction.
Weekly chart:
1) all momentum indicators just entered the bull zone.
2) The chart is forming higher highs.
Daily:
1) EMA55 finally crossed EMA200. The last time they crossed was October 2023 (see red vertical line in the chart) and it was the beginning of the macro bull trend.
2) Momentum indicators have reached overbought territory and crossed to the downside, however, given weekly momentum indicators have just entered the bull zone, this move is likely to be corrective action.
3) When EMA55 and EMA200 cross, the price often retraces initially to EMAs (21, 55 or 200). Once it completes the pull back, I anticipate the price to move to the previous ATH and beyond.
This is the time when high leverage trading volume increases.
Be careful not get wicked out. Focus on monthly/weekly/daily charts and ignore the noise in the lower timeframes.
Xausd techinical analysis.Xausd techinical analysis next move posibale at h1 time frame not finchinical advice.
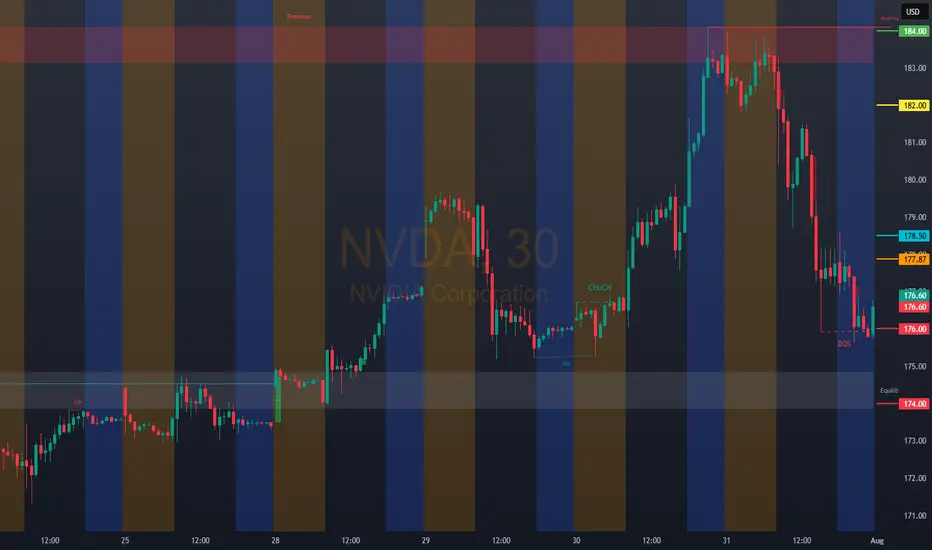
NVDA: 177.87Bullish Entries: 174.00/178.50 Stop 177.00 Target 182.00–184.00
Bearish Entries: 178.50/176.00 Stop 177.00 Target 172.00................Note if you find it somewhat confusing, here is the clarification 178.50 possible bullish reach zone wait for confirmation. 174.00 possible rebound zone or rejection of the bearish entry wait for confirmation for the bearish entry.
$SPY Analysis, Key Levels & Targets
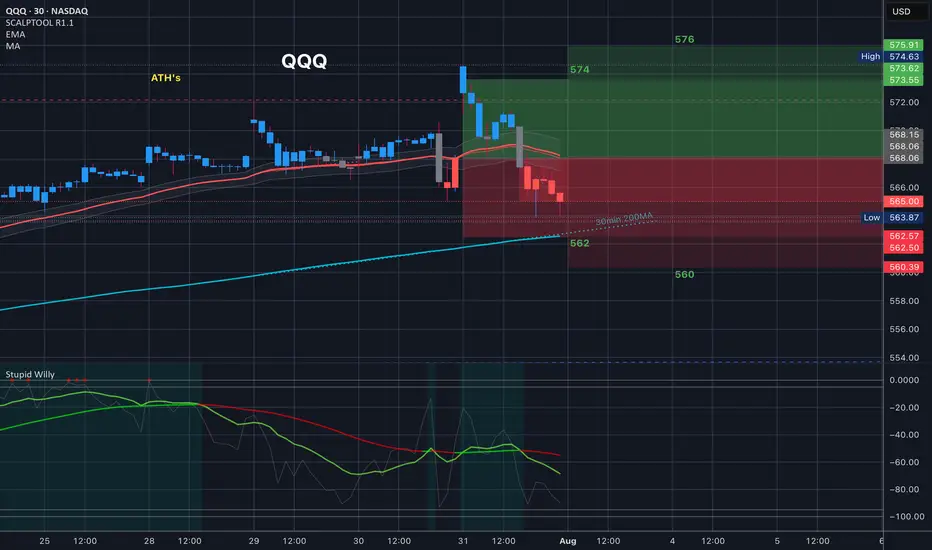
This is how last night’s members chart played out and it was amazing. We opened at the top of the trading range and all of the spreads at the top paid as we dropped back to the 30in 200MA
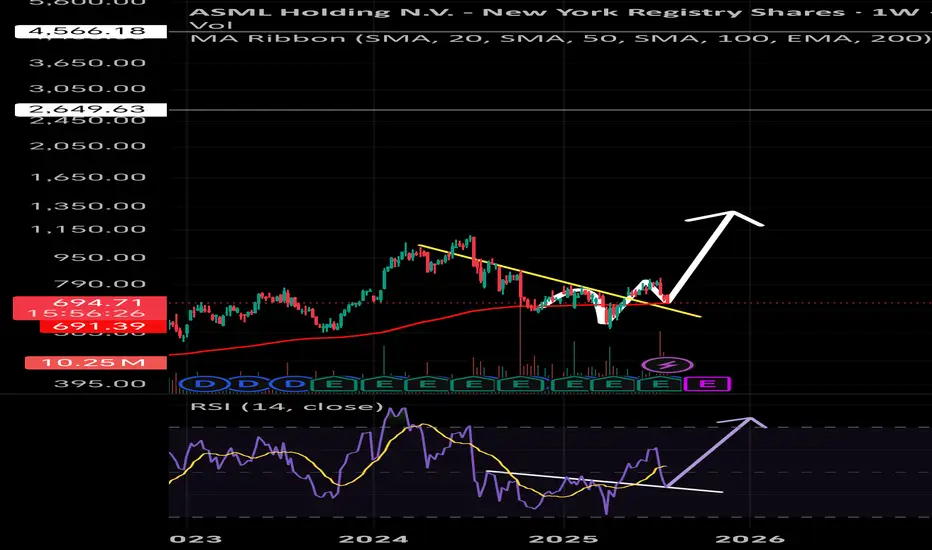
ASML : All inASML currently retesting the 200 weekly EMA support trendline.
Expecting ,Bullish trend reversal structure,
Ladt night already positioned heavily in this stock,
Pray this will play out as planned
😬🙏🙏😬
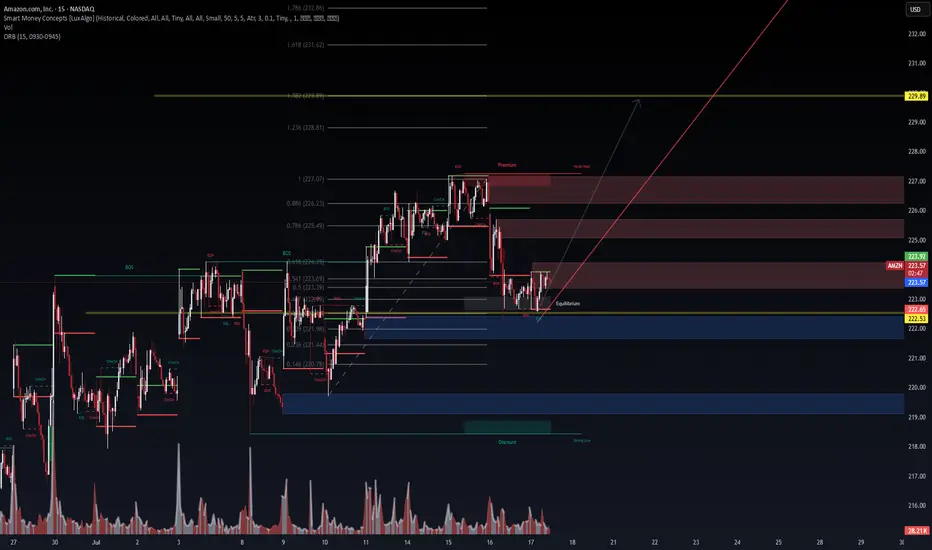
AMZN 15m – Institutional Demand Reclaim in Progress | VolanX Pro📈 AMZN 15m – Institutional Demand Reclaim in Progress | VolanX Protocol Alert
Amazon (AMZN) is staging a potential bullish reversal from a deep discount zone following a strong rejection near the 0.146–0.236 Fibonacci confluence at ~$220.78–221.44. We are now consolidating near the equilibrium zone (223) with signs of early accumulation.
📊 Technical Thesis:
Break of Structure (BOS) at 223.92 sets short-term bullish intent.
Reclaiming the ORB high and equilibrium.
Price rejected from deep demand (blue zone) and now printing EQH + BOS microstructures.
Premium liquidity sits above 227–229, with a magnet at FIB extension 1.618–1.786 = 231.62–232.86.
Volume profile shows declining sell pressure post-demand sweep.
📌 Key Levels:
Support: 222.53 | 221.44 | 220.78 (deep value zone)
Resistance: 226.23 (0.886 FIB) → 229.89 (FIB target zone)
Smart Money Premium: 226.5–229.8
🧠 VolanX Protocol Bias:
This is a long-biased setup, favoring institutional reaccumulation. If AMZN maintains above 223 with volume absorption, we anticipate a liquidity sweep through the premium zone, targeting 229.89.
🎯 Probabilistic Targeting:
60% → Retest 226.23 (EQH magnet zone)
30% → Breakout and reach 229.89 (measured move)
10% → Breakdown below 222.53 invalidates the setup
⚠️ Risk Note (VolanX Standard):
This post reflects strategic technical modeling, not financial advice. Trade your own system. View this as a signal integrity alignment, not a directive.
$QQQ Analysis, Key Levels & Targets574/576 Bear call spreads at open? Yes please. You know that those filled for 1.00 risk/1.00 reward - it was glorious.
Closed up 100%
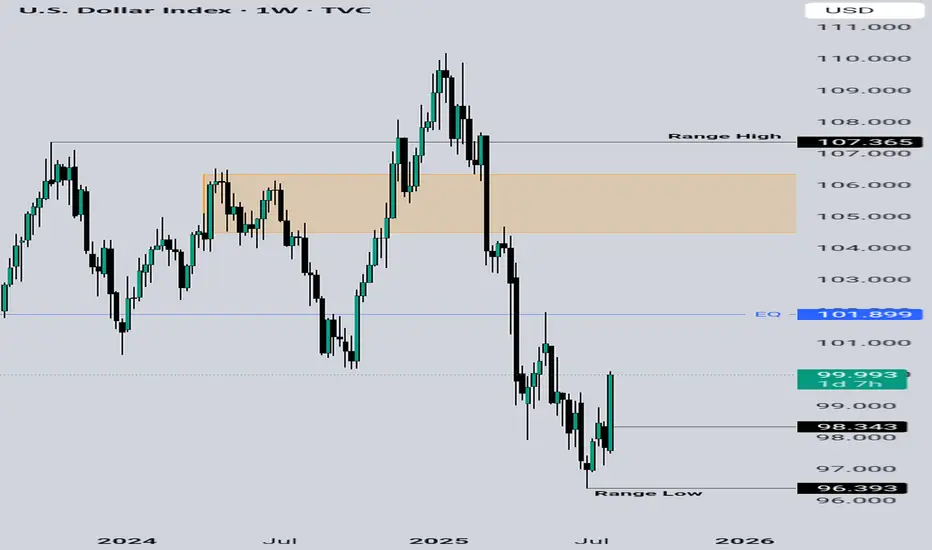
Bullish on The US Dollar Currently short term bullish on the dollar until it gets to the orange box. A retracement lower to accelerate the move higher is permitted. Let's see how this unfolds in the coming weeks
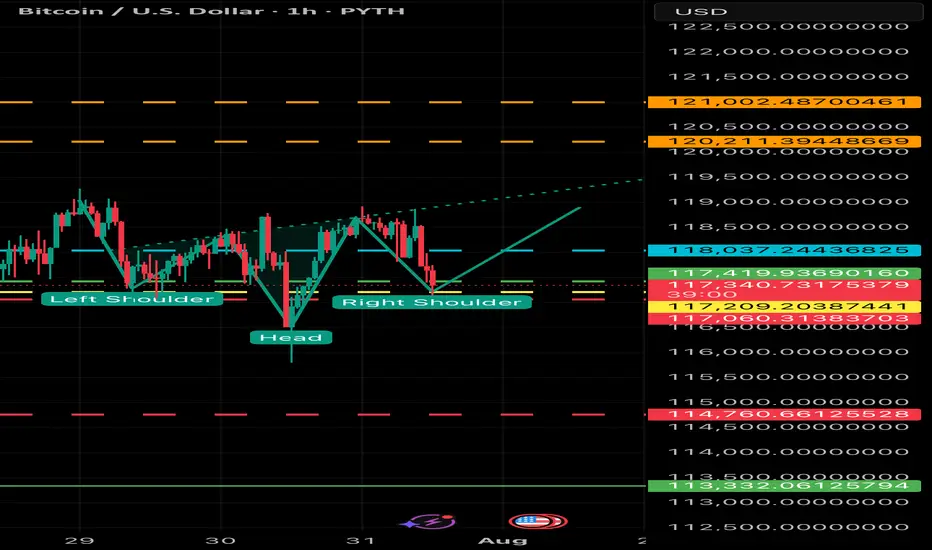
BULLISH BTC - Potential Inverted head and shoulders forming Potential breakout to $119 to $124,000 - Look for volume and support at $116 to $117,000. Breakout above $118,500 will confirm formation.
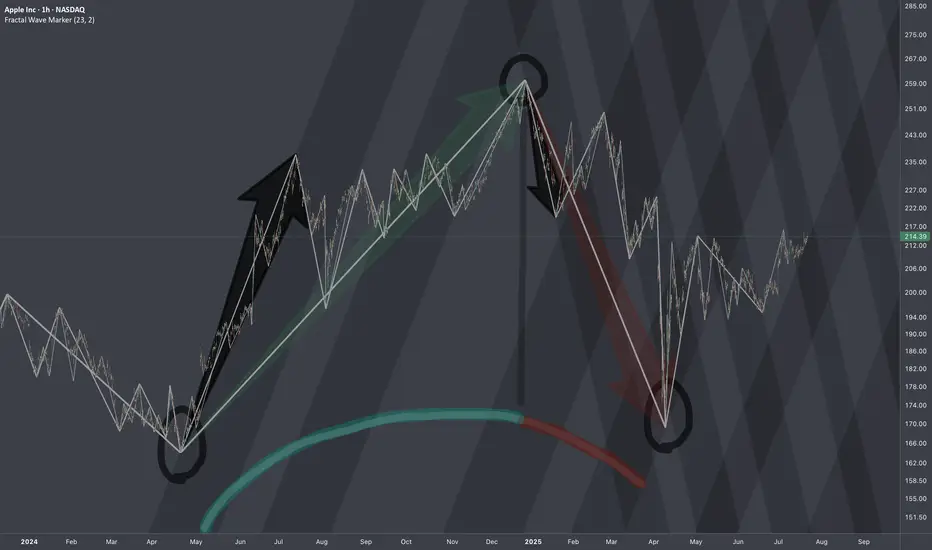
$AAPL: Structure SurgeryResearch Notes
Original Structure:
Altering structure for experimental purposes
Angle of fib channels that rises from cycle low, has been pushed into the past to the top of first major reaction. blue area resembles the change
Reason
The the angle of Fibonacci channels which cover the general decline (from perspective of ATH to end of cycle), are adjusted to the angle of the first bear wave of smaller scale.
Therefore, when it comes to measurements of opposing forces for working out interference pattern, having this symmetric approach of mapping interconnections is fair.
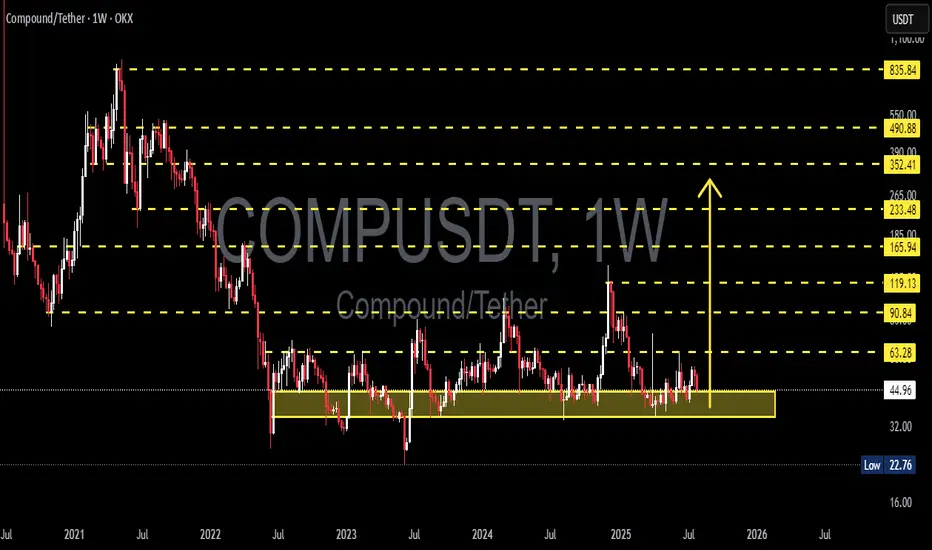
COMPUSDT in a Strong Demand Zone! Reversal Potential / Breakdown🔍 In-Depth Analysis (Timeframe: Weekly / 1W)
The COMP/USDT pair is currently hovering above a long-term demand zone that has held strong since mid-2022. Price is sitting around $44.90, just above the key support area of $32 – $45 (highlighted in yellow), which has acted as a major accumulation zone for over 2 years.
🧱 Critical Zone: Smart Money Accumulation or Exhaustion?
The $32–$45 demand zone has been tested multiple times, indicating smart money interest and hidden buying pressure.
Price action in this range forms a clear base structure or horizontal accumulation pattern, a classic setup before a large directional move.
However, the prolonged sideways consolidation hints at an imminent breakout or breakdown — momentum is building.
---
📊 Key Technical Pattern:
🟨 Rectangle Range (Accumulation Structure)
Price has been ranging between $32 and $63.28 with no clear breakout.
Strong rejections every time price dips below $35 indicate consistent buyer defense.
🔃 Mean Reversion Behavior
Repeated moves back to the mid-range reflect an indecisive market (equilibrium phase), often seen before expansion.
---
📈 Bullish Scenario (Potential Reversal):
If price breaks above major resistance at $63.28:
1. Upside Targets:
🎯 $90.84 (key resistance zone)
🎯 $119.13 (prior distribution zone)
🎯 $165.94 (macro target if sentiment turns highly bullish)
2. Confirmation needed via weekly close above $63 with strong volume.
3. A bullish breakout may form a new Higher Low and Higher High structure on both daily and weekly timeframes.
🟢 Bullish confirmation: Weekly bullish engulfing + volume breakout above $63.
---
📉 Bearish Scenario (Potential Breakdown):
If price closes below the $32 support:
1. Possible downside targets:
⚠️ $22.76 (next logical support)
🚨 $16 (last consolidation base pre-2021 rally)
2. A break below this long-term support could trigger a final capitulation flush before a potential macro reversal.
🔴 Bearish confirmation: Weekly close below $32 with increased volume and sustained selling.
---
⚖️ Strategic Takeaway:
COMP/USDT is currently at a pivotal decision zone — a crossroads between massive upside potential and deeper downside risk.
This is not just another support area, it’s a macro-level demand zone that will likely dictate trend direction in the coming months.
⏳ A major move is brewing — whether breakout or breakdown, be ready.
#COMPUSDT #CryptoOutlook #TechnicalAnalysis #AltcoinSeason #DeFi #CryptoTrading #AccumulationZone #BreakoutSetup #BearishScenario #BullishSetup #CryptoAnalysis
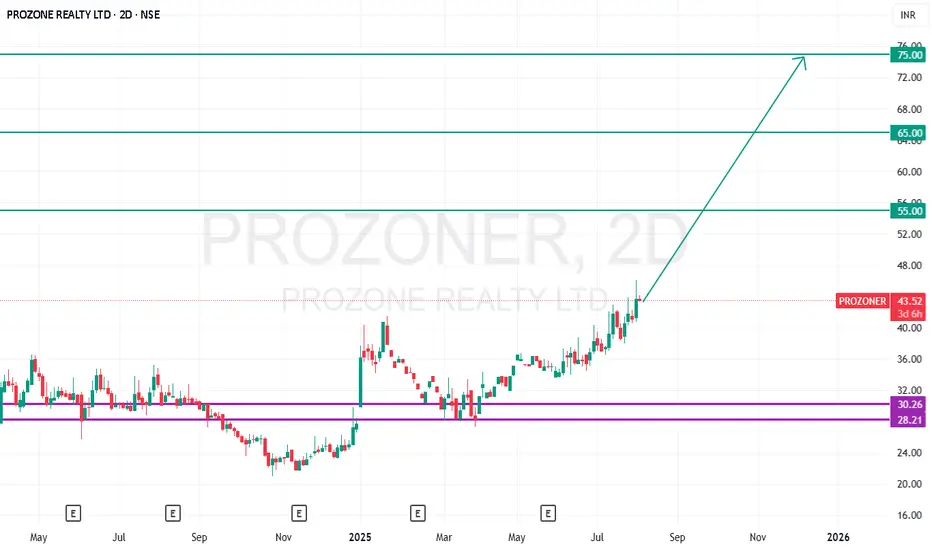
Prozone Realty - Long*Prozone - CMP - 43.40 / Positional Trade*
*Buy Range 41 to 44 ONLY / Stop Loss 36 in weekly candle closing*
*Target 1 - 55*
*Target 2 - 65*
*Target 3 - 75+*
Disclaimer: This is my view and for educational purpose only.
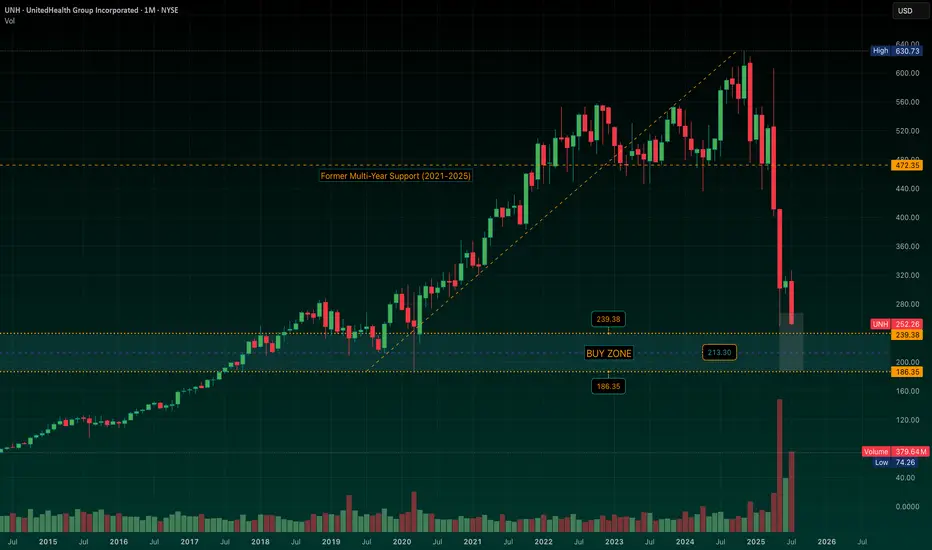
UNH: Mapping Out a Defined-Risk LEAPS Strategy in the "Buy Zone"UNH is approaching a broad structural support region I’ve been tracking -- a wide zone from $239 down to $186, where (for me) the stock begins to offer compelling risk/reward and long-term value. Momentum, IMO, is still decisively lower, but we’re nearing levels where I start preparing.
The midpoint of the “Buy Zone” near $213 reflects a potential average cost area I’d be very comfortable building from, depending on how price behaves as it enters the zone.
I’ll look to initiate exposure through long-dated call options (LEAPS) -- as I’ve started doing in NYSE:CNC -- once the setup begins to stabilize. From there, I’ll begin layering in short puts at ownership levels that align with the broader structure. If assigned, I’ll own where I intended. If not, I’m collecting premium to help finance the LEAPS.
I’m not in the business of calling exact bottoms… this is about building a position that respects time, structure, and flexibility -- anticipating a slow grind higher over the next 12–18 months. Stay tuned.
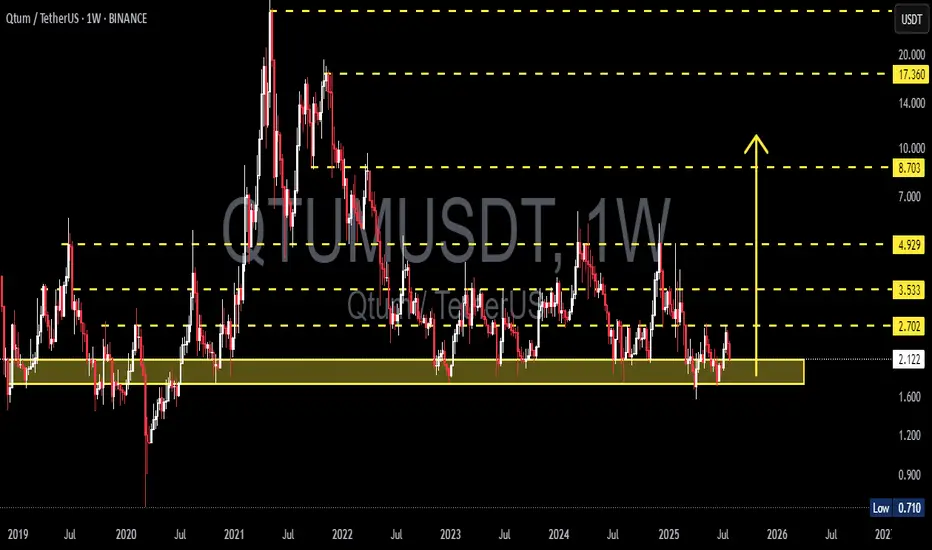
QTUM/USDT – Make or Break? Testing the Edge of Accumulation?🧠 Overview:
After going through a volatile multi-year cycle, QTUM is now back at one of the most critical historical support zones. This demand area has acted as a strong reversal point multiple times since 2020 and is once again being tested as price consolidates near the bottom of its macro range.
---
📉 Price Structure & Key Levels:
📍 Major Support Zone (1.70 – 2.10 USDT):
A proven accumulation zone based on multiple long wicks and price rejections in the past.
This is where smart money tends to accumulate during market uncertainty.
📍 Layered Resistance Levels (Bullish Targets):
2.70 USDT → Initial breakout validation
3.53 USDT → Mid-range resistance
4.93 USDT → Key structural level
8.70 USDT → Mid-term breakout target
17.36 USDT → Peak from previous macro cycle
---
🧩 Current Pattern: "Sideways Accumulation Range"
QTUM is clearly in a range-bound accumulation phase, with tight price action within a key support area. Historically, such patterns often precede large impulsive moves, especially when accompanied by volume surges and breakouts from structure.
> ⚠️ Important Note: Sideways movement at historical support, combined with increasing accumulation volume, often leads to a breakout into the markup phase.
---
📈 Bullish Scenario: Potential Upside Momentum
Trigger: A confirmed breakout and weekly candle close above 2.70 USDT.
Additional Confirmation: Strong bullish candle with increased volume.
Targets:
3.53 USDT (local resistance)
4.93 USDT (mid-range structural level)
8.70 USDT (swing target)
17.36 USDT (macro cycle high)
🎯 High reward-to-risk potential if entries are made near support with a stop-loss under 1.70 USDT.
---
📉 Bearish Scenario: Breakdown Risk
Trigger: Weekly candle closes below 1.70 USDT.
Implication: Breakdown from long-term demand zone.
Downside Targets:
1.20 USDT → Minor horizontal support
0.71 USDT → Historical all-time low
Warning Sign: High volume breakdown = likely sign of institutional selloff or panic exit.
---
📊 Strategic Summary:
> QTUM is at a pivotal crossroads.
The 1.70 – 2.10 USDT range is a decisive area.
A bullish breakout could spark a major recovery rally,
while a breakdown may lead to a deeper capitulation.
This is a “calm before the storm” situation. Traders should monitor closely as the next few weekly candles could define the trend for the rest of 2025.
#QTUMUSDT #QTUM #CryptoAnalysis #AltcoinSetup #TechnicalAnalysis #AccumulationPhase #SupportAndResistance #BreakoutPlay #CryptoBreakout
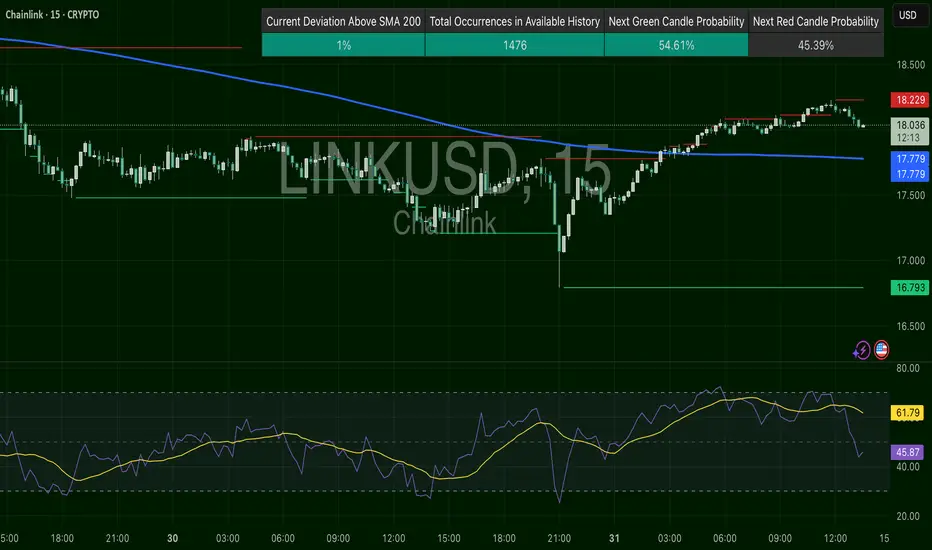
LINKUSD – Finally Flipped the TrendLINK surged after reclaiming $17.78 and breaking through the 200 SMA for the first time in days. RSI hit >63 and now rolling. If $18.05 holds as support, bulls may push toward $18.22 and higher. Weakness below $17.78 would fade the setup.
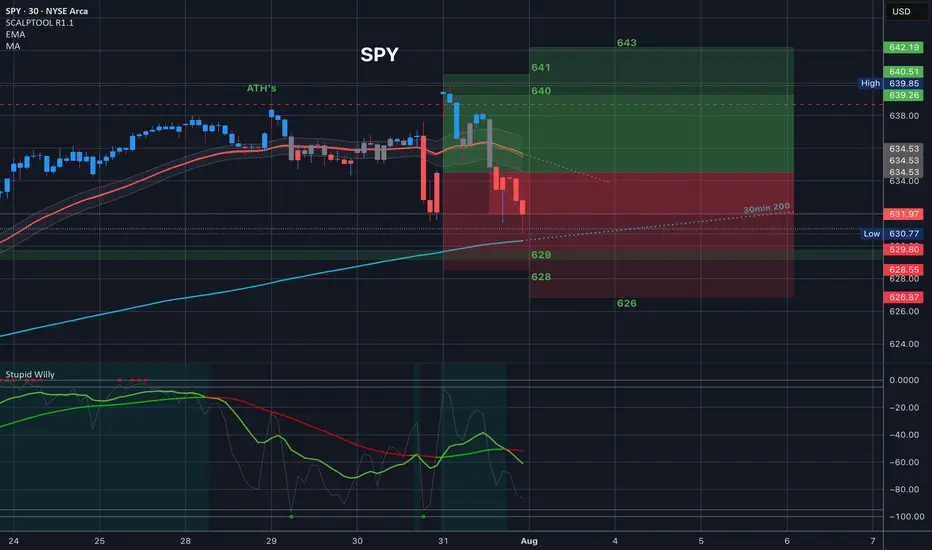
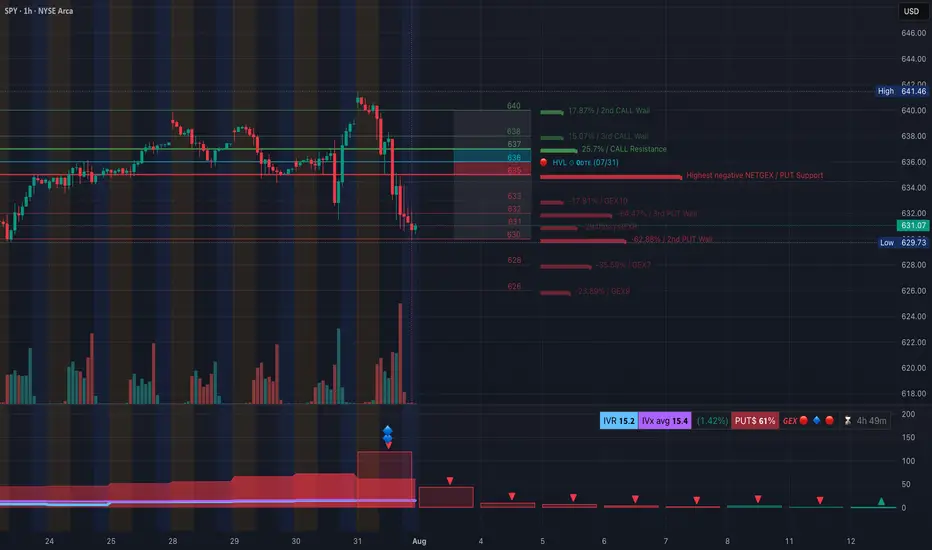
SPY Slips into Deep Negative Gamma — Aug. 1SPY Slips into Deep Negative Gamma — $629.73 Pivot Under Siege
🔍 GEX & Options Flow Insight (1st Image Analysis)
SPY has rolled over sharply from the $641 highs, slicing through multiple support zones and now probing the $629–$631 gamma pivot. The GEX structure is decisively negative, signaling elevated downside risk if this key level fails.
* Call Walls & Resistance:
* 📍 $636.39 → 1st resistance (Call resistance zone)
* 📍 $639.48–$640.28 → 2nd Call Wall cluster
* 📍 $641.46 → Highest call wall / gamma resistance
* Put Walls & Support Zones:
* 🛡️ $631.07 → Current key gamma pivot
* 🚨 $629.73 → Highest negative NET GEX / critical floor
* 📉 Break below $629 risks a flush to $626–$622
* Volatility Insight:
* IVR 15.2, IVx Avg 15.4 → Low realized volatility despite price slide
* Put flow 61% → Heavily bearish
* GEX sentiment: 🔴🔴🔴 = Strong negative gamma — market likely to see amplified moves in current direction
✅ Option Trading Suggestion:
Bias: Bearish unless reclaiming $636+
Strategy: Bear put spread or put fly
* Entry Idea: Buy 630P / Sell 625P (Aug 2 or Aug 9 expiry)
* Invalidation: Close above $636
* Target: $626 → $622
Why this works: SPY is pinned near a major negative gamma inflection. Below $629.73, dealer hedging could accelerate selling pressure toward $622.
🧠 Technical Analysis (1H Chart) (2nd Image Analysis)
Market Structure & SMC:
* 🟥 CHoCH confirmed after rejection at $641
* ❌ Broke short-term BOS levels in the $637–$636 zone
* Currently trading in a downward-sloping structure with multiple failed bounces
Trendline Dynamics:
* Clean descending channel from July 30 highs
* Lower bound projection points to $626–$622 support
SMC Zones:
* 🟩 Demand Zone: $629–$626 → Short-term bounce risk here
* 🟥 Supply Zone (Purple Box): $636–$639 → Heavy overhead resistance
🔄 Price Action & Key Levels
* Support:
* ✅ $631.07 → Current gamma pivot
* 🚨 $629.73 → Key breakdown trigger
* 📉 $626 → Lower demand
* 📉 $622 → Deeper downside target
* Resistance:
* 🚩 $636.39 → First reclaim level for relief
* 🚩 $639.48 → Mid supply
* 🚩 $641.46 → Full reversal point
🧭 Scalping / Intraday Trade Setup
🟥 Bearish Setup (Preferred):
* Entry: Breakdown under $629.73
* Target 1: $626
* Target 2: $622
* Stop: Above $632
🟩 Bullish Reversal Setup:
* Entry: Reclaim of $636.39 with strong volume
* Target 1: $639.48
* Target 2: $641.46
* Stop: Below $634
🔁 Summary Thoughts
* SPY is in a clean downtrend inside a negative gamma regime.
* $629.73 is the critical make-or-break line — holding it could trigger a small bounce, breaking it could unleash another wave of selling toward $622.
* Options flow is heavily bearish, aligning with technical weakness.
🚨 Disclaimer:
This analysis is for educational purposes only and does not constitute financial advice. Always do your own research and manage your risk accordingly.
$90 in next 6-12 months?I am buying this dip and expected it to hit 90 in 6-12 months based on tech analysis. All the best. Not a financial advise.

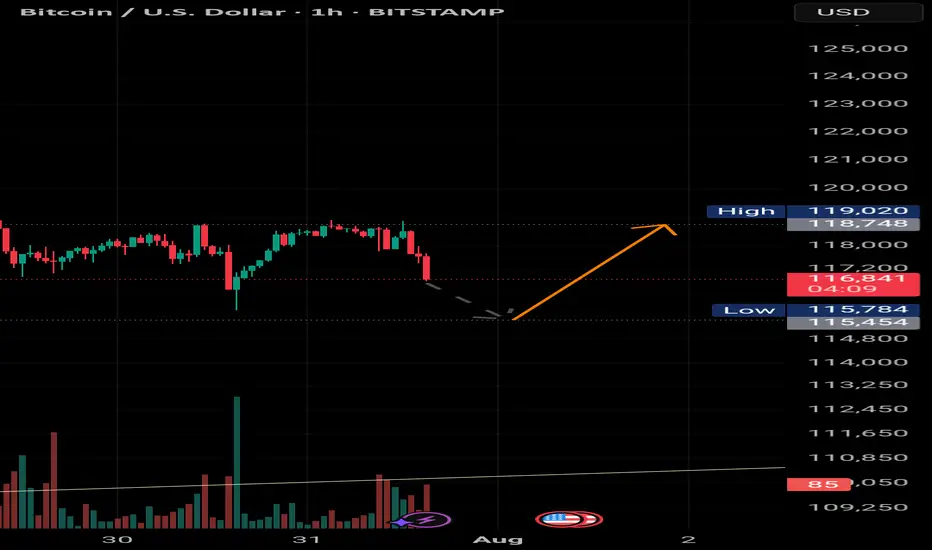
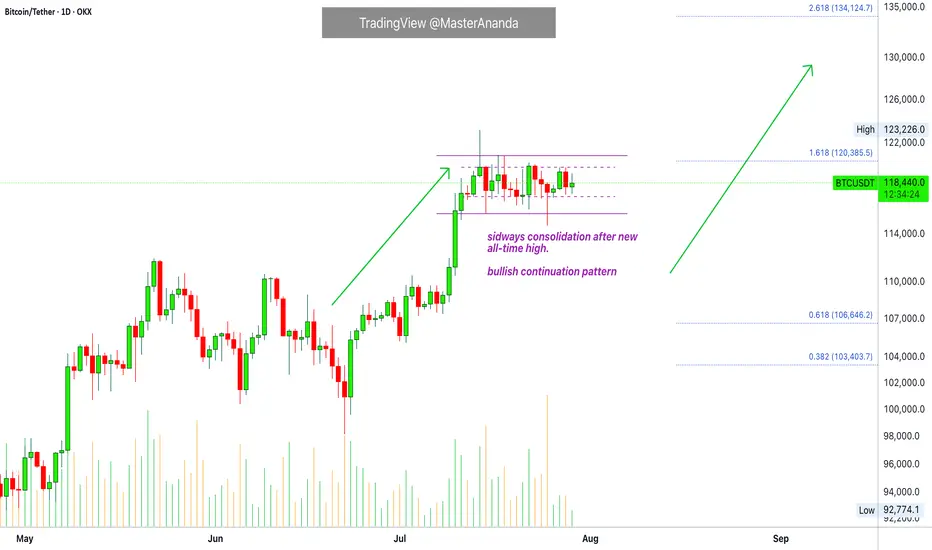
Bitcoin & The Altcoins —Name Your AltcoinBitcoin is sideways right now and is moving in a very tight and narrow range. All the action has been happening between $117,000 and $120,000 based on candle close since 11-July. This is bullish, think about it.
Bitcoin hits a new all-time high and next thing you know it turns sideways very close to resistance. The only drop was short-lived and everything sold was quickly bought. Why is Bitcoin consolidating so close to resistance? It is preparing to move ahead.
What happens when Bitcoin moves forward after so much recovery? Everything experiences a positive cycle. This is a very strong signal.
This chart allows for more whipsaw as you know nothing else is possible in a trading range. We predict the pattern to resolve bullish, but there can be swings to either side. A swing down just as it happened 25-July. A swing up just as it happened 14-July. This is always possible but the end result won't change. Bitcoin will continue sideways but when the sideways period is over, you will not see a move toward $110,000 or $100,000. The break of the trading range will confirm the advance toward $135,000 next month. Bitcoin is likely to continue in the same mode. While Bitcoin consolidates the new advance, the altcoins grow. In this way the entire market continues to recover and grow month after month after month.
Name Your Altcoin
Leave a comment with your favorite altcoin trading pair and I will do an analysis for you. I will reply in the comments section. Make sure to include any questions you might have beforehand.
If you see a comment with a pair you like, boost and reply so these can be done first.
Thanks a lot for your continued support.
Namaste.
PENGU 8H – 297% MACD Strategy Long Call BreakdownPENGU’s recent move is the kind of textbook trend trade that makes systems like the MACD Liquidity Tracker shine.
The strategy stayed flat throughout the entire sideways grind in June — filtering out chop with its 60/220 EMA trend filter. It wasn’t until late June that MACD flipped bullish and price reclaimed both EMAs. That was the trigger — and from there, it was lift-off.
The system held through a clean +297.95% move from sub-$0.012 to just under $0.045. No early exits. No fakeouts. Just a single, conviction-based trade.
The exit signal hit near the top as momentum waned and MACD rolled over. Since then, price has retraced and is now hovering right above the 60 EMA — a level that's acted as dynamic support all run long.
📊 Strategy Overview:
– MACD Settings: 25 / 60 / 220
– EMA Trend Filter: 60 & 220
– Mode: Normal
– Timeframe: 8H
⚠️ If price holds above the EMA and MACD stabilizes, bulls may still have fuel. But a breakdown below ~$0.029 would shift structure back into bearish territory.
Let the chart tell the story — this was pure momentum trading in action.

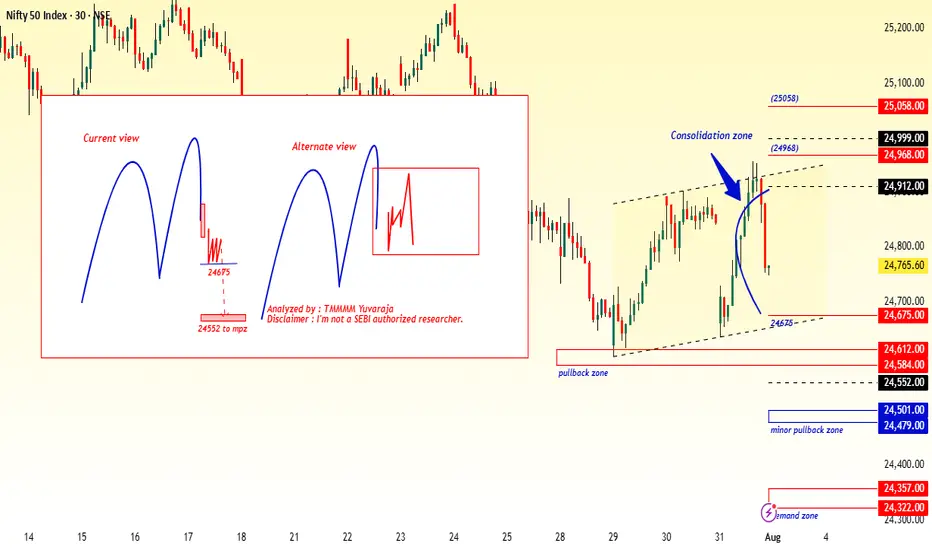
#Nifty directions and levels for August 1st:Good morning, friends! 🌞
Here are the market directions and levels for August 1st:
The global market (based on the Dow Jones) has shown a moderately bearish sentiment,
while the local market continues to display a bearish tone.
Today, Gift Nifty indicates a neutral opening.
What can we expect today?
In the previous session, both Nifty and Bank Nifty experienced high volatility.
However, the closing happened around the middle of the current swing, indicating a possible range-bound market. Until this range is broken, we cannot expect a strong directional move.
If the range breaks, we can follow the breakout direction.
In my side, the structures of Nifty and Bank Nifty appear slightly different. Nifty continues to show bearish sentiment, whereas Bank Nifty is showing signs of a mild bounce back. So, they may counterbalance each other, and if that happens, we may see a neutral closing by the end of the day.
On the other hand, if the market breaks immediate support or resistance with a solid candle or after consolidation, we can expect a directional move in that breakout direction.