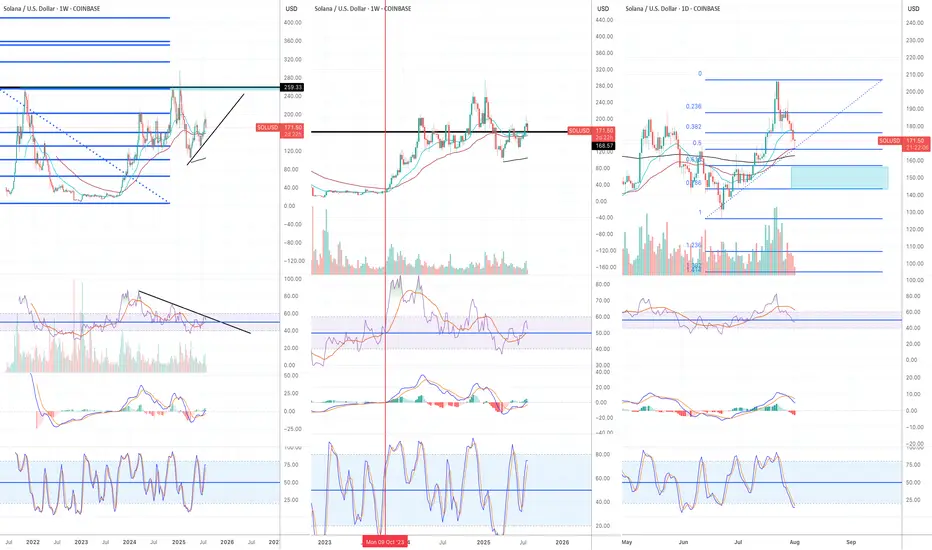
Still bullish in the higher time frames Solana has been struggling to break and stay above $170-200 zone this cycle.
It has been a very difficult asset to trade, however, I can see more bullish setups than bearish setups in higher timeframe charts.
Monthly:
1) July monthly candle closed above Fib 0.618 and formed higher high higher low.
2) RSI and MACD are still in the bull zone.
3) Stochastic are in the bear zone, but they are pointing to the upside.
Weekly:
1) EMA21 is still above EMA55.
2) The current weekly candle is forming bearing engulfing candle, however, there are two more days before it closes. It is still above EMA 21.
3) RSI orange line (RSI based moving average) is moving upwards and entering the bull zone.
4) MACD is about to enter the bull zone.
5) Stochastic hasn't reached overbought territory yet.
6) The set up of these three momentum indicators is very similar to the set up in Oct 23 before Solana started a massive bull trend. (see red vertical line)
Daily:
1) EMA21>EMA55>EMA200
2) As I said in the previous articles, EMA 55 and 200 don't cross easily. But when they do, the price often pulls back significantly before it starts to move in the direction of the trend.
3) Daily candle broke below EMA21, however, the price is reacting strongly to EMA55.
4) The price is still higher high higher low.
I will wait and see if the price is going to bounce off from $143 -157 region. (see blue rectangular block).
Community ideas
Sell AUDCHFButterfly pattern on display on the AUDCHF chart. This confirms a double top. On the M15 entry level timeframe, a bearish flag can be seen indicating strong bearish movement to come.

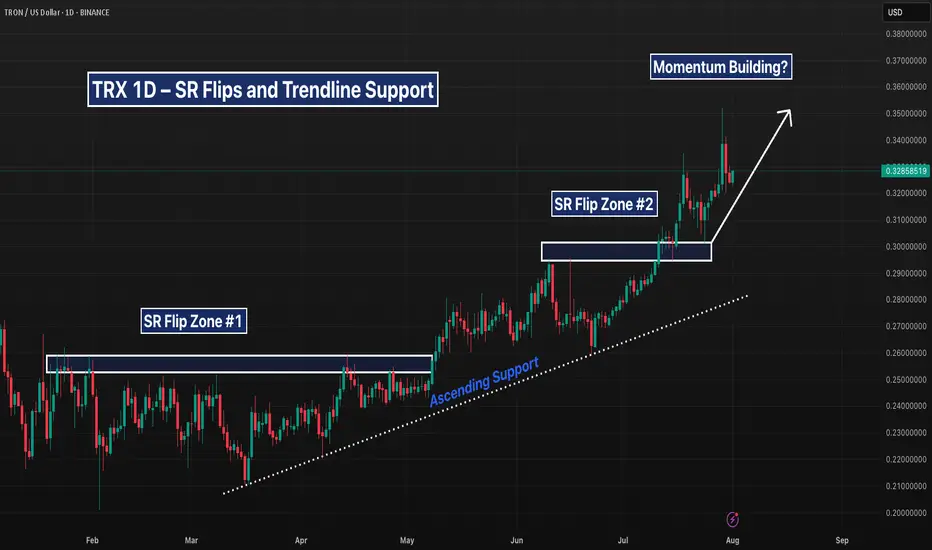
TRX 1D – SR Flips and Trendline Support Hold StrongTRX continues to respect trend structure — clean support retests, ascending trendline intact, and back-to-back SR flips fueling continuation.
With another higher low forming off the recent flip zone, bulls may be eyeing a move into the $0.35+ range. But watch closely — if price breaks below $0.30, structure could crack.
Trend still leans bullish… for now.
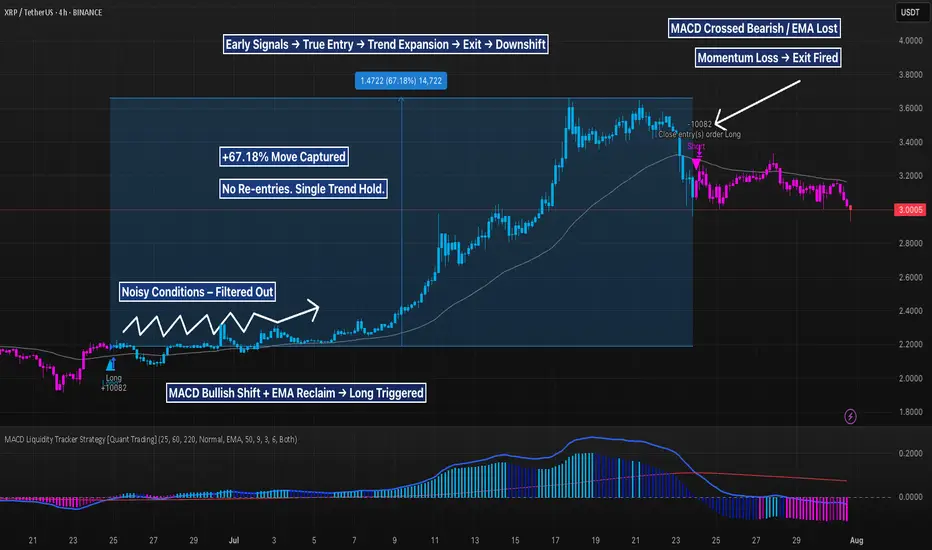
XRP 4H + 67% From MACD Trend Entry, But Is the Pullback Real?This XRP move was a masterclass in filtered momentum trading. The MACD Liquidity Tracker Strategy (Normal Mode) skipped early chop, then fired long once MACD aligned with a reclaim of the 60/220 EMAs — signaling a clean directional shift.
The strategy held through a +67.18% rally, exiting only when MACD flipped bearish and price lost EMA support. From ~$2.12 to ~$3.54, the move was captured in full with zero re-entries or second guessing.
Now price is under pressure, printing pink bars and sitting below both EMAs. The $2.90–$3.00 zone may determine if this is a healthy pullback — or the start of a reversal.
📊 MACD: 25 / 60 / 220
Trend Filter: 60/220 EMA
Mode: Normal | Timeframe: 4H
Educational chart. Drop your take.
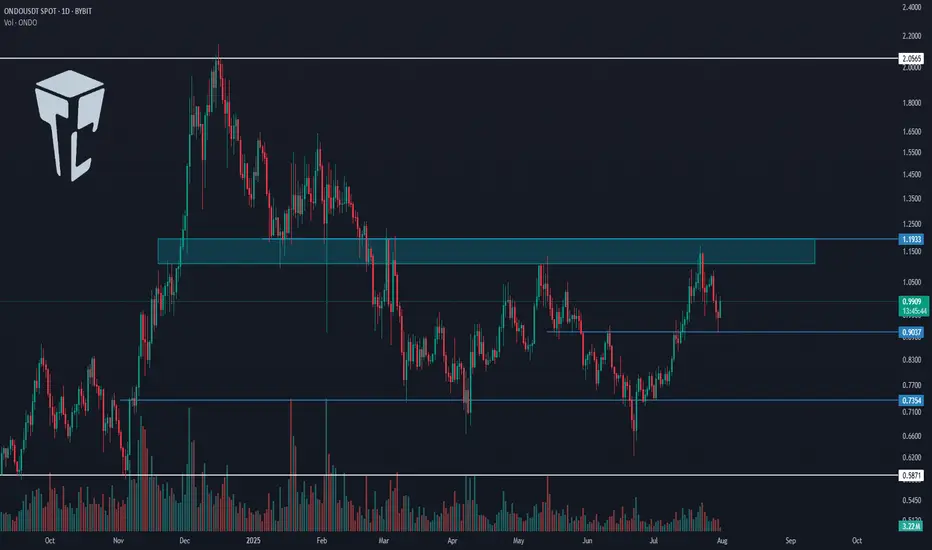
TradeCityPro | ONDO Builds Strength Beneath Key Supply Barrier👋 Welcome to TradeCity Pro!
In this analysis, I want to review the ONDO coin for you — one of the RWA projects, currently ranked 37th on CoinMarketCap with a market cap of $2.93 billion.
📅 Daily Timeframe
In the daily timeframe, as you can see, this coin has formed a range box between the levels of 0.7354 and 1.1933, and the price is currently sitting in the upper half of this box.
✔️ At the moment, the price is hovering around 0.9037, and it’s forming a higher low above 0.7354. If this low gets confirmed, the probability of breaking above 1.1933 increases.
⭐ The 1.1933 zone is a very significant supply level that was previously acting as support in late 2024, and after being broken, has since acted multiple times as resistance.
📊 If this area breaks, we can open a long position, or even buy this coin in spot. Personally, if this trigger is broken, I’ll open a long-term long position.
✨ The target for this position is 2.0565, and once the price reaches this level, we can take profits and consider a spot buy.
📝 Final Thoughts
This analysis reflects our opinions and is not financial advice.
Share your thoughts in the comments, and don’t forget to share this analysis with your friends! ❤️
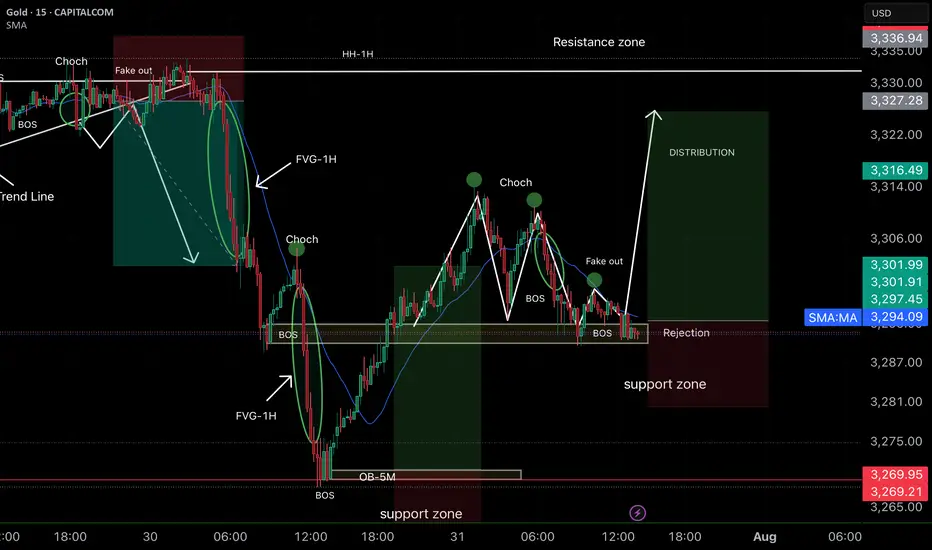
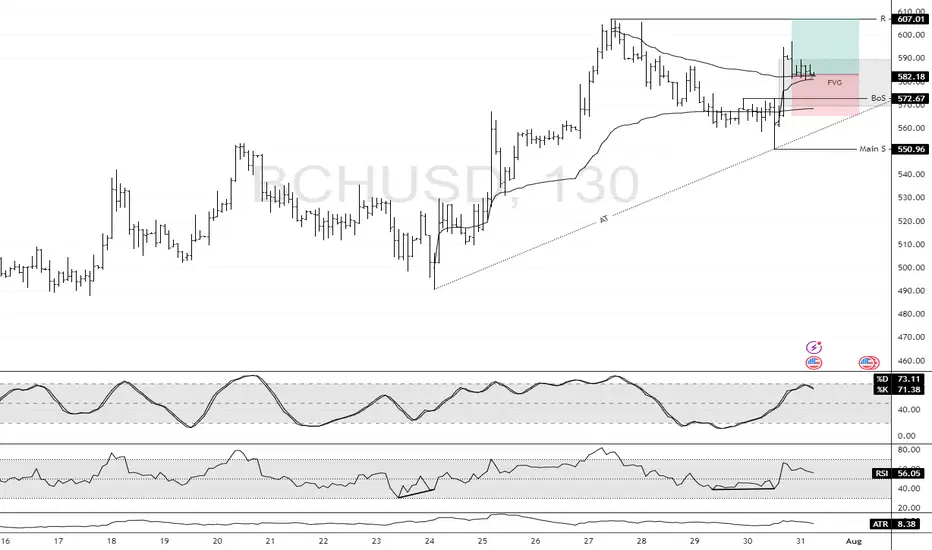
Smart Money Concepts (SMC) ✅ Analysis strengths:
• Correct identification of BOS (Break of Structure) and CHoCH, which indicate a change in direction.
• The support zone is marked and respected with rejection, reinforcing the probability of a rebound.
• The projection toward the distribution zone and HH of 1H is consistent, as there are inefficiencies (FVG) pending mitigation.
• The previous fake out clears liquidity and creates room for strong bullish momentum.
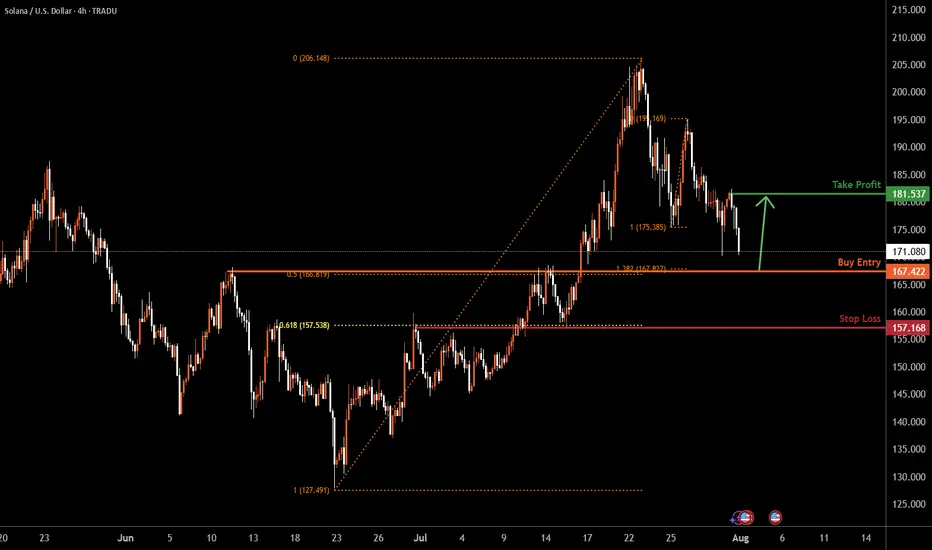
SOLUSD H4 | Bullish bounceBased on the H4 chart analysis, the price could fall to the buy entry, which acts as a pullback support that aligns with the 50% Fibonacci retracement and the 138.2% Fibonacci extension and could bounce to the upside.
Buy entry is at 167.42, which is a pullback support that aligns with the 50% Fibonacci retracement and the 138.2% Fibonacci extension.
Stop loss is at 157.16, which is an overlap support that aligns with the 61.8% Fibonacci retracement.
Take profit is at 181.53, which is a pullback resistance.
High Risk Investment Warning
Trading Forex/CFDs on margin carries a high level of risk and may not be suitable for all investors. Leverage can work against you.
Stratos Markets Limited (tradu.com ):
CFDs are complex instruments and come with a high risk of losing money rapidly due to leverage. 65% of retail investor accounts lose money when trading CFDs with this provider. You should consider whether you understand how CFDs work and whether you can afford to take the high risk of losing your money.
Stratos Europe Ltd (tradu.com ):
CFDs are complex instruments and come with a high risk of losing money rapidly due to leverage. 66% of retail investor accounts lose money when trading CFDs with this provider. You should consider whether you understand how CFDs work and whether you can afford to take the high risk of losing your money.
Stratos Global LLC (tradu.com ):
Losses can exceed deposits.
Please be advised that the information presented on TradingView is provided to Tradu (‘Company’, ‘we’) by a third-party provider (‘TFA Global Pte Ltd’). Please be reminded that you are solely responsible for the trading decisions on your account. There is a very high degree of risk involved in trading. Any information and/or content is intended entirely for research, educational and informational purposes only and does not constitute investment or consultation advice or investment strategy. The information is not tailored to the investment needs of any specific person and therefore does not involve a consideration of any of the investment objectives, financial situation or needs of any viewer that may receive it. Kindly also note that past performance is not a reliable indicator of future results. Actual results may differ materially from those anticipated in forward-looking or past performance statements. We assume no liability as to the accuracy or completeness of any of the information and/or content provided herein and the Company cannot be held responsible for any omission, mistake nor for any loss or damage including without limitation to any loss of profit which may arise from reliance on any information supplied by TFA Global Pte Ltd.
The speaker(s) is neither an employee, agent nor representative of Tradu and is therefore acting independently. The opinions given are their own, constitute general market commentary, and do not constitute the opinion or advice of Tradu or any form of personal or investment advice. Tradu neither endorses nor guarantees offerings of third-party speakers, nor is Tradu responsible for the content, veracity or opinions of third-party speakers, presenters or participants.
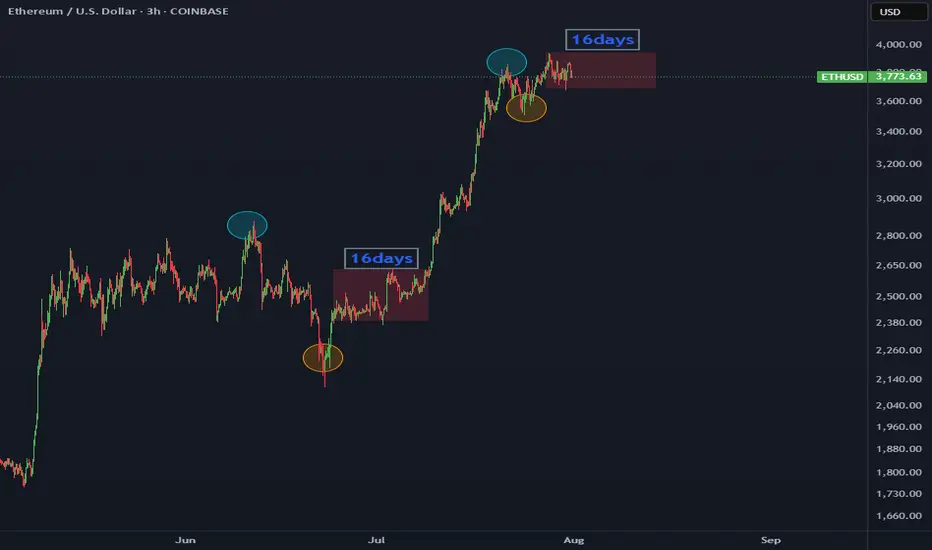
ETH will hit a new ATH in 16 days.ETH to reach new ATH in 16 days based on trend momentum and historical breakout patterns. Watching key resistance levels closely. High volume and bullish sentiment support the move.
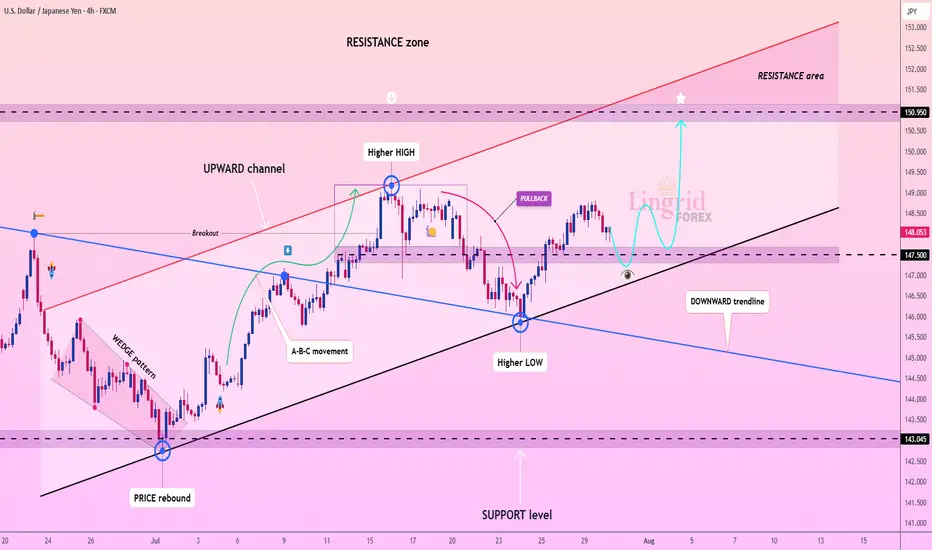
Lingrid | USDJPY Possible Strong Bullish RallyThe price perfectly fulfilled my previous idea . FX:USDJPY is trading within an upward channel after forming a higher low near the 147.50 zone, bouncing from the support trendline. Price action suggests a bullish structure continuation toward the 150.95 resistance, especially if the recent consolidation breaks higher. The overall formation aligns with a healthy correction phase before a potential push into the resistance area. Confirmation above 148.60 would likely accelerate the bullish move.
📌 Key Levels Buy zone: 147.50–147.25
Sell trigger: Below 147.00
Target: 150.95
Buy trigger: Break above 148.80
⚠️ Risks
Break below 147.50 may shift sentiment bearish
Strong resistance awaits near 150.00
Broader market volatility could invalidate pattern
If this idea resonates with you or you have your own opinion, traders, hit the comments. I’m excited to read your thoughts!
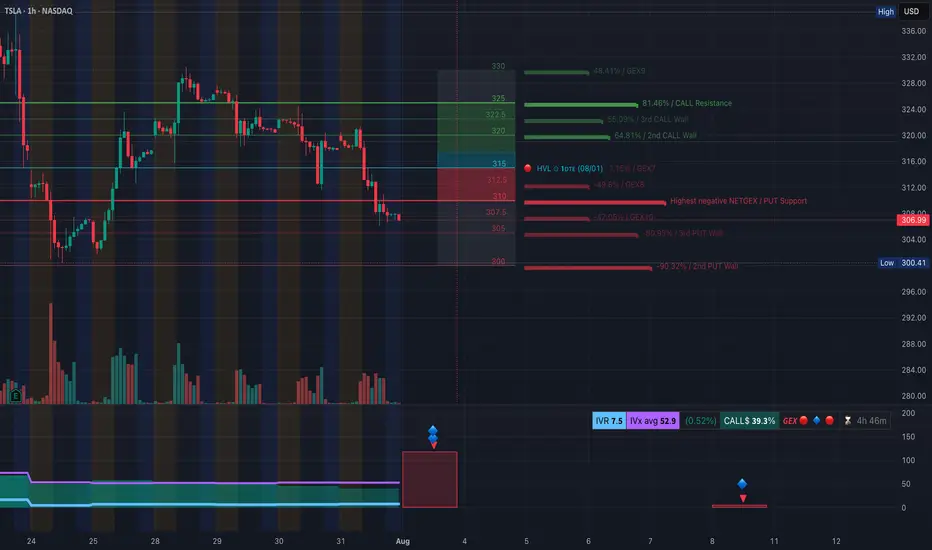
TSLA Downtrend Deepens — Key Gamma Floor at $300.41. August 1TSLA Downtrend Deepens — Key Gamma Floor at $300.41 Now in Sight
🔍 GEX & Options Flow Insight (1st Image Analysis)
TSLA continues to grind lower, breaking multiple gamma supports and staying pinned near the $306–$307 zone. The GEX profile shows a clear negative gamma environment, which means dealer hedging flows can intensify moves in either direction — but right now, momentum remains firmly bearish.
* Call Walls & Resistance:
* 📍 $321.36 → 2nd Call Wall (64.81% GEX2)
* 📍 $325.00 → Call wall resistance
* 📍 $330–$332 → Higher gamma resistance, unlikely in current structure without a strong reversal
* Put Walls & Support Zones:
* 🛡️ $306.99 → Current price zone, already tested multiple times
* 🚨 $300.41 → Highest negative NET GEX / hard gamma floor
* 📉 Below $300 → Opens quick downside to $295–$292
* Volatility Insight:
* IVR 7.5, IVx Avg 52.9 → Low relative IV in the context of a trending move down
* Call flow 39.3% → Bearish tilt despite modest call activity
* GEX sentiment: 🔴🔴🔴 = Strong negative gamma → price more sensitive to continued downside flows
✅ Option Trading Suggestion:
Bias: Bearish until a firm reclaim of $311–$315
Strategy: Bear put spread
* Entry Idea: Buy 305P / Sell 295P (Aug 2 or Aug 9 expiry)
* Invalidation: Strong hourly close above $315
* Target: $300 → $295
Why this works: Negative gamma positioning increases the likelihood of a push to $300. If $300 breaks, option dealer hedging can exacerbate selling.
🧠 Technical Analysis (1H Chart) (2nd Image Analysis)
Market Structure & SMC:
* 🟥 Multiple CHoCH events confirming breakdown structure
* ❌ Lost prior BOS levels near $321, then $315, and now hovering above $306
* Trading firmly inside a downward-sloping channel
Trendline Dynamics:
* Well-defined descending channel from recent highs
* Lower bound points toward $300–$295 in coming sessions
SMC Zones:
* 🟩 Demand Zone: $300–$295 → Last defense before deeper drop
* 🟥 Supply Zone (Purple Box): $319–$325 → Major resistance cluster
🔄 Price Action & Key Levels
* Support:
* ✅ $306.99 → Current defense
* 🚨 $300.41 → Critical gamma floor
* 📉 $295 → Lower channel target
* Resistance:
* 🚩 $311.64 → First reclaim needed for relief
* 🚩 $319–$321.36 → Key supply & call wall zone
🧭 Scalping / Intraday Trade Setup
🟥 Bearish Setup (Preferred):
* Entry: Breakdown below $306
* Target 1: $300.41
* Target 2: $295
* Stop: Above $311
🟩 Bullish Reversal Setup:
* Entry: Reclaim of $315 with volume
* Target 1: $321
* Target 2: $325
* Stop: Below $311
🔁 Summary Thoughts
* TSLA remains in a clear downtrend with a negative gamma backdrop.
* $300.41 is the key gamma floor — holding it may see a short-term bounce, breaking it risks a fast flush to $295.
* Until bulls reclaim $315, all rallies remain suspect.
🚨 Disclaimer:
This analysis is for educational purposes only and does not constitute financial advice. Always do your own research and manage your risk accordingly.
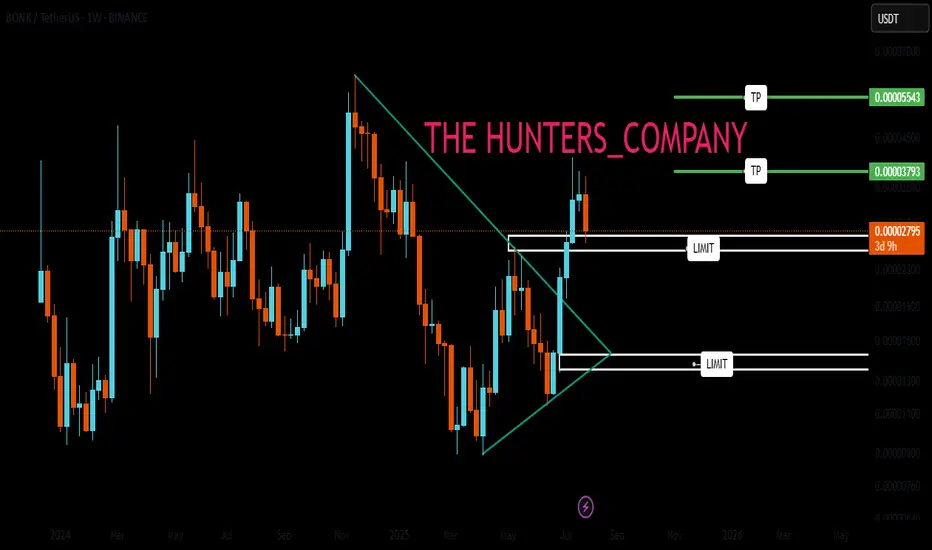
BONK : Best of luck to you...Hello friends🙌
👀Considering the decline we had, you can see that the price was supported by buyers and broke the specified resistance. Now, in the price correction, there is a good opportunity to buy with risk and capital management and in steps and be patient until the specified targets are reached.
🔥Follow us for more signals🔥
*Trade safely with us*
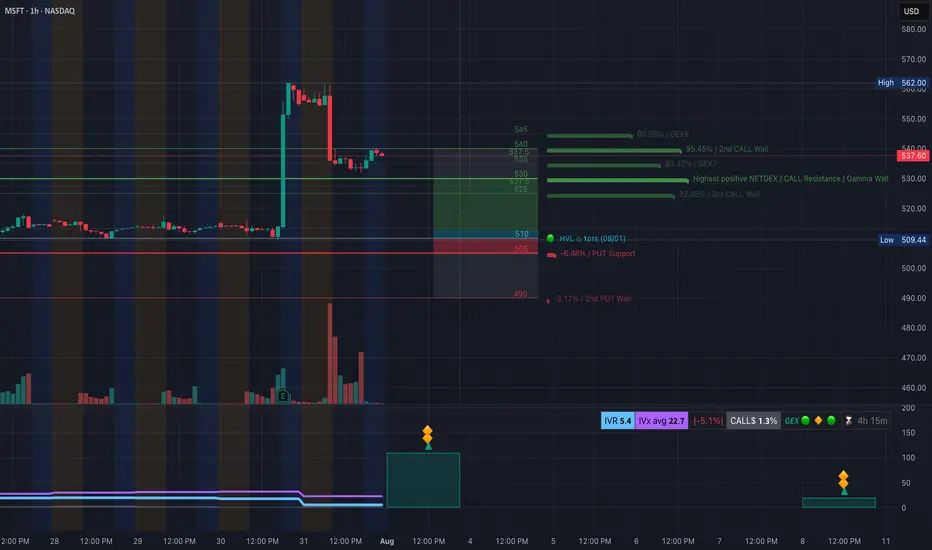
MSFT Post-Earnings Surge. 8/1MSFT Post-Earnings Surge — Consolidation Before Another Leg Up or First Sign of Exhaustion?
🔍 GEX & Options Flow Insight (1st Image Analysis)
Microsoft exploded higher after earnings, reaching the mid-$530s before pulling back slightly. It now sits between strong gamma support and a major Call Wall cluster, indicating a consolidation phase that could lead to either a continuation move or a deeper retracement.
* Call Walls & Resistance:
* 📍 $537.60 → Current price zone, right under minor gamma resistance
* 📍 $540.00 → 2nd Call Wall (95.45% GEX7)
* 🧱 $545–$562 → GEX8/extension zone for a bullish breakout target
* Put Support Zones:
* 🛡️ $530–$525 → Gamma pivot area; losing this would weaken bullish positioning
* 📉 $510.00–$505.00 → Strong HVL + PUT wall support
* 🚨 $490 → Second PUT wall = major breakdown trigger
* Volatility Insight:
* IVR 5.4, IVx Avg 22.7 → Low IV = cheaper premium for spreads
* Call flow 1.3% = Low aggressive bullish positioning
* GEX sentiment: 🟢🟡🟢 = Still supportive for consolidation with bullish lean
✅ Option Trading Suggestion:
Bias: Bullish consolidation, but near-term capped under $540 unless volume expansion
Strategy: Debit call spread for limited risk
* Entry Idea: Buy 540C / Sell 550C for Aug 2 or Aug 9 expiry
* Invalidation: Daily close under $525
* Target: $545 short-term, $562 on breakout
Why this works: MSFT is supported by gamma positioning above $525 and could make a clean push toward $545+ if earnings momentum continues. Spreads help protect from IV crush after earnings.
🧠 Technical Analysis (1H Chart) (2nd Image Analysis)
Market Structure & SMC:
* ✅ Clear BOS (Break of Structure) on earnings gap
* 🟢 Price is consolidating within the post-gap range
* ⚠️ Potential CHoCH forming if price fails $525, which would indicate weakness
Trendline Dynamics:
* Holding above short-term uptrend support line
* Still in a steep post-gap bullish channel
SMC Zones:
* 🟩 Demand / OB Zone: $530–$525 → High-probability bounce area
* 🟥 Supply Zone (Purple Box): $538–$545 → Overhead resistance from post-gap highs
🔄 Price Action & Key Levels
* Support:
* ✅ $530–$525 → First defensive zone
* ✅ $517–$513 → Secondary support
* 🚨 $510–$505 → Hard gamma floor
* Resistance:
* 🚩 $540 → 2nd Call Wall resistance
* 🚀 $545–$562 → Extension zone if breakout occurs
🧭 Scalping / Intraday Trade Setup
🟩 Bullish Setup:
* Entry: $530–$532 dip reclaim
* Target 1: $540
* Target 2: $545–$550 extension
* Stop: Close under $525
🟥 Bearish Pullback Setup:
* Entry: Rejection at $540
* Target 1: $530
* Target 2: $525
* Stop: Breakout above $540 with volume
🔁 Summary Thoughts
* MSFT has post-earnings momentum but is consolidating just below a Call Wall cluster.
* Holding $525–$530 keeps the bullish case alive toward $545+.
* Options are cheap enough for defined-risk bullish spreads, but caution if $525 breaks.
* Expect range-bound chop until a decisive breakout over $540 or a breakdown under $525.
🚨 Disclaimer:
This analysis is for educational purposes only and does not constitute financial advice. Always do your own research and manage your risk accordingly.
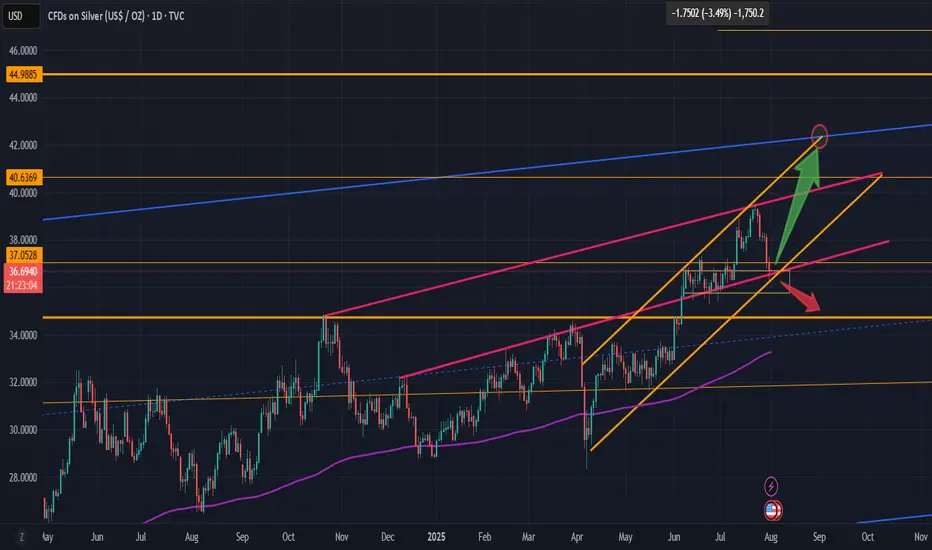
Silver short term potential correction within a bull marketSilver short term potential correction within a bull market. Either way...
Don't leverage. Buy ETF or physical, and hold.
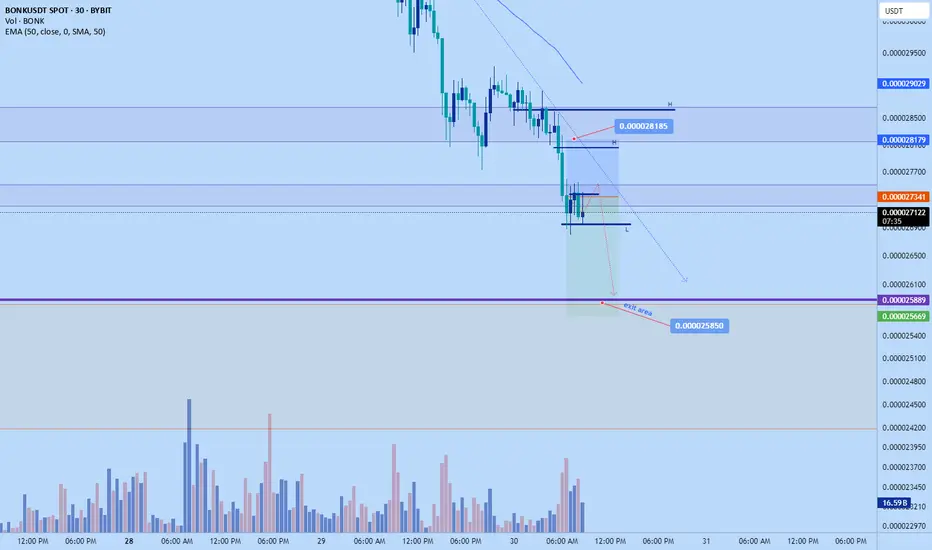
Bonk short to $0.02585Opened a short position on bonk just now. Aiming for 0.02585
Sl: $0.028185 or higher
Roughly 2RR
DTT strategy used - Learn more on X
ATAI Bulls break to weekly higher highsNASDAQ:ATAI Bulls break to weekly higher highs, making 3.06 Monday's low now THE most important support level going forward.
Support: 4.04, 3.66, 3.61
Resistance: 4.29, 4.52

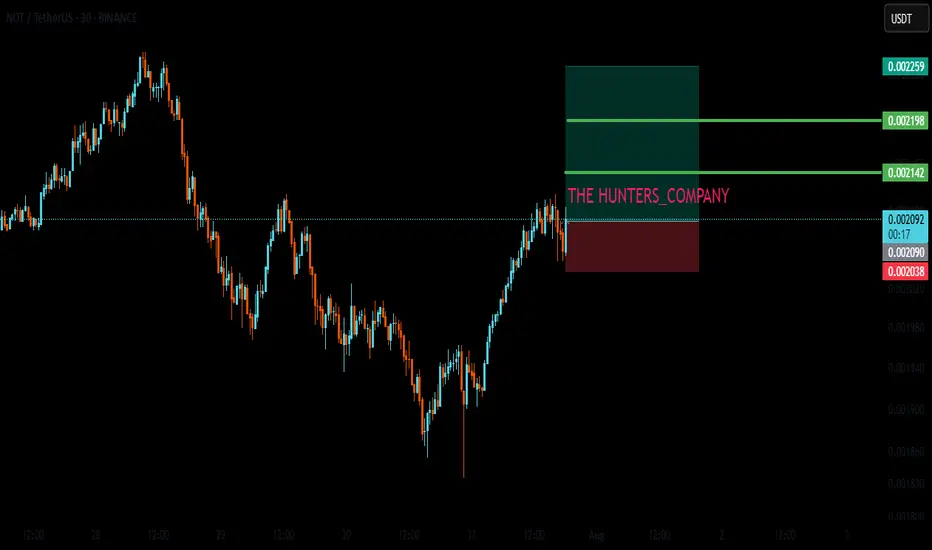
LIVE TRADEHello friends🙌
Given the good trend we had, now that we have had a price correction, we can enter the trade with risk and capital management and move towards the specified goals.
🔥Follow us for more signals🔥
*Trade safely with us*
Bitcoin Cash Breaks Structure With Bullish MomentumFenzoFx—Bitcoin Cash remains bullish, trading back above the VWAP from July 24 near $582.9. Today’s breakout above $572.6 featured a strong bullish engulfing pattern, leaving a fair value gap now under test.
The outlook favors revisiting the $607.0 high, and with the trend still positive, it’s advisable to leave a runner open. A further rally toward $630.0 remains likely if momentum persists.
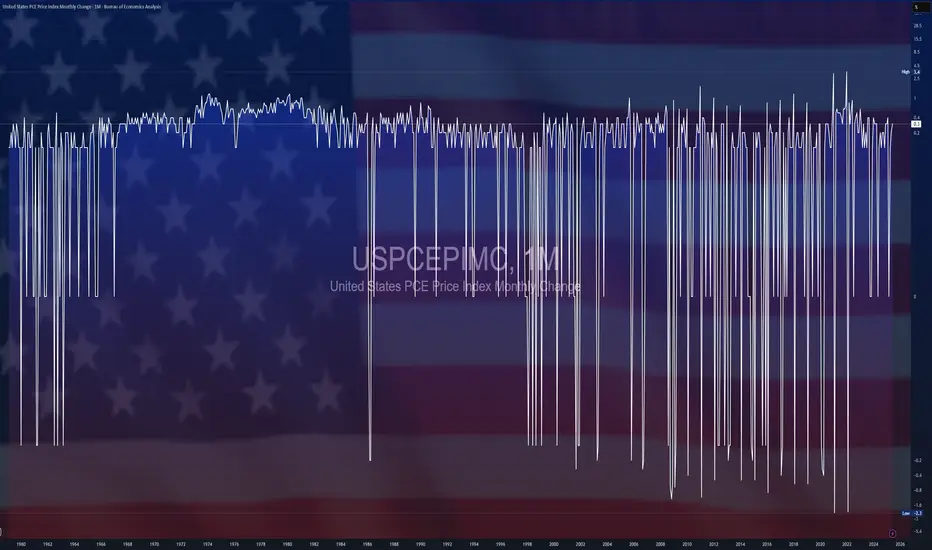
$USPCEPIMC -U.S PCE Prices Rise (June/2025)ECONOMICS:USPCEPIMC
June/2025
source: U.S. Bureau of Economic Analysis
- The US PCE price index rose by 0.3% mom in June, the largest increase in four months, and in line with expectations, led by prices for goods.
The core PCE index also went up 0.3%, aligning with forecasts.
However, both the headline and core annual inflation rates topped forecasts, reaching 2.6% and 2.8%, respectively.
Meanwhile, both personal income and spending edged up 0.3%.
RDDT Earnings Setup (2025-07-31)
### 🔥 RDDT Earnings Setup (2025-07-31)
📈 **Bullish Bias | Confidence: 75%**
🎯 Target: \$165+ | 🔒 Resistance: \$155.58
---
### 📊 FUNDAMENTALS
* 📈 **Revenue Growth (TTM): +61.5%**
* 💰 **Gross Margin**: 90.8%
* ⚠️ **Op Margin**: 1.0% (Thin runway)
* 💥 EPS Surprise Avg: **+191% (5/5 beat streak!)**
* 📉 EPS Growth Est: **-86.6%** → low bar = potential upside
**🧠 Fundamental Score: 7/10**
---
### 🧠 OPTIONS FLOW
* 🔵 **\$172.00C** building OI
* 💸 IV Rank \~0.75 (Move priced in!)
* 🧲 Bullish call activity > puts
* 🛡️ Put skew = hedged upside
**📊 Options Score: 7/10**
---
### 📈 TECHNICAL SETUP
* ✅ Above 20DMA
* 🔥 RSI: 62.2 = strength but not overbought
* 📦 Accumulation spike
* 🔐 Resistance: \$155.58
* 🧲 Break = squeeze setup
**📉 Technical Score: 8/10**
---
### 🌍 MACRO BACKDROP
* 🌐 Digital ad sector = support
* 🚨 Regulatory overhang = minor risk
* 🧬 Growth stock rotation helps RDDT
**🌐 Macro Score: 7/10**
---
### 🎯 TRADE IDEA
**💥 RDDT \$172.00C** (Aug 1 Exp)
* 💵 Entry: \$6.15
* 🎯 PT: \$18.45
* 🛑 SL: \$3.08
* 📈 Risk/Reward: \~3:1
* ⏱ Exit: 1–2 hrs post-earnings
* ⚖️ Sizing: 1 contract = \~\$615 risk
---
### ✅ SUMMARY
🧬 Strong rev growth + historical beat streak
🎯 Technical breakout setup + bullish flow
🚀 Potential squeeze toward **\$165+**
📣 Tag: #RDDT #EarningsPlay #OptionsFlow #RedditIPO #SwingTrade #TradingViewViral #EarningsSeason #TechStocks #CallOptions

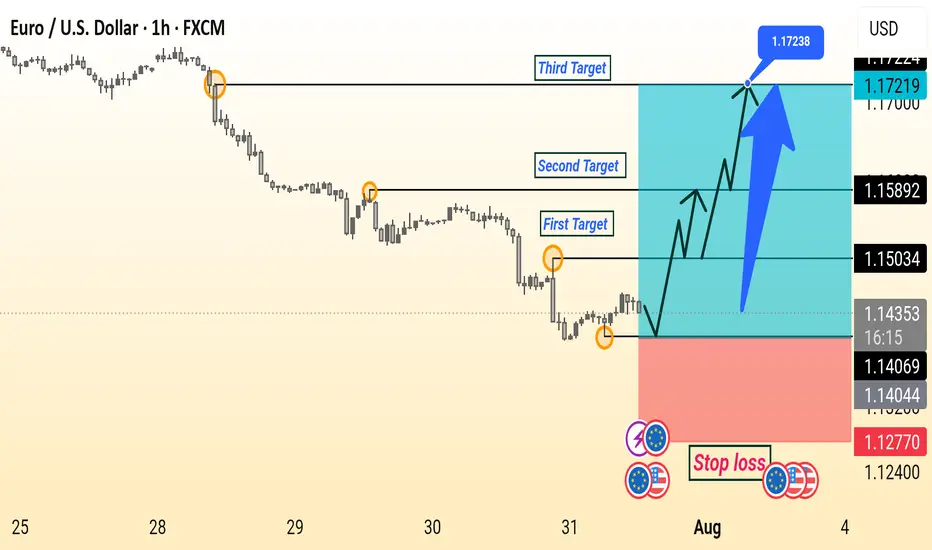
EUR/USD Setup Is Ready This is a bullish EUR/USD (Euro/US Dollar) 1-hour chart analysis. The setup indicates a potential upward reversal after a downtrend, supported by a series of higher lows.
Key elements:
Entry Point: Around 1.14044–1.14376.
Stop Loss: Placed below the recent low at 1.12770 to manage risk.
Targets:
First Target: 1.15034
Second Target: 1.15892
Third Target: 1.17238
The chart suggests a buy setup with a risk-reward strategy, aiming for a breakout and continuation towards higher resistance levels. The large upward arrow emphasizes bullish momentum expectations.
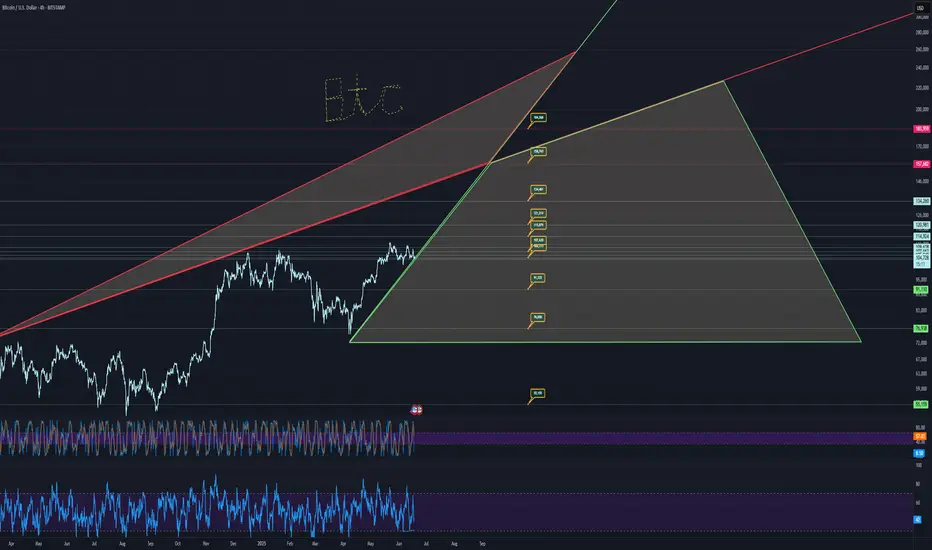
BTC USD 180K BIG HOW?Trends and price targets is how, but realistically, it looks like 134k in the short term.
Drop is wicked if it were to occur, takes price to literally 12k, which you want to go all in if that occurs.
55k is another drop zone.
Otherwise, it looks fairly bullish.
buy zone marked in green,
sell in red.
watch the trends
and price targets are pretty accurate usually.
good luck!!
Custom charts by request.
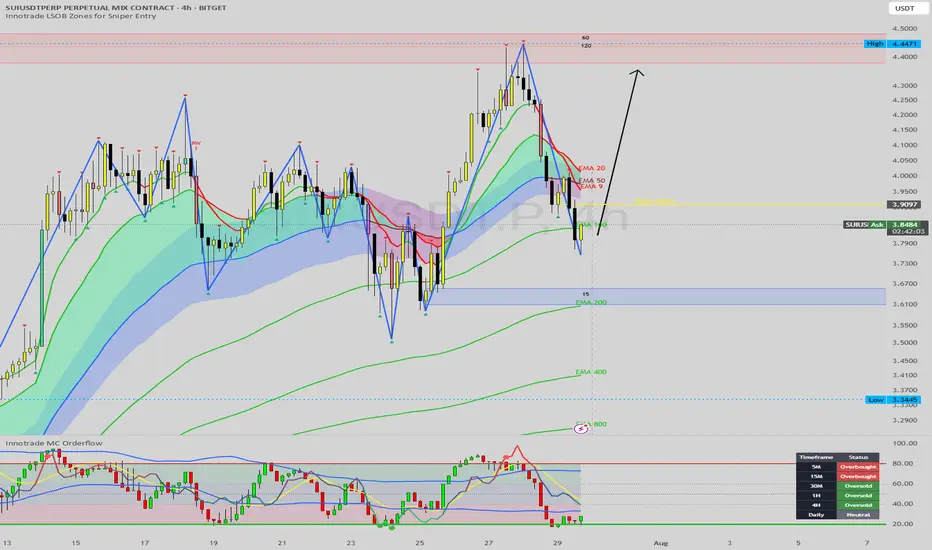
SUI Approaching Major Buy Zone: A High-Confluence Long SetupHello, traders. Today, we're putting SUI under the microscope as it undergoes a sharp but healthy correction following an impressive rally. The price has recently broken below its short-term moving averages, and is now heading directly towards a powerful cluster of technical support. This is a classic "buy the dip" scenario unfolding.
This analysis will provide a step-by-step breakdown of why the $3.60 - $3.70 zone represents a high-probability area for this corrective move to end, and for the primary bullish trend to resume.
The Analysis: A Convergence of Powerful Signals
The strongest trade ideas are not based on one signal, but on multiple, independent factors aligning. Here is the powerful confluence we are observing on the SUI 4H chart:
1. The Primary Bullish Structure:
First, let's establish the market context. The Zig-Zag indicator confirms that the primary market structure is firmly bullish, with a clear series of higher highs and higher lows. The current move is a textbook corrective pullback within this uptrend. Our goal is not to fight the trend but to identify the most logical point for it to continue.
2. The Key Support Cluster (Order Block + EMA 200):
The price is approaching a major floor of support. This floor is composed of two critical elements:
Demand Zone / Order Block: There is a significant demand zone (the blue-shaded box) sitting between $3.60 and $3.70. This is an area where strong buying pressure previously entered the market, and it's likely to act as a solid support level.
The EMA 200: Flowing directly through this demand zone is the EMA 200. This long-term moving average is one of the most significant dynamic support levels in an uptrend. The confluence of a static order block with the powerful EMA 200 creates an incredibly strong support cluster.
3. Multi-Timeframe Momentum Exhaustion (The Key Timing Signal):
This is the crucial timing component. While the price is dropping, our momentum dashboard reveals that sellers are becoming exhausted.
MC Orderflow: The oscillator in the sub-chart is plunging towards the green "Oversold" area, signaling that the downward momentum is getting stretched.
The Dashboard: This gives us a panoramic view of momentum. The 30M, 1H, and 4H timeframes are all simultaneously flashing "Oversold". This is a critical piece of information. It tells us that selling pressure is exhausted across multiple key timeframes, precisely as the price is about to hit a major support cluster. This is a classic recipe for a sharp reversal.
The Potential Trade Plan
Based on this powerful alignment of signals, here is a potential trade plan:
Entry Zone: The support cluster between $3.60 and $3.70 is the ideal zone to look for entries.
Stop Loss: A logical stop loss could be placed just below the demand zone and the EMA 200, around $3.55. A break below this level would invalidate the bullish structure.
Potential Targets:
Target 1: A reclaim of the Daily Open at $3.91.
Target 2: The intermediate resistance and recent swing high in the $4.15 - $4.25 area.
Target 3: A full retest of the major high at $4.45.
Conclusion
We are witnessing a textbook technical setup on SUI. The price is correcting within a confirmed uptrend and is now approaching a massive confluence of support (Order Block + EMA 200), all while multi-timeframe momentum indicators are signaling widespread seller exhaustion. This presents a compelling, high-probability case for a long position.
Disclaimer:
This analysis is for educational purposes only and is not financial advice. Trading cryptocurrencies involves a high level of risk. Always conduct your own research and consult with a licensed financial advisor before making any trading decisions.