BTC : The future of Bitcoin...Hello friends🙌
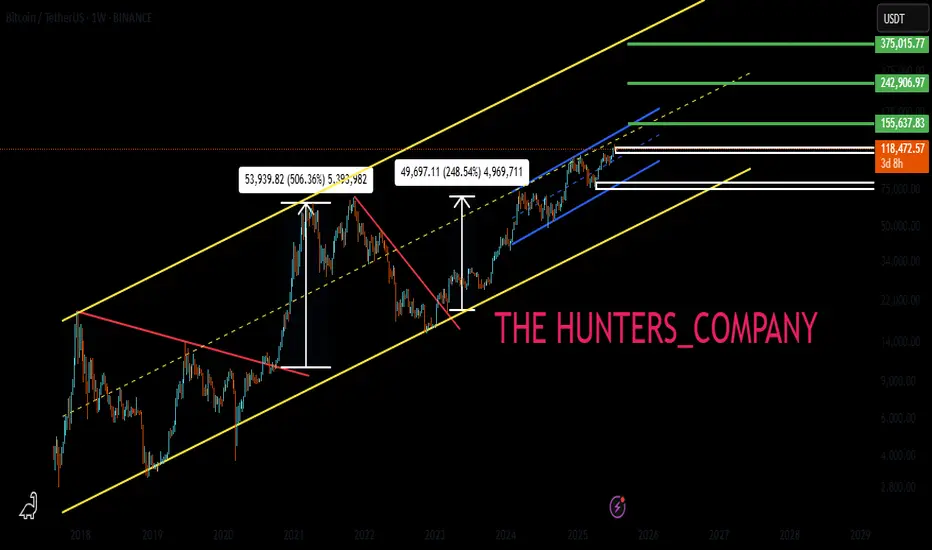
👀According to the price history, the price has always been bullish and is in a long-term bullish channel.
📈Now that the price is struggling in the middle of the channel and is gathering strength for a big move, which is expected to break the middle of the channel in the form of a resistance or middle channel, the price will move to the ceiling of the channel.
⚠Don't forget risk and capital management.
🔥Follow us for more signals🔥
*Trade safely with us*
Community ideas
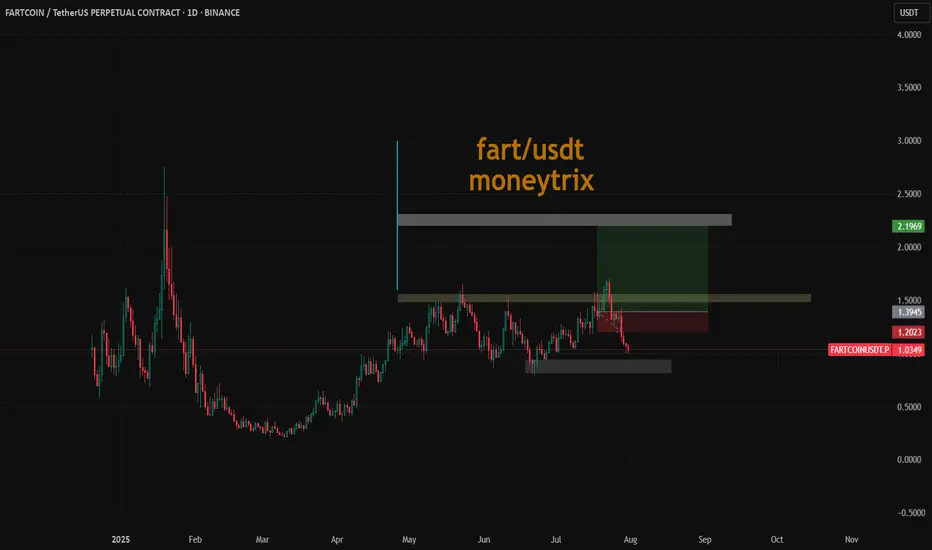
fart long entry soon as per analysisits not afinancial advice #dyor
evry thiong is mentioned on chart as u can see clearly
and this is strongly bullish until turn this below order block to breaker blok with heavy volume
Close out the Week STRONGLooks like price has found its bottom and is ready to push from here. We are looking for a strong forceful break out from this zone so we can go for the higher levels. Everything looks right from here and value keeps shifting up. I know we should get a solid entry but waiting for it to line up with time.

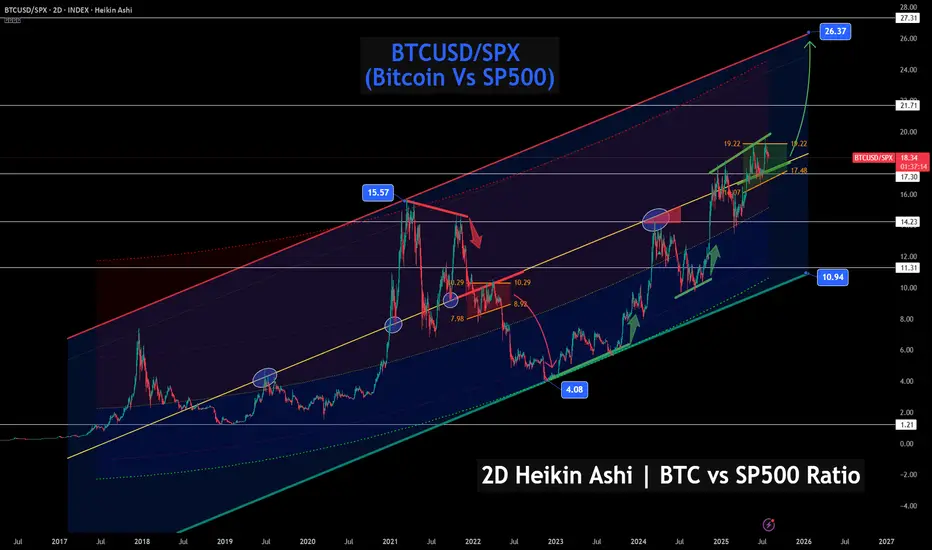
Bitcoin vs S&P 500 – Ratio Signals Strength, Chart favors BTC!🚀📊 Bitcoin vs S&P 500 – Ratio Signals Strength, Even If Stocks Correct 🔍📈
After posting earlier today about VOO (S&P 500 ETF) and the index itself hitting major resistance, I wanted to shift our focus to what could shine even if stocks pull back: Bitcoin.
This chart shows the BTCUSD/SPX ratio – in simple terms, how Bitcoin is performing relative to the S&P 500 . And what do we see? Clear, technical strength.
🔍 Key Observations:
BTC/SPX is currently breaking out from a bullish flag structure just above the 17.30–17.48 region
If the breakout holds, the projected technical target is near 26.37, the top of this multi-year channel
Historically, previous breakouts from similar zones have delivered explosive upside, even when equities struggled
🧠 So what does this mean?
Even if the stock market pulls back—as suggested in our earlier VOO/US500 chart—Bitcoin could still outperform, simply by dropping less, consolidating, or rising while stocks fall. That’s the power of analyzing ratios, not just absolute price.
We’ve already discussed how macro metrics like the Buffett Indicator (Stocks-to-GDP) are showing equity overvaluation. If capital starts rotating out of equities, Bitcoin is positioned as a beneficiary—especially if it maintains this relative strength.
💬 Final thoughts:
Don’t just look at BTC in isolation— look at it relative to what it's competing against
Ratios offer perspective: this one says Bitcoin’s trend vs stocks is up and strong
With solid support at 14.23 and room to run toward 26.37, this could be a chart to watch for months ahead
Are you watching this breakout? Let me know what your game plan is.
FOOD FOR THOUGHT: With Gold prices easing, stock markets at all time highs, is this the PERFECT time for big money to hedge with Bitcoin? Likely yes !
One Love,
The FX PROFESSOR 💙
Disclosure: I am happy to be part of the Trade Nation's Influencer program and receive a monthly fee for using their TradingView charts in my analysis. Awesome broker, where the trader really comes first! 🌟🤝📈
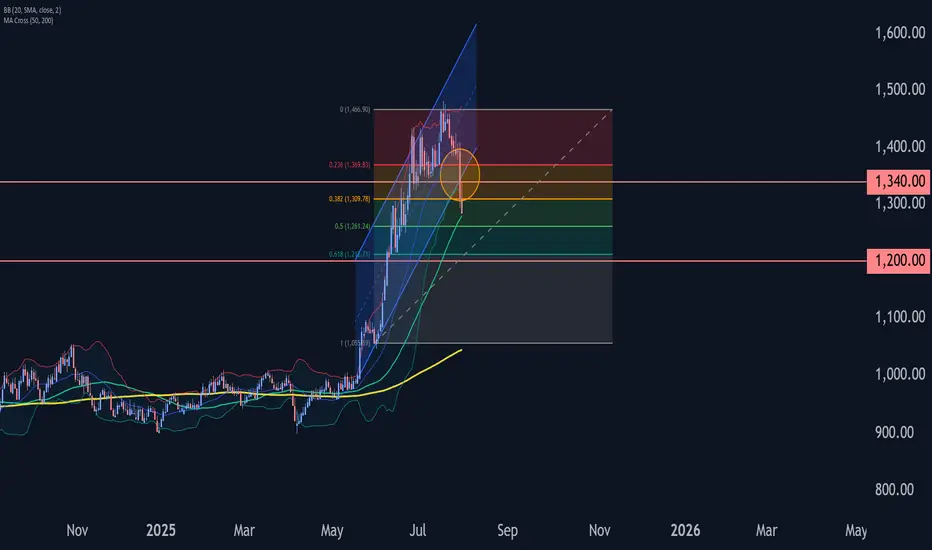
Platinum Wave Analysis – 31 July 2025- Platinum broke support zone
- Likely to fall to support level 1200.00
Platinum recently broke the support zone located between the key support level 1340.00 (low of the previous minor correction iv) and the support trendline of the daily up channel from May.
The breakout of this support zone accelerated the c-wave of the active ABC correction 4.
Given the bearish sentiment across the precious metals markets, Platinum can be expected to fall to the next support level 1200.00 (target for the completion of the active wave c).
Ena short to $0.5180Just now opened up a short position on ENA. Ena seems like a pair that wants to pump but at the moment I just think its relatively too high and likely will dump down further before correction.
Based on my DTT analysis- Direction, Target and timing it'll probably dump back to $0.5180
That's the direction and target and in terms of timing it'll probably start to do so anytime now given my analysis is correct.
Sl: 0.6127
Tps on chart
Time sensitive

AAPL EARNINGS TRADE SIGNAL (JULY 31)
### 🍏 AAPL EARNINGS TRADE SIGNAL (JULY 31) 🚀
📊 **AAPL Call Play** — Earnings Strategy
🧠 Multi-model conviction: **75% Bullish Bias**
---
### 🔍 Fundamental Drivers
✅ TTM Revenue: +5.1%
✅ Gross Margin: 46.6%
✅ 8 straight earnings beats
⚠️ Sector shift: growth → value = caution
📉 TTM EPS Est: \$8.31 (+29.4% growth est.)
🧮 **Score**: 8/10
---
### 💰 Options Flow Breakdown
🔥 IV Rank: 0.70
🔵 Bullish OI @ \$220C = 25,950 contracts
🔻 Skew: Heavy puts @ \$197.5 / \$200
⚠️ Gamma squeeze possible near \$220
📈 **Score**: 8/10
---
### 📉 Technicals
📍 RSI: 39.3 (Oversold)
📉 Trading below 20DMA (\$211.64)
🟥 Low volume pre-earnings = low conviction
📌 Support: \$207.5 | Resistance: \$220
📉 **Score**: 6/10
---
### 🌐 Macro Setup
⚠️ Supply chain pressures
⚠️ Regulatory risk ongoing
🔄 Growth → Value rotation still underway
🌐 **Score**: 5/10
---
### 🧠 Trade Setup (Call Option)
* 🎯 **Strike**: \$220
* 💵 **Entry**: \$0.87
* 📅 **Expiry**: 08/01 (2DTE)
* 📈 **Target**: \$2.61
* 🛑 **Stop**: \$0.43
* ⚖️ **Risk**: 2% of portfolio
* ⏰ **Timing**: Enter before close, report after market
🧮 Expected Move: ±5.0%
🔒 Confidence Level: 75%
---
### ⚙️ Exit Plan
✅ Profit: Exit @ \$2.61
❌ Stop: Exit @ \$0.43
🕒 Time Exit: Force close within 2 hours post-earnings
---
📣 **EARNINGS SCALP PLAY**
— AAPL is oversold w/ strong EPS beat history
— Bullish OI stacking at \$220
— High gamma setup, low IV risk = 💥
\#AAPL #EarningsTrade #CallOption #TradingView #0DTE #OptionsFlow #GammaSqueeze #UnusualOptions #AppleEarnings #SwingTrade #TechStocks

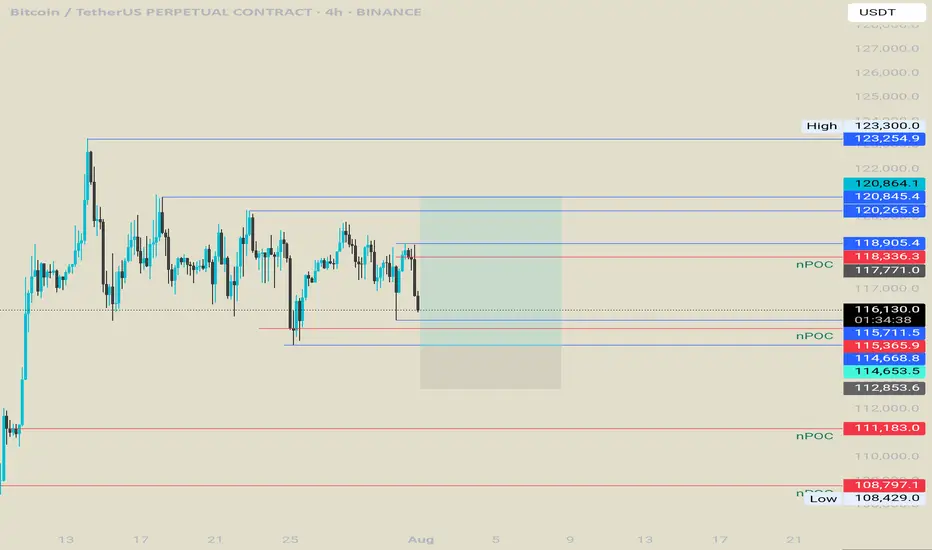
Bitcoin long from 114kWaiting for that npoc level to hit.
After that there is a 4h low , manipulate it , and we will try to catch a reversal.
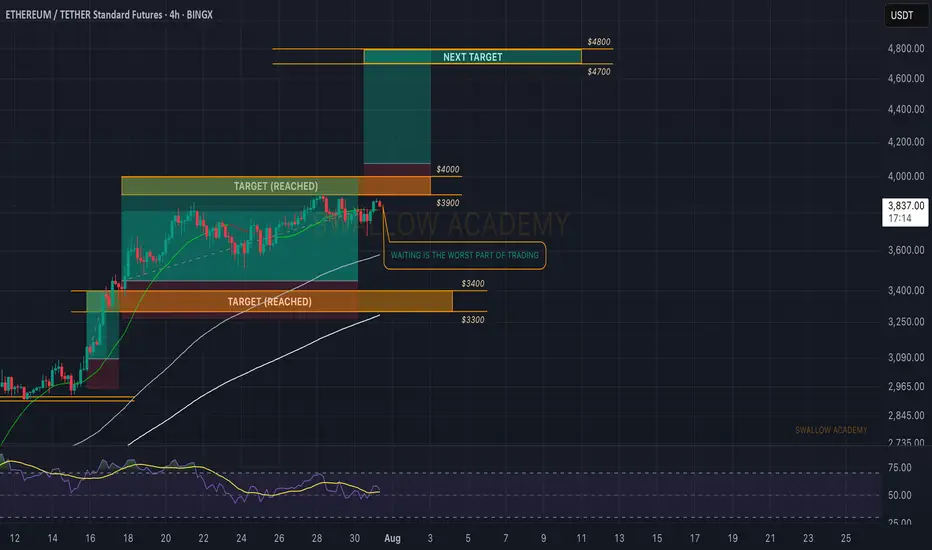
Ethereum (ETH): Waiting Is The Worst Part Of Trading | $4800ETH still looks good; we hit the target lately and now we are looking for the breakout to happen, which will give us another opportunity for a long position towards the $4800 zone.
Swallow Academy
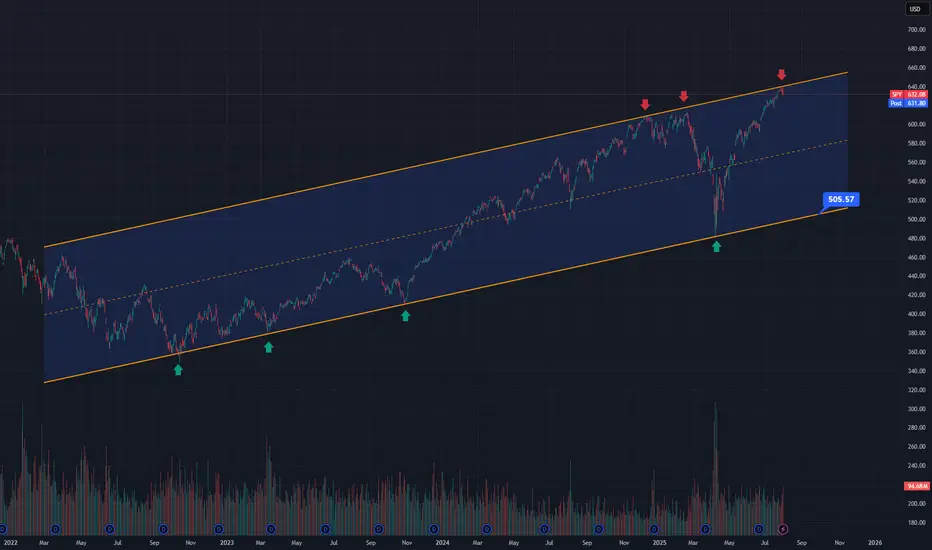
Next Leg down startingThe S&P 500 has been trading inside this rising channel for the last 3 and a half years. As you can see it has bounced off the bottom of the rising channel 4 different times and it is now back at the top of the channel. Price action gapped above the channel overnight but immediately sold off pre-market back inside the channel and completely reversed the move despite strong earnings from MSFT and META. This is very bearish and signals a move back down to the bottom of the channel once again and given that its already bounced off the bottom of the channel 4 different times, a 5th hit would have a high probability of breaking below the channel, which I would give a greater than 70% probability of playing out. If this happens, we will see much lower prices in this coming bear market.
BullishWaiting for price to sweep previous daily low the tap in the demand zone higher timeframe is bullish fotsi looking strong let’s see bois
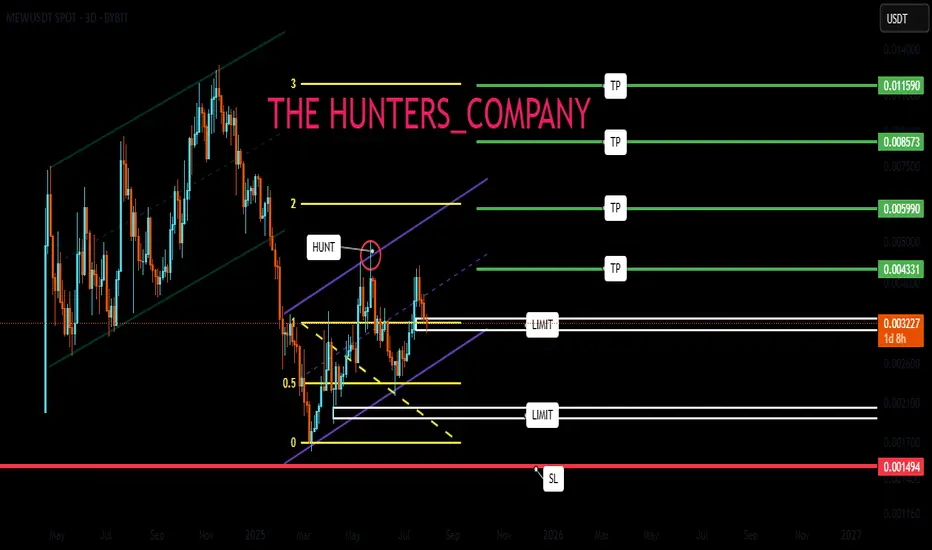
MEW : A meme coin that hasn't grown yetHello friends🙌
Given the decline we had, you can see that buyers entered the specified support area and entered the price into the ascending channel. That is why we can buy with risk and capital management and stay with it until the specified targets.
🔥Follow us for more signals🔥
*Trade safely with us*
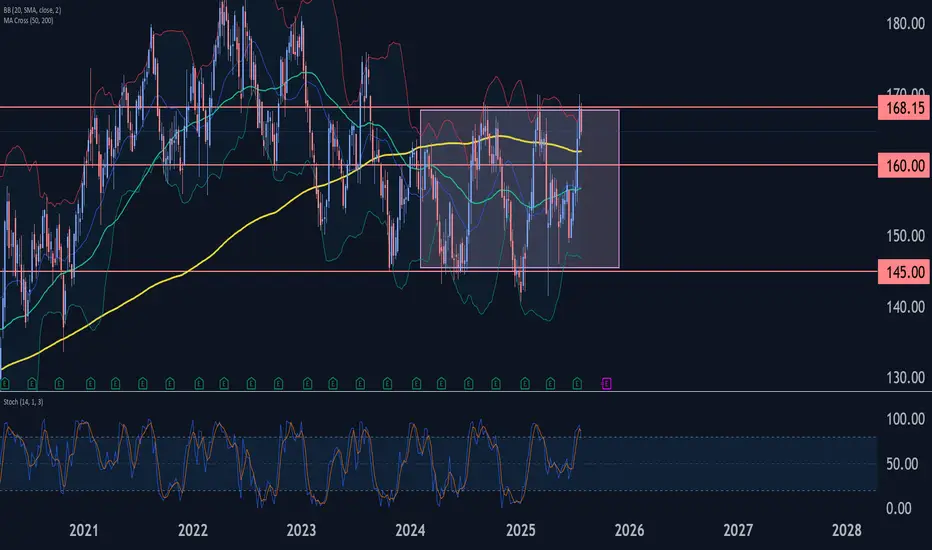
Johnson & Johnson Wave Analysis – 31 July 2025 Johnson & Johnson reversed from the resistance zone
- Likely to fall to support level 160.00
Johnson & Johnson recently reversed down from the strong resistance zone located between the long-term resistance level 168.15 (upper border of the weekly sideways price range from 2023) and the upper weekly Bollinger Band.
The downward reversal from this resistance zone stopped the earlier intermediate impulse wave (3).
Given the strength of the resistance level 168.15 and the overbought weekly Stochastic, Johnson & Johnson can be expected to fall to the next support level 160.00.
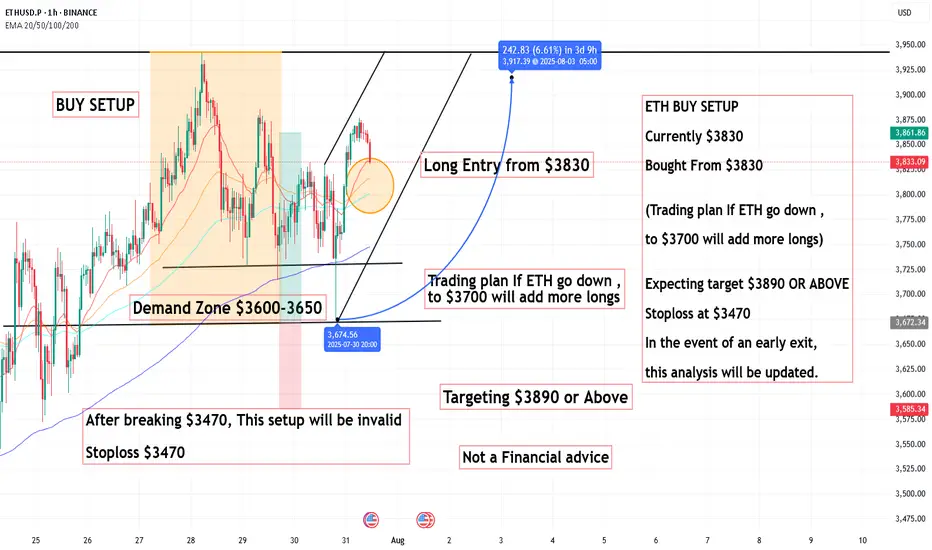
ETH BUY SETUP ,Bought From $3830ETH BUY SETUP
Currently $3830
Bought From $3830
(Trading plan If ETH go down ,
to $3700 will add more longs)
Expecting target $3890 OR ABOVE
Stoploss at $3470
In the event of an early exit,
this analysis will be updated.
Is Alt Season Underway?CRYPTOCAP:BTC.D | 6h
We're approaching the monthly close, and many are eyeing a potential breakdown in Bitcoin dominance — a key trigger for altcoin season.
On the mid-term chart, BTC dominance held support at 60.43% and recently retested the 60.65% base.
A sustained drop below 61.20% would favor altcoins. But if dominance accepts above 62%, it opens the door to a move toward 63.3%–63.8% level, likely putting pressure on alts.

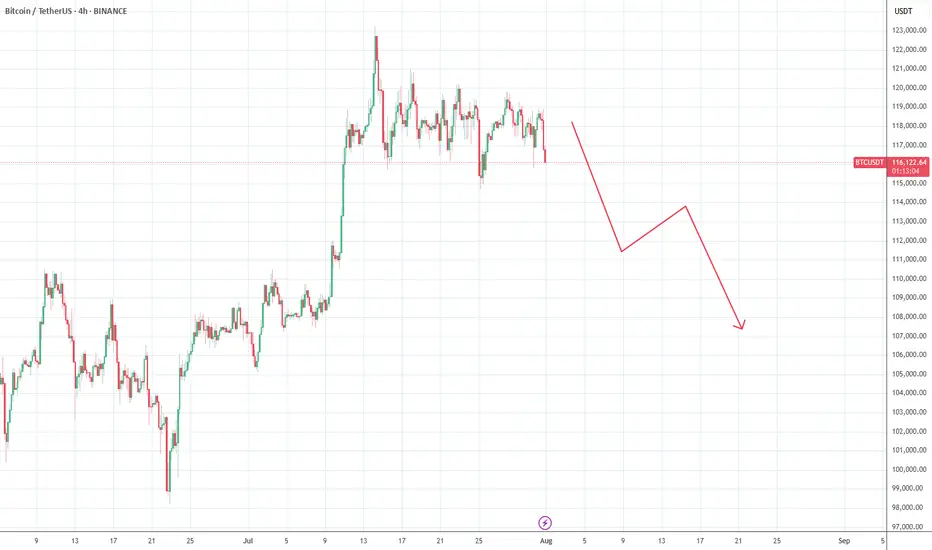
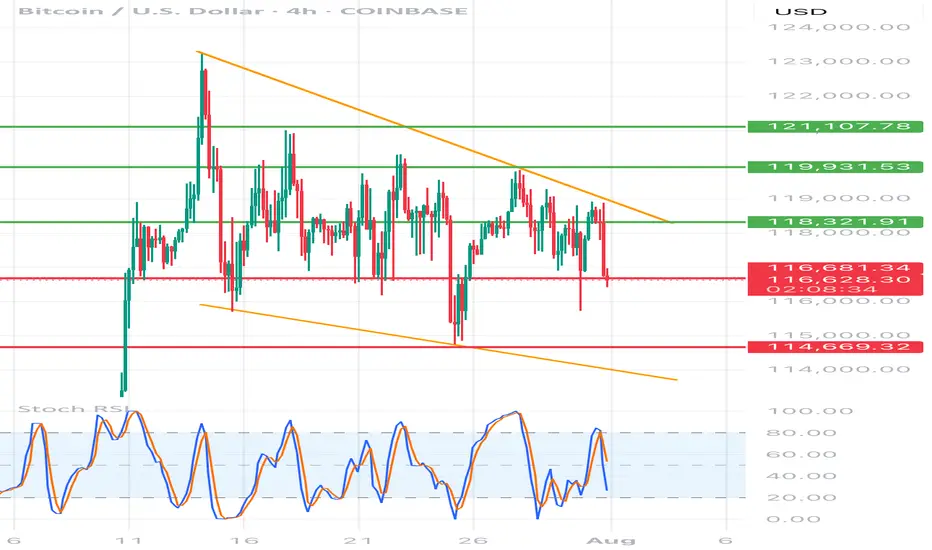
BTC/USD 4h chart🔸 Formation: Triangle descending (descending)
• Upper trend line (orange) - inheritance, connects lower and lower peaks.
• Lower support line (red) - approx. 116,700 USD - key support, tested many times.
🔻 Support
USD 116,700
Tested several times, currently threatened
🔻 Another support
USD 114,669
Target level when struck with a triangle
🔼 Resistance
USD 118,321
The nearest resistance - the former level of support
🔼 Resistance
USD 119,931
Local peak
🔼 Strong resistance
USD 121,107
Upper level of structure
📉 STOCHASTIC RSI (lower indicator)
• Line cutting and a decrease in the purchase area (> 80) towards the center.
• No extreme sales signal, but the trend begins to be negative.
⸻
📌 Applications and possible scenarios:
🔻 Bearish script (more technically likely):
• If BTC breaks below USD 116,700 with a 4H candle closure, possible:
• a decrease around USD 114,669 (lower limit of the triangle)
• Even lower - around 113,500-112,000 USD with an increased volume
🔼 Bullly script (less likely but possible):
• needed quick breaking above USD 118,300 and maintaining above this level
• Then the goal will be USD 119,931, and then possible traffic up to USD 121.107
⸻
📍 Summary:
• We see classic triangle descending-pro-draft formation.
• Support 116,700 USD very close to breaking - if it falls, down movement can be dynamic.
• Stochastic RSI coincides with the deterioration of the moment.
• The inheritance scenario seems dominant, unless there is a strong demand and over 118,300 USD.
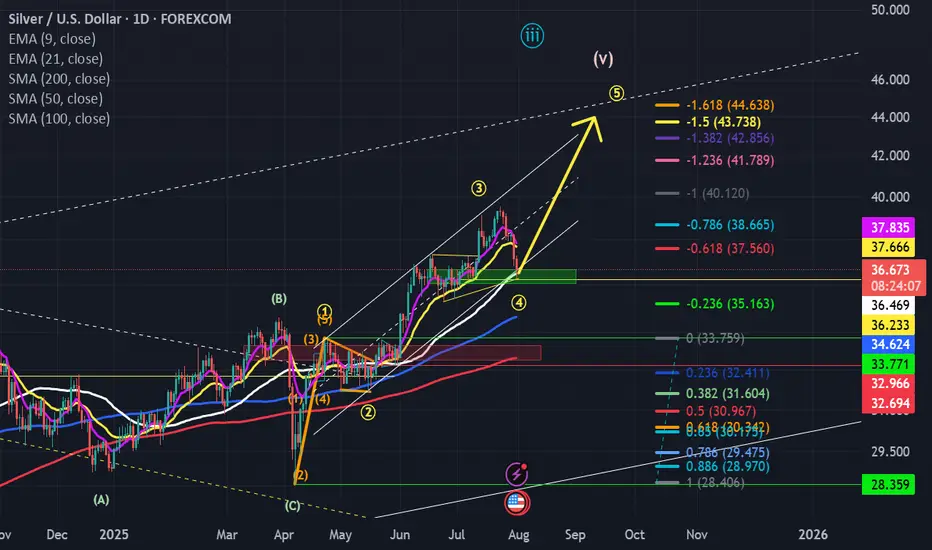
One more move up and then we should sell for now....This pb has allowed the shorts to cash in...we are at signficant support (middle of prior funnel) and the bottom of the channel...in my opinion, we resume the move up...but I think $42-$44 zone is the likely pivot pt for a significan move back down...back to mid to low $30's...This current pb is will shake off the weak hands! However, let this be a lesson...avoid leverage or you may pay dearly....
BTC:LIVE TRADEHello friends🙌
📉Given the decline we had, we now had a good price rebound in the specified support area, which shows the power of buyers. Now, with capital and risk management, we can buy at the specified points in a stepwise manner and move to the specified targets.
🔥Follow us for more signals🔥
*Trade safely with us*

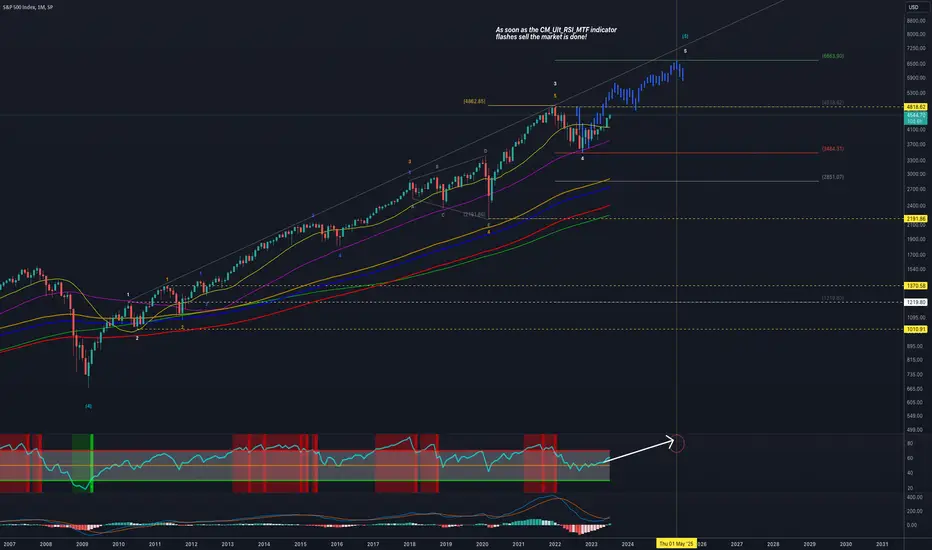
SPX defying gravity!It's a BULL market until it's not! Some how some way the markets will set new ATHs? I don't know how or why every macro economic indicator is yelling recession or worse but the chart tells me a different story. Bulls ball.....
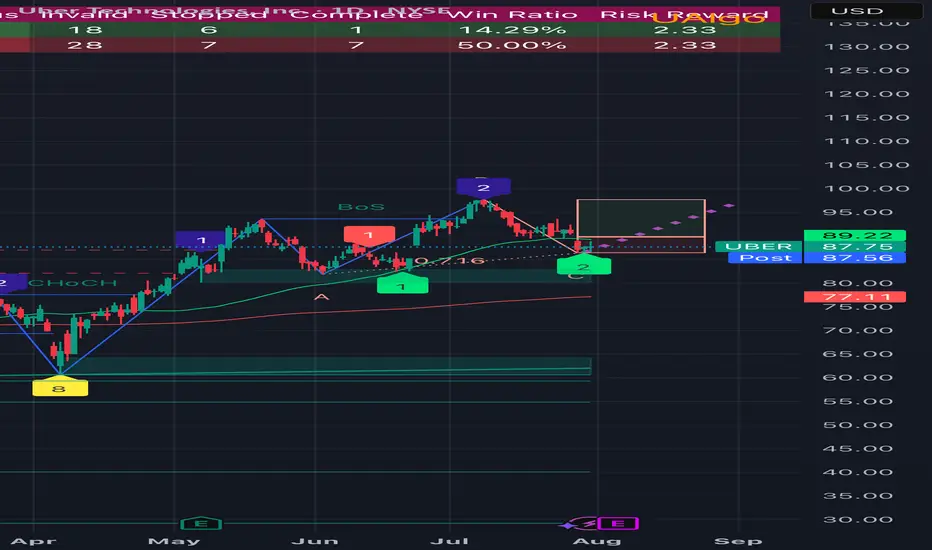
Uber swing playBullish Setup (if you think bounce holds)
• Buy Call Spread:
• Buy $90 Call (Sept expiry)
• Sell $100 Call (same expiry)
• Lower premium, defined risk. Target profit if stock runs to resistance.
• Cash-Secured Put:
• Sell $85 Put (Sept)
• Collect premium. If UBER dips, you get assigned at an effective cost basis below support.
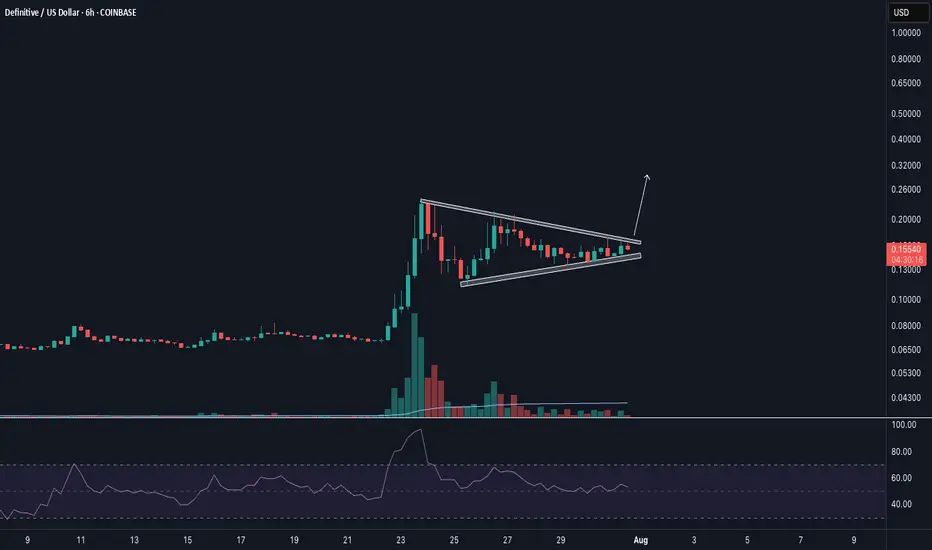
High Tight FlagDefinitive released an update to their trading product and a roadmap as well, which seemed to be well received by the market. Now developing a high tight flag on lower time frames. RSI reset.
Backed by Coinbase Ventures, among others