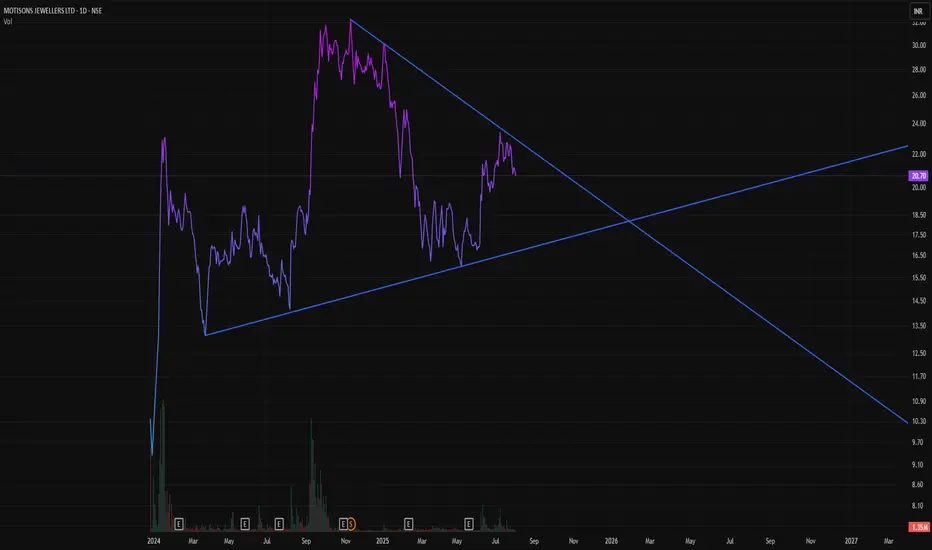
MOTISONS JEWELLERS LONGStock showing strong reversal at the lower trendline. Wait for the stock to break the triangle.
Community ideas
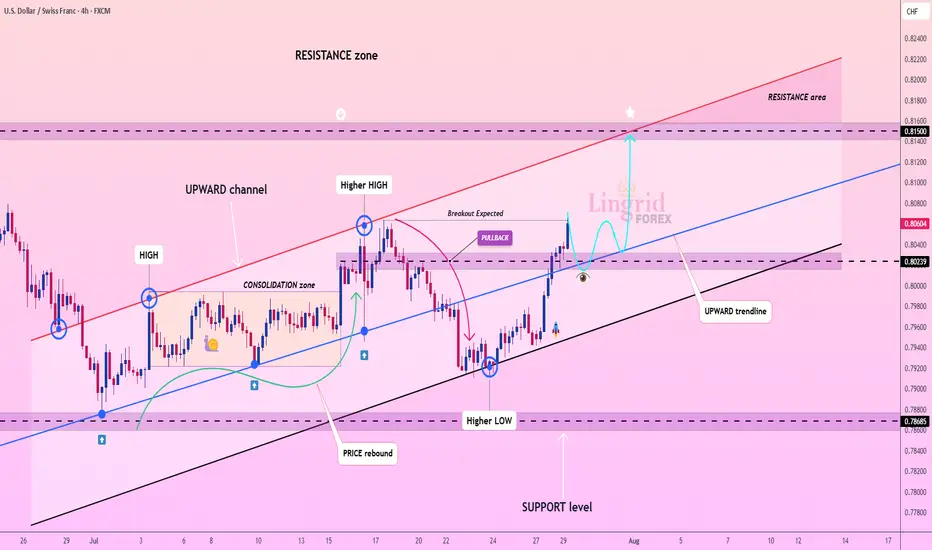
Lingrid | USDCHF Potential Bullish Move Following Level BreakoutFX:USDCHF surged from a higher low and is now retesting the broken structure near 0.802, maintaining its position within the broader upward channel. A clean bounce from this zone would confirm the bullish structure, targeting the upper channel resistance near 0.815. Pullback and higher low structure support continued upside movement with short-term consolidation possible. A breakout from the consolidation box could accelerate momentum toward the resistance area.
📈 Key Levels
Buy zone: 0.802 – 0.805
Buy trigger: Bullish confirmation above 0.805
Target: 0.815
Invalidation: Drop below 0.796
💡 Risks
False breakout near 0.805 may lead to rejection
Failure to form higher high would invalidate bullish sequence
Momentum divergence could slow rally near resistance
If this idea resonates with you or you have your own opinion, traders, hit the comments. I’m excited to read your thoughts!
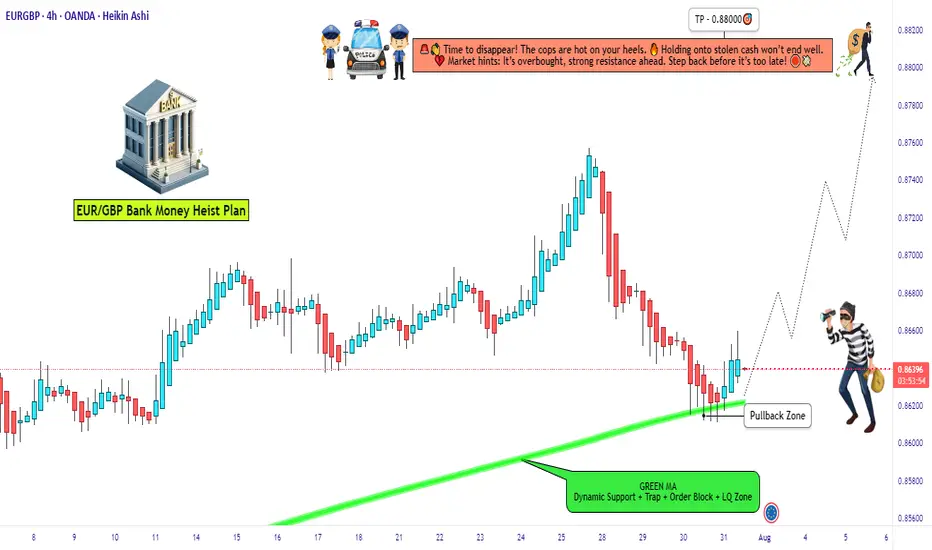
EUR/GBP Thief Trade: Swipe Profits Before Overbought Trap!🦹♂️ EUR/GBP "THE CHUNNEL HEIST" – BULLISH LOOT IN PROGRESS! 🚨💰
(Thief Trading Strategy – Escape Before the Cops Arrive!)
🎯 DEAR MARKET PIRATES & PROFIT SNATCHERS,
Based on our 🔥Thief Trading Style Analysis🔥, we’re executing a bullish heist on EUR/GBP ("The Chunnel"). The vault is wide open—time to swipe the loot before the high-risk resistance police barricade (aka overbought trap) shuts us down!
📜 THE MASTER PLAN:
✔ Entry (📈): "The Bullish Vault is Unlocked!"
Buy Limit Orders (15-30min TF) near recent swing lows/highs.
Thief’s DCA Trick: Layer entries like a pro robber—multiple limit orders for max loot.
✔ Stop Loss (🛑): "Hide Your Stash Wisely!"
SL at nearest 4H candle wick (0.86000)—adjust based on your risk appetite & lot size.
Remember: A good thief always has an escape route!
✔ Target (🎯): 0.88000 (or escape earlier if the cops get suspicious!)
🔎 SCALPERS & SWING BANDITS – LISTEN UP!
Scalpers: Stick to LONG-ONLY heists! Use trailing SL to protect profits.
Swing Thieves: If you’re low on cash, join the slow robbery—DCA & hold!
📡 WHY THIS HEIST IS HOT:
Bullish momentum in play (but BEWARE of overbought traps!).
Fundamental Drivers: Check COT Reports, Macro Data, & Sentiment.
🚨 TRADING ALERT: NEWS = POLICE RAID RISK!
Avoid new trades during high-impact news.
Trailing SL = Your Getaway Car! Lock profits before volatility strikes.
💥 BOOST THIS HEIST – STRENGTHEN THE GANG!
👉 Smash the LIKE & BOOST button to fuel our next market robbery!
👉 Follow for more heists—profit awaits! 🚀💰
🦹♂️ Stay Sharp, Stay Ruthless… See You on the Next Heist!
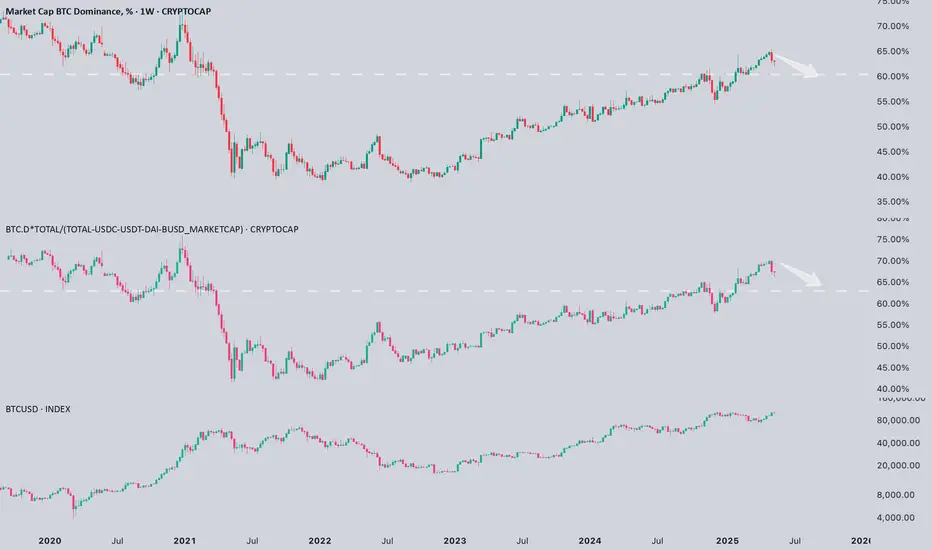
Is Bitcoin dominance finally starting to crack?Is #Bitcoin dominance finally starting to crack?
I think we’re getting the first real signal.
📉 After a strong run, BTC CRYPTOCAP:BTC dominance has rejected from major resistance and started to pull back. Even when adjusted for stablecoins, we’re seeing the same early signs of weakness.
📝 Historically, this kind of shift has been a precursor to capital rotation into altcoins. We might still be far from full-blown altcoin euphoria, but this could be the beginning of a transition from a BTC-led market to a broader risk-on phase, especially when the market starts pricing in a rate cut.
💡 Keep in mind: the biggest alt runs tend to come when BTC consolidates near highs while dominance fades. If this move confirms, it might be time to prepare.
GOLD falls sharply, fundamental analysis and technical positionOANDA:XAUUSD fell sharply below the $3,300/oz price level as Chairman Jerome Powell did not signal any rate cuts at his next press conference on September 16-17. He only said that “no decision has been made on September” and that “more data will be evaluated in the coming months.” Economic data undermined the case for a rate cut, while geopolitical play remained a potential support.
The Fed and Interest Rates
The Federal Reserve kept interest rates unchanged for a fifth straight meeting on Wednesday, defying persistent pressure from President Donald Trump and White House officials.
However, two members of the central bank's board dissented, a rare move in three decades that underscored growing divisions within the central bank over the impact of Trump's tariff policies.
At the meeting, the Fed kept its benchmark federal funds rate in a range of 4.25% to 4.5%, in line with policy through 2025. Last fall, the Fed cut rates by a total of 100 basis points.
However, Federal Reserve Board Governors Christopher Waller and Michelle Bowman opposed cutting interest rates by another 25 basis points, marking the first time since Alan Greenspan in 1993 that two board members have opposed a majority resolution at a meeting.
At the press conference, Chairman Jerome Powell did not signal a rate cut at the next interest rate meeting on September 16-17, saying only that “no decision has been made about September” and that “more data will be evaluated in the coming months.” Powell also noted that despite Trump’s call for a sharp 3% rate cut to reduce interest costs on US debt and stimulate the housing market, the Fed will continue to monitor the longer-term impact of tariffs on the path of inflation and economic recovery.
Market expectations for a Fed rate cut in September fell to 47% in Powell's speech.
Economic data
ADP jobs data beats expectations and is bearish
US ADP payrolls jumped 104,000 in July, beating market expectations of 75,000 and marking the biggest gain since March. The data showed continued strength in the labor market, reinforcing the Federal Reserve’s stance on keeping interest rates high. Meanwhile, the preliminary estimate of annual GDP growth in the second quarter came in at 3% (2.4% expected), and the core personal consumption expenditures price index rose 2.5% year-on-year (2.3% expected), indicating both economic resilience and inflation stability, further weakening expectations for a rate cut.
Keep an eye on the ISM manufacturing PMI and non-farm payrolls data on August 1. If the jobs numbers continue to be strong, this could reinforce the Fed’s dovish stance.
Geopolitical and Policy Plays
News of a 90-day extension of the US-China tariff deal has eased some safe-haven demand, but Trump’s August 8 deadline for a new Russia-Ukraine deal, coupled with tensions in the Middle East, continue to provide potential support for gold.
Continued purchases by central banks (such as China and India) are a positive signal in the medium to long term, but are unlikely to offset short-term pressure from the Federal Reserve’s policies.
Technical outlook for OANDA:XAUUSD
On the daily chart, gold has been sold below the $3,300 level and now the $3,300 level has become the nearest resistance at present. For now, gold will be limited by the area of the 0.382% Fibonacci retracement with the original price point of $3,300, along with that it has formed a short-term downtrend with the price channel, the next target will be around $3,246 in the short term followed by the Fibonacci retracement level noted with readers in previous publications.
On the momentum front, the Relative Strength Index is operating below 50 and is far from the oversold zone (20-0), indicating that there is still plenty of room for downside ahead.
In addition, the gold trend will also be pressured by the EMA21, as long as gold remains below the EMA21, the current technical conditions continue to favor the downside.
For the day, the technical outlook for gold is bearish with notable positions listed as follows.
Support: 3,246 – 3,228 USD
Resistance: 3,300 USD
SELL XAUUSD PRICE 3345 - 3343⚡️
↠↠ Stop Loss 3349
→Take Profit 1 3337
↨
→Take Profit 2 3331
BUY XAUUSD PRICE 3240 - 3242⚡️
↠↠ Stop Loss 3236
→Take Profit 1 3248
↨
→Take Profit 2 3254

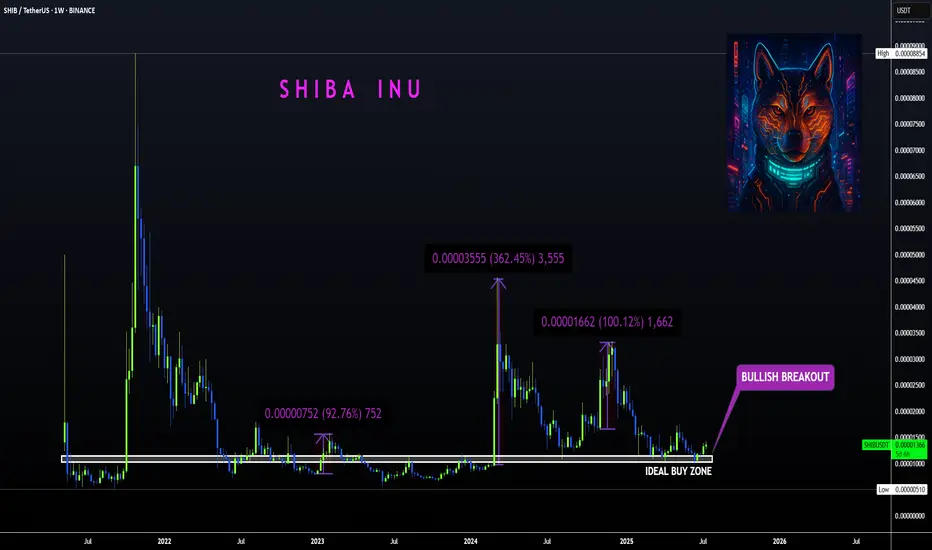
SHIBA | Bullish Breakout ABOVE Ideal Buy ZoneBINANCE:SHIBUSDT
Shiba is know to make big increases in short periods of time... that's why we love it!
The tricky thing about SHIBA is that the pumps can be unpredictable so the best way to ensure a position is to buy as low as possible to the ideal buy zone.
In the weekly timeframe, the technical indicators are not quite bullish yet. The moving averages is still above the price, meaning the bulls have yet to take full control of the price in lower timeframes.
The same can be said for the daily, although we are seeing progress as the 200d moving averages have been reclaimed:
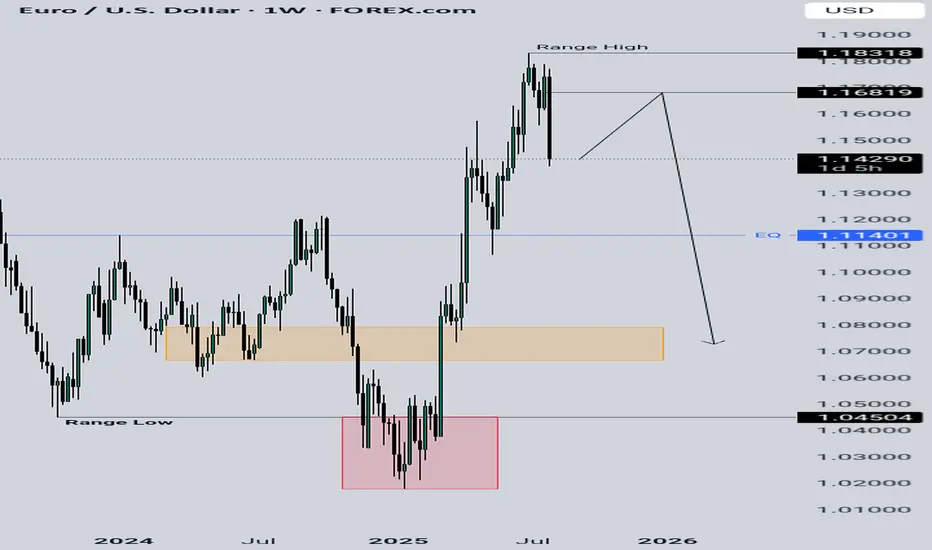
Bears on EURO My tools are suggesting a Bearish tone on the EURO in the coming weeks although we have to have a slight retracement higher into the outlined level then head on lower
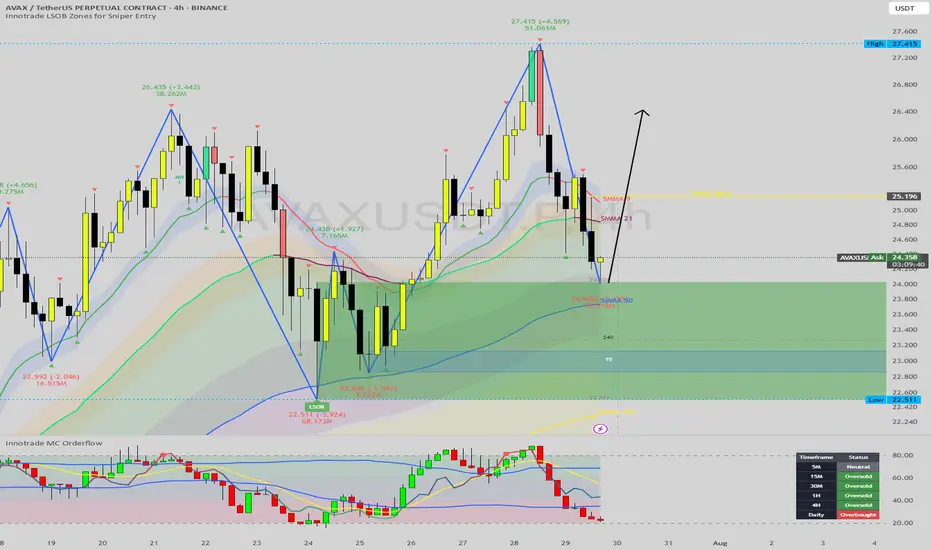
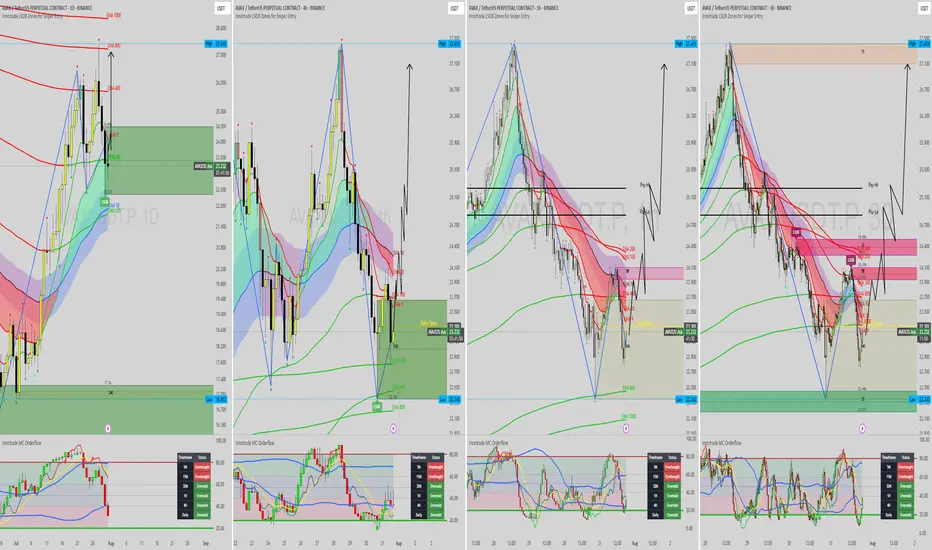
AVAX at the Golden Pocket: A High-Confluence Long Setup EmergesHello, traders. Today, we're analyzing Avalanche (AVAX), which has undergone a healthy and necessary correction after a powerful impulsive move upwards. Price has now pulled back to a critical decision point that is loaded with a confluence of technical support signals.
This analysis will break down, step-by-step, why the current price zone represents a high-probability area for a bullish reversal, potentially kicking off the next major leg up. This is an educational walkthrough demonstrating how to stack technical factors to build a strong trade thesis.
The Analysis: Stacking the Technical Confluences
A high-probability trade is rarely based on a single signal. It's built on multiple, independent factors all pointing in the same direction. Here is the confluence we are seeing on the AVAX 4H chart:
1. The Bullish Market Structure:
First, the context. The overarching trend for AVAX is clearly bullish. Our Zig-Zag indicator confirms a strong pattern of higher highs and higher lows. The current dip is, therefore, considered a corrective pullback within a larger uptrend, meaning we should be looking for buying opportunities, not fighting the trend.
2. The Golden Pocket (Fibonacci Retracement):
We've drawn a Fibonacci retracement from the beginning of the last impulsive leg up (
22.54)
Price has now pulled back precisely into the "golden pocket" between the 61.8% and 78.6% levels. This zone is a classic, high-probability area for trend continuation entries, as it often represents a point of equilibrium before the dominant trend resumes.
3. The Bullish LSOB (Liquidity Sweep Order Block):
The most significant signal in this area is the large green LSOB zone. This institutional footprint was formed after a sweep of a prior low and represents a major area of buying interest. The fact that the golden pocket lies directly within this LSOB provides a powerful layer of confirmation. Price has now entered this zone, effectively mitigating the imbalance and reaching a key area of demand.
4. Dynamic & Static Support Confluence:
Octo MA: The EMA 100 is flowing directly through the LSOB, providing a strong layer of dynamic support.
Daily Open: The Daily Open is situated just above, acting as an initial magnet and a potential first target for a bounce from this zone.
5. Momentum Exhaustion (Oscillator Analysis):
This is the final, critical piece of the puzzle. Our MC Orderflow oscillator in the sub-chart shows that selling momentum is deeply exhausted, with the lines pushing into the green oversold territory.
Critically, the Dashboard confirms this across multiple timeframes (5M, 15M, 30M, 1H, and 4H are all flashing "Oversold"). This is a powerful signal that sellers are losing control and the market is primed for a reversal, providing excellent timing for a potential entry.
The Potential Trade Plan
Based on this strong confluence, here is a potential trade plan:
Entry Zone: The current area between $23.50 and $24.80 (the LSOB / Golden Pocket) is the ideal entry zone.
Stop Loss: A logical stop loss can be placed just below the low of the LSOB and the 100% Fibonacci level, around $22.40. This invalidates the entire setup if hit.
Potential Targets:
Target 1: The Daily Open / 38.2% Fib level at ~$25.40.
Target 2: A retest of the recent swing high at $27.41.
Target 3 (Extension): If the trend resumes with strength, longer-term targets can be found at the 127.2% or 161.8% Fibonacci extension levels.
Conclusion
We have a powerful alignment of bullish market structure, a golden pocket retracement, a major institutional LSOB zone, dynamic MA support, and clear momentum exhaustion. This stack of confluences presents a compelling case for a long position on AVAX.
Disclaimer:
This content is for educational purposes only and does not constitute financial or investment advice. Trading carries a high level of risk. Please do your own research and consult with a professional financial advisor before making any investment decisions. You are solely responsible for any trades you take.
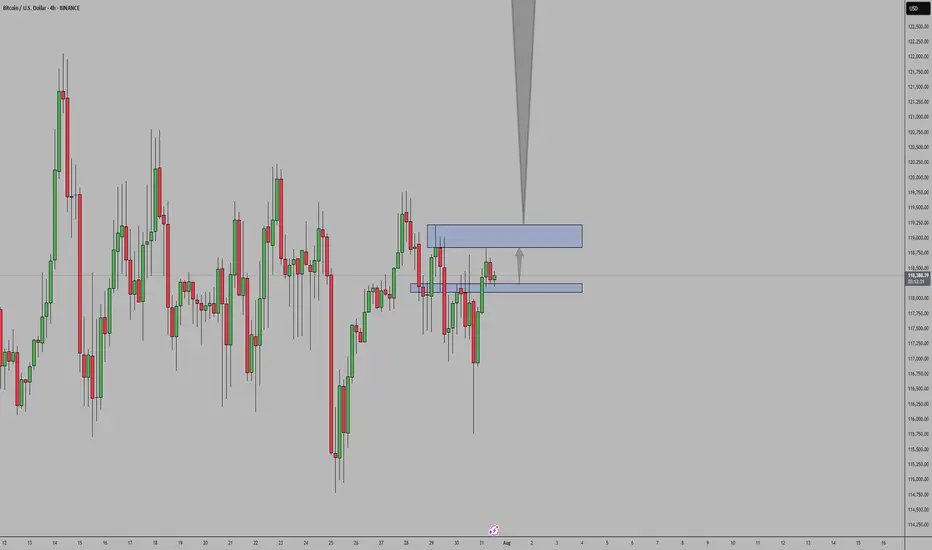
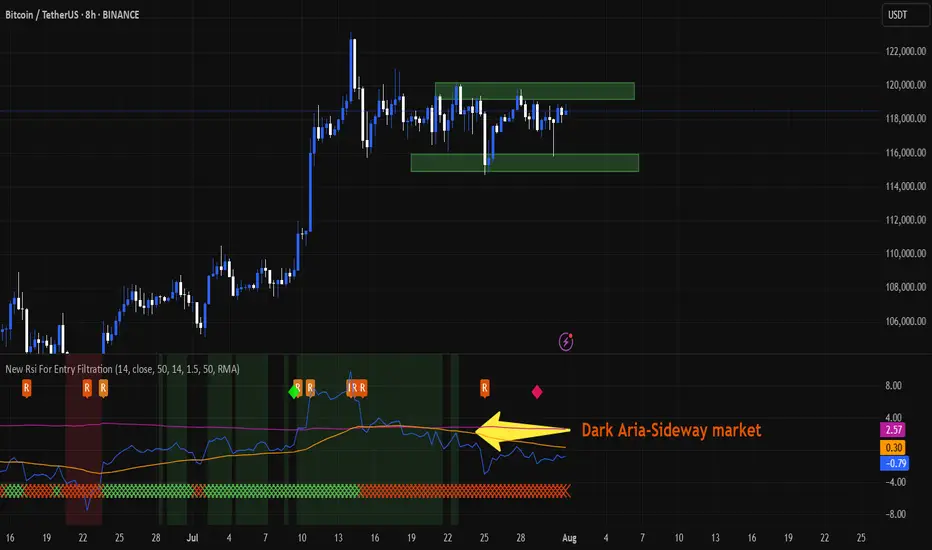
daily #bitcoin analysisBitcoin is fluctuating between the two price areas of $115,000 and $120,000 and I don't think it will trend either up or down anytime soon. Unless it breaks the two mentioned areas from above or below. As we can see, the new RSI indicator also shows a sideways trend. This analysis is not a financial recommendation in any way.
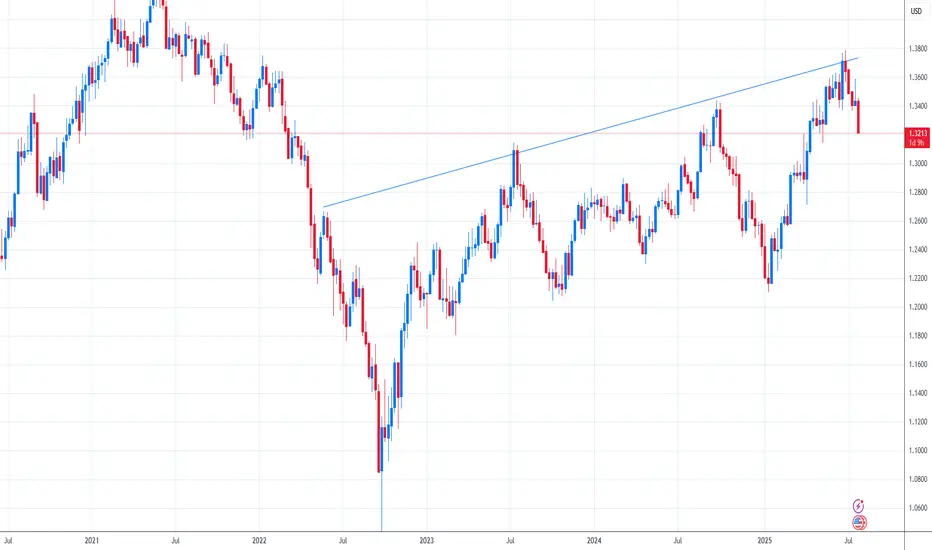
GBP/USD Under Pressure as Dollar Strength Builds and Technicals GBP/USD continues to weaken under the weight of renewed dollar strength. The pair has traded below its 50-day moving average for an extended period, and technical signals are aligning for further downside.
Last week’s bearish pinbar on the weekly chart highlighted rejection near key resistance, and now a potential bearish close on the monthly chart—marked by a large shadow candle—could reinforce the negative bias. If confirmed, this would suggest sustained pressure into August and beyond.
The U.S. dollar is gaining traction on the back of resilient economic data, stable inflation expectations, and rising Treasury yields. No changes are expected from the Federal Reserve in the near term, which removes uncertainty and supports the dollar through steady policy.
Meanwhile, the UK outlook remains fragile. Political uncertainty, weak economic momentum, and unclear forward guidance from the Bank of England are weighing on the Pound. Wage growth is slowing, inflation is cooling, and real yields remain under pressure.
If GBP/USD breaks below the recent support near 1.3205, it could open the door to deeper losses. As long as dollar strength persists and UK fundamentals remain soft, the pair may remain under bearish control. Watch for a confirmed monthly close to validate the setup.
HOW TO TRADE THE TREND WITH THE 8-STAGE "MARKET TREND MODEL"How to TRADE THE TREND ,
and decide WHEN TO GO LONG OR SHORT ,
using 8-STAGE MARKET LIFECYCLE ROADMAP
This way you will INCREASE YOUR WIN RATE ,
avoid getting stopped out by BEING COMPLETELY AGAINST THE MARKET ,
while seeing BIG MISSED MARKET OPPORTUNITIES
The Methodology is:
1. Simple & Systematic - so it is easy to learn
2. Works across all Markets
3. Works across all Timeframes
4. Can be combined with existing methodologies..

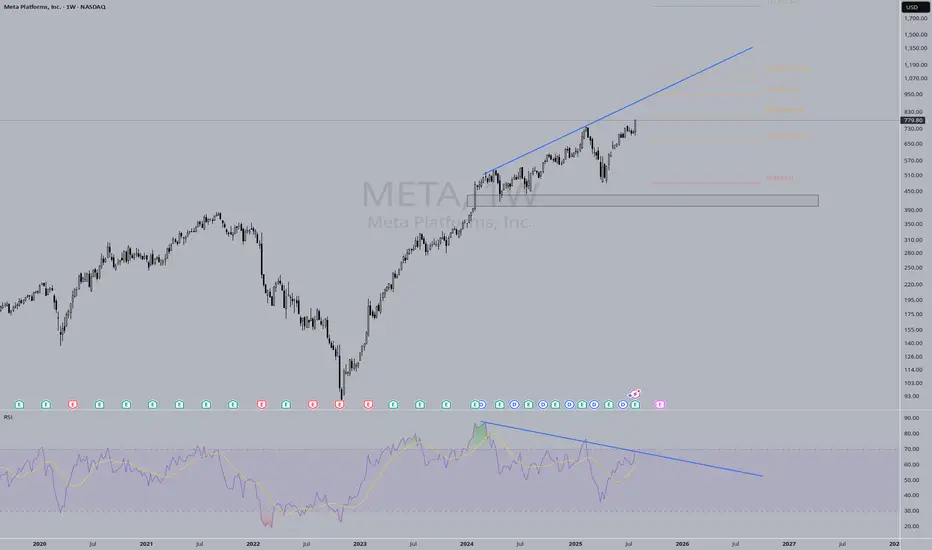
META Bearish RSI Divergence?RSI bearish divergence occurs when price makes a higher high, but the Relative Strength Index (RSI) forms a lower high. This mismatch signals weakening bullish momentum and hints at a potential trend reversal to the downside
AVAX Update - Second Chance for a Long positionAVAX left Bullish-FVG behind. It's normal that price comes back to take it's FVG. Long setup is in tact.
Decentraland: Where Are the Bulls?Decentraland’s MANA has recently struggled to sustain the upward momentum of wave iii in orange. Nonetheless, our primary scenario remains that this move should eventually push the altcoin above the $0.40 resistance level. Overall, we anticipate the full five-wave orange sequence could extend beyond the next key threshold at $0.85 before the larger blue wave (i) reaches its peak. Conversely, our 25% likely alternative scenario still allows for a new wave corrective low below the $0.19 support.
📈 Over 190 precise analyses, clear entry points, and defined Target Zones - that's what we do (for more: look to the right).

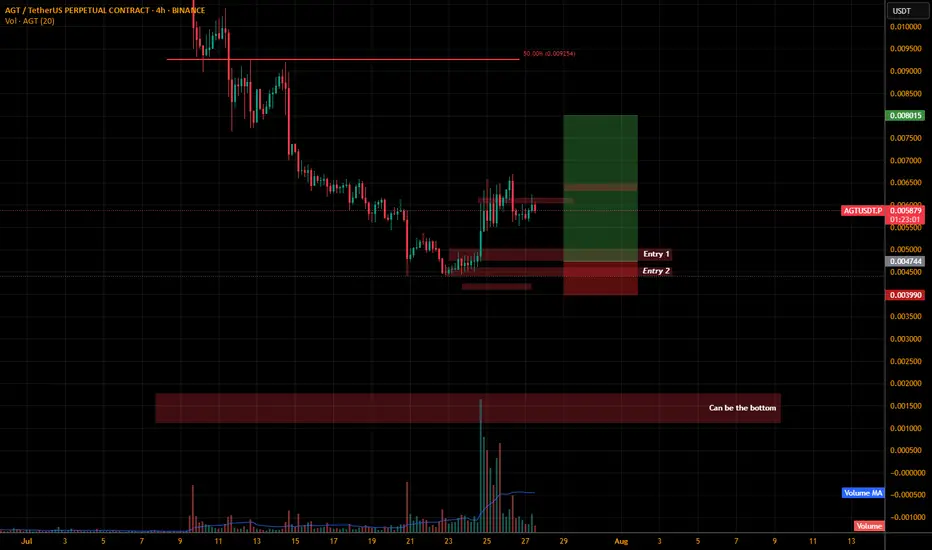
AGTUSDT.P LONGLets see some strong bullish moments at our entries level and most important we need to retest it with bullish candles. If not spotted than BOTTOM level is our point.
Let me give you guys the brief why i have chosen these two entries level as we can all see its forming a W pattern at this level. If price shows bullish momentum at these level than probably we are forming W.
Rest DYOR.
Follow me and support me to post more analysis.
Thank you.
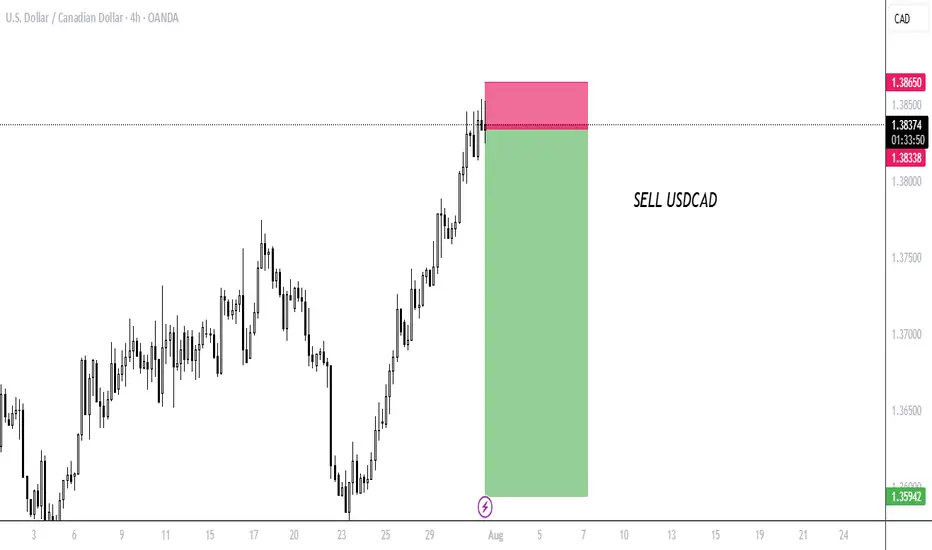
SELL USDCADIf you know familiar with Wyckoff and HS chart patterns ? you should see my reasons for selling USD CAD.Am selling USD CAD
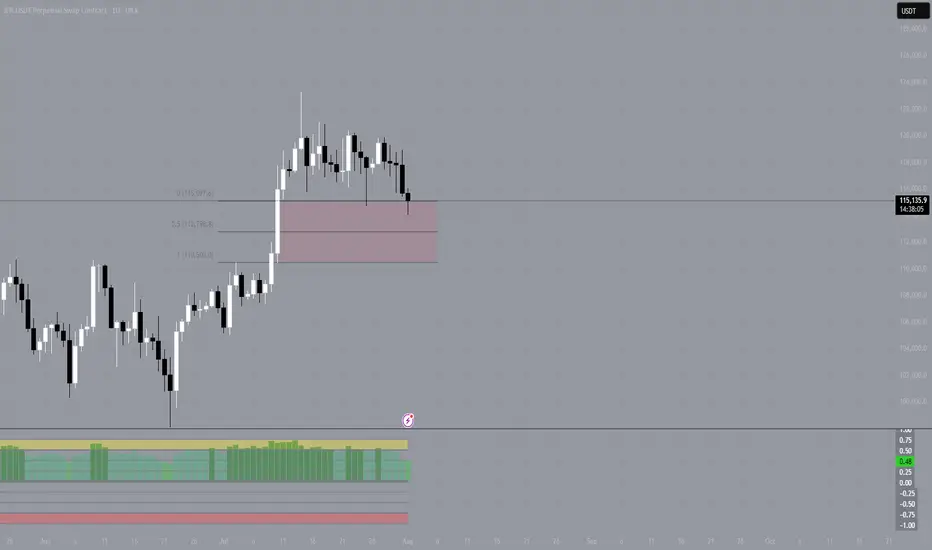
BTC in a Sideways MovementBTC in a Sideways Movement: When the Market Froze, Psychology Starts to Fail
Honestly, this is one of the most difficult stages in the market - uncertainty without a clear direction. Bitcoin gets stuck between levels, giving false breakouts and immediately rolling back. It seems that something serious is about to happen, but in reality, nothing happens.
This kind of price movement often leads to emotional burnout of traders. Some start entering trades blindly, just to stay in the market. Others suffer a series of small losses, trying to guess the breakout. And some just close the charts, unable to cope with the silence.
The reality is that markets get tired too, especially after big moves. What we are seeing now with BTC is probably just a rebalancing phase. And that's okay. If there is no clear pattern, then this is not your trade.
For now, I am just watching, marking the boundaries of the range and waiting. For myself, I highlight the order block for 1D as zones of interest, I wait for a reaction from it and will look for a model to enter a position.
Any breakthrough, confirmed by volume and subsequent movement - that's when the next real movement will begin.
The main thing is not to waste energy in vain. Sideways movement is not eternal. After silence, movement always comes.
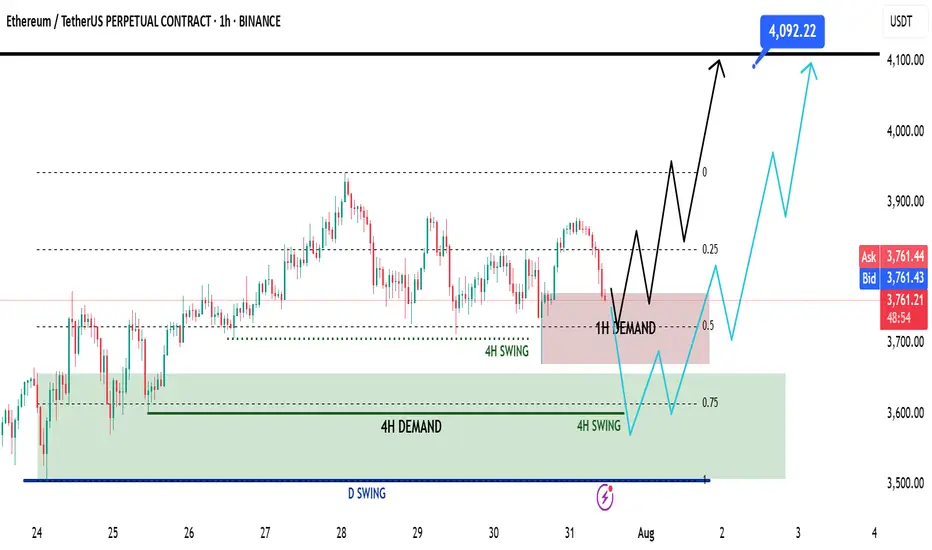
Ethereum Mid Week Update - Swing Long Idea📈 Market Context:
ETH remains in a healthy bullish structure. Despite the recent retracement, price action is still supported by strong demand zones on higher timeframes. No change in the overall sentiment from earlier this week.
🧾 Weekly Recap:
• Price rejected from the Fibonacci 0.5 EQ level — a discounted zone in my model.
• While doing so, it also ran 4H swing liquidity.
• After taking liquidity, ETH formed a 1H demand zone — a sign to look for lower timeframe confirmations for long setups.
📌 Technical Outlook:
→ Price has already tapped into the 1H demand zone.
→ From here, we have two possible scenarios:
Black scenario (ideal):
• Wait for 15M bullish break of structure (BOS).
• Enter after confirmation for long setups from 1H demand.
Blue scenario (deeper retrace):
• If no bounce from 1H demand, expect price to dip toward 0.75 Fib level (max discount).
• Watch for another liquidity run & 1H–4H demand formation.
🎯 Setup Trigger:
✅ 15M bullish BOS inside 1H or 4H demand zones
→ This would be the entry confirmation trigger for longs.
📋 Trade Management:
• Stoploss: Below the swing low of the 15M BOS
• Target: 4090$
💬 Like, follow, and drop a comment if this outlook helped — and stay tuned for more setups each week!
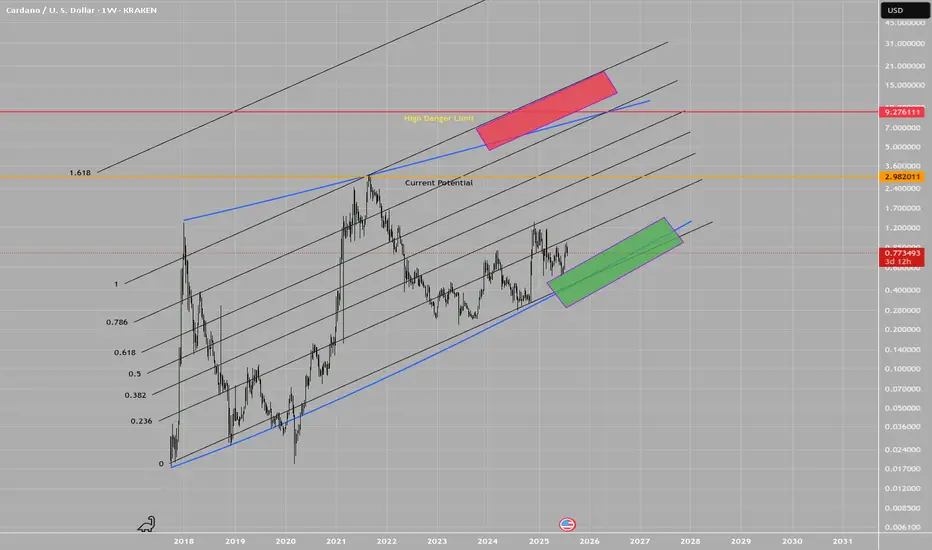
ADA, long term dubious speculationWARNING: This idea is highly dubious!
This is a logarithmic estimate of potential targets, in case Cardano moves in long logarithmic measures.
The real potential of this idea is strongly linked to the fundamentals evolution on time, i.e.: FED reducing the interest rate, for instance, but not only.
The plot features top and bottom limits drown by hand!, these are not perfect logarithmic measures, thus they certainly lacks of math accuracy. Beware.
There are zones in red and green, as transparent boxes, which depicts potential zones of buy and sell interest, of course, everything is in a log scale.
Everyone wish these kind of scenarios to be true. Only time and reality will show us the true face of it. In any case, in the total chaos of uncertainty that this market is, we try to make a sense of it.
Best of the lucks for everyone.
T.
DISCLAIMER: Do your own research! This idea is not a financial advice. All the information presented is highly speculative and cannot be taken as a reference in any circumstance.
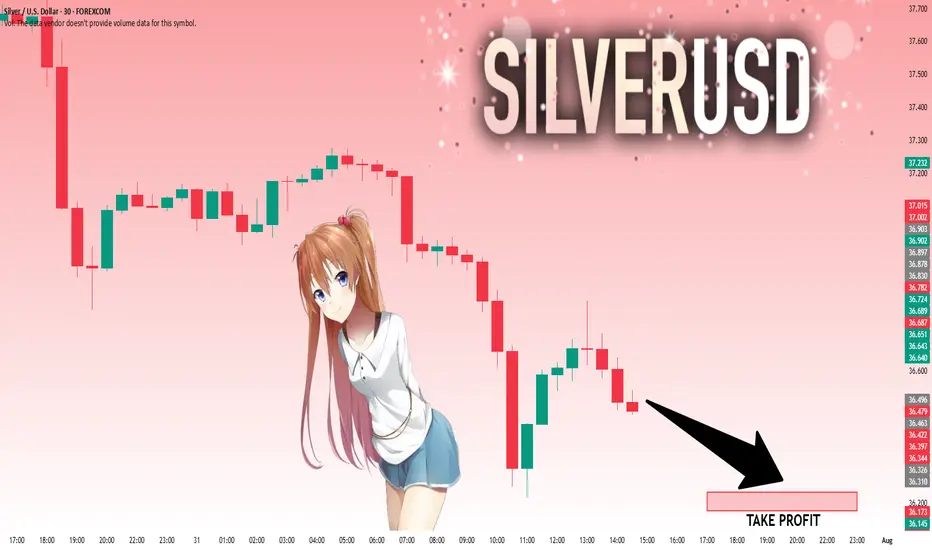
SILVER: Will Go Down! Short!
My dear friends,
Today we will analyse SILVER together☺️
The market is at an inflection zone and price has now reached an area around 36.490 where previous reversals or breakouts have occurred.And a price reaction that we are seeing on multiple timeframes here could signal the next move down so we can enter on confirmation, and target the next key level of 36.231..Stop-loss is recommended beyond the inflection zone.
❤️Sending you lots of Love and Hugs❤️
BNB - the strangest coin on the market? Almost no one trades it, and volumes have been falling for the second year in a row. But at the same time, it is the only token on the market that is in an upward flag. It is showing an even stronger trend than Bitcoin.
Yes, we are talking about BNB. Here's why you should pay attention to this token:
➡️ Money Flow shows divergence with the price, positions continue to close, and liquidity is gradually disappearing. However, over the past year and a half, the token's liquidity has hardly ever been in the negative zone.
Meanwhile, Bitcoin spent months in this zone, reaching values of -0.20. BNB barely touched the negative zone and immediately rebounded. This speaks to people's crazy faith in the token. There are simply no sellers.
➡️ Volume - purchase volumes have also diverged and continue to decline. BNB reached its current ATH on negligible volumes, which again highlights the complete lack of sellers. Even now, at the new ATH.
➡️ Liquidity Depth - as we know, the price moves from liquidity to liquidity. And now it is dozens of times greater at the bottom than at the top. This potentially hints at a local correction.
Also, during the growth, a GAP formed at the level of $576 - $502. And as we know, 99% of GAPs close sooner or later. But there is only one GAP and it is small, since BNB is a fairly low-volatility token and is traded quite effectively on its way up.
➡️ It is also the only one of the market leaders currently in an ascending flag, which means that the token has not yet seen a correction.
📌 Conclusion:
The chart looks obviously great, but there is local overheating, which will definitely be removed sooner or later. So BNB looks promising for shorting if it does not hold at $796.
However, Binance is certainly doing an excellent job of promoting its token with all these Launchpads and so on. So it is worth looking at a major correction to build up a spot position in BNB.
Subscribe and stay tune with more impactful ideas on trend tokens!

Opening A Small Position In FARTCOIN HereGood Morning Trading Family,
I may be a little early here, but at $1.00, I can't resist. I am picking up a small position in FARTCOIN here. I have three targets above. Each will eventually be hit IMO, but for now, I will only be shooting for TARGET #1. I may sell half at that point and let the rest ride.
Now, here are the technical reasons for making my entry here without waiting for my indicator to signal.
First of all, there are three trendlines, all significant, all converging at this one particular point, making this a powerful area of confluence!
Secondly, we broke to the topside of that descending trendline but never really came back to kiss mamma goodbye. Today we are doing that! This is a patent technical move that indicates healthy price fluctuation and is exactly what I have been waiting for.
Third, the VRVP indicates a ton of volume in this area (mostly buyer), which will be tough to break below without significant FUD, which, of course, is always a possibility.
Finally, all of my lower indicators show this thing is starting to get oversold: RSI, MACD, Chalkin MF, HA.
If we do dip lower, I will simply increase my position unless I hit my SL first. My SL is around .78 with my projected first target at 1.66 for a nice 1:3 rrr.
Good luck, all!
✌️Stew
