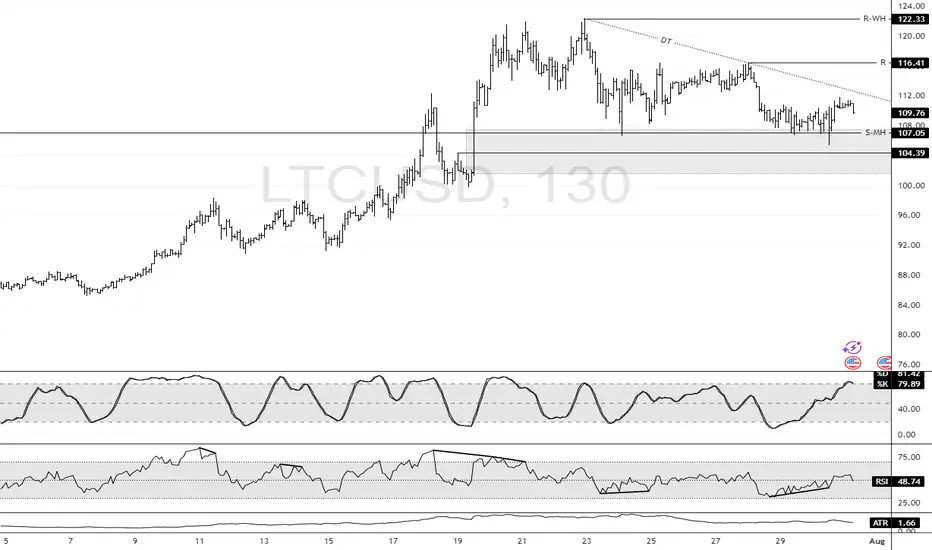
LTC: Bullish Structure Intact Above $104.3 SupportFenzoFx—Litecoin swept liquidity below $107.0 during today’s session and is currently trading near $110.0, supported by a descending trendline.
Technically, key support stands at $104.3. As long as this level holds, the bullish outlook is preserved. A break above the descending trendline could propel LTC toward the previous highs at $116.4 and potentially $122.3.
Community ideas
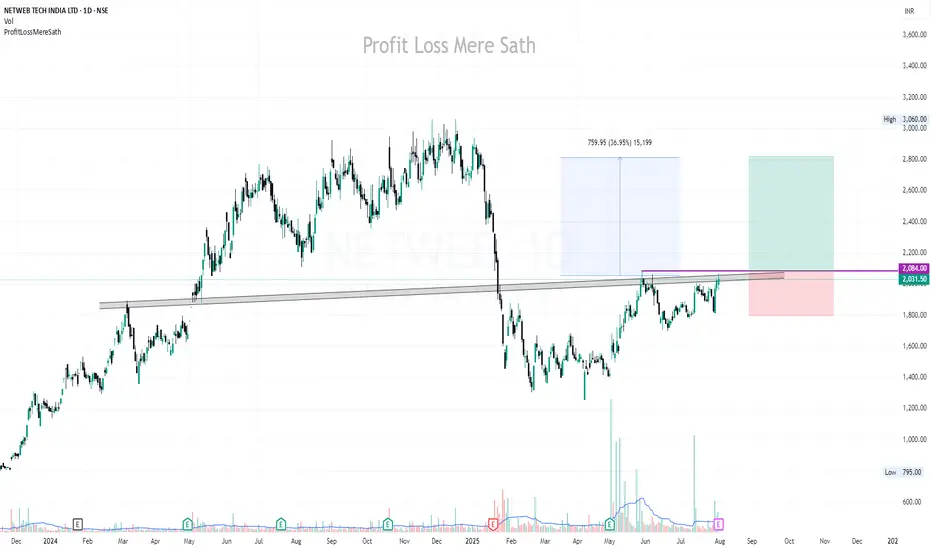
NETWEB | Buy above 2085 | Strict SL below 1800 | Target 2830Disclaimer:
This is not financial advice. Please do your own research or consult with a financial advisor before making any investment decisions. Investments in stocks can be risky and may result in loss of capital.
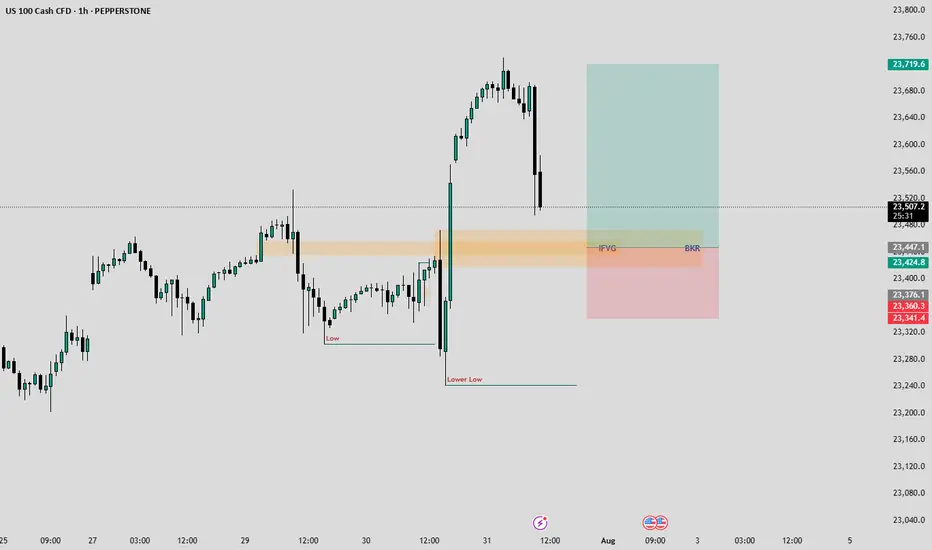
NASDAQ-Lets catch 250 Points togetherHello Fellow Traders,
Nasdaq has been wild since a time now. Today, I have spotted a rade to share with my fellow traders.
Yesterday closed with a good bullish candle. As the NY seesion has begun now, I am anticipating price to retrace to the highlighted breaker block that accurately aligns with an IFVG as well.
I am waiting for the price to fall into my area where I will monitor price's reaction, if we see signs of ejection from the highlighted areas, I wuld love to take a Buy Trade.
Entry= If rice enters the Breaker and IFVG and shows a good rejection.
SL= 23340
TP= Today's highs or 23700.
Manage your risk according toyour capital and only enter the trade if we happen to see a good rejection from the area. Be patient and don't hurry.
BNB Structural Analysis – Decision Zone & Bullish Setup Ahead!💎🚀 BNB Structural Analysis – Decision Zone & Bullish Setup Ahead! 🔥♦️
🔍 Dow Theory + Index Review + Market Structure Breakdown
✅ Like 💥 Follow 💬 Comment to keep this content coming daily!
👋 Hey traders! Welcome to our daily crypto routine:
📅 Every Day:
🔹 BTC + ETH technical updates
🔹 Full market structure review (TOTAL, BTC.D, USDT.D…)
📅 Every Sunday:
🔸 Weekly analysis of the Top 10 Altcoins (excluding BTC & ETH)
💎 Analysis method:
🧠 Dow Theory
📈 HWC Cycle – 1D timeframe
📉 MWC Cycle – 4H
🕐 LWC Cycle – 1H
📊 Index tracking: TOTAL / TOTAL2 / TOTAL3 / BTC.D / USDT.D
🔥 🧠 STRUCTURAL INSIGHTS – BNB, Market Context, and Trigger Points
♦️ Indexes Status
🔸 BTC.D – ⚠️ If 60.44 breaks down → bullish for altcoins. So far, the 62–62.36 zone has held as resistance – 🟢 still favorable for alts.
🔸 USDT.D – Currently trying to break 4.40, but hasn’t succeeded yet. This keeps the bullish bias intact.
💡 Before 4.13 breaks upward, we should already have open long positions.
🔸 TOTAL3 – Testing previous bottom – forming a potential double bottom.
💎 Breakout above 1.08T = 🟢 confirmation of a new altcoin wave, which could also support BNB’s rally
.
♦️ BTC Context – The Key to Altcoin Momentum
🟡 Still ranging between 115K–120K
🚀 Breakout above 120K could unleash strong rallies across alts – especially BNB.
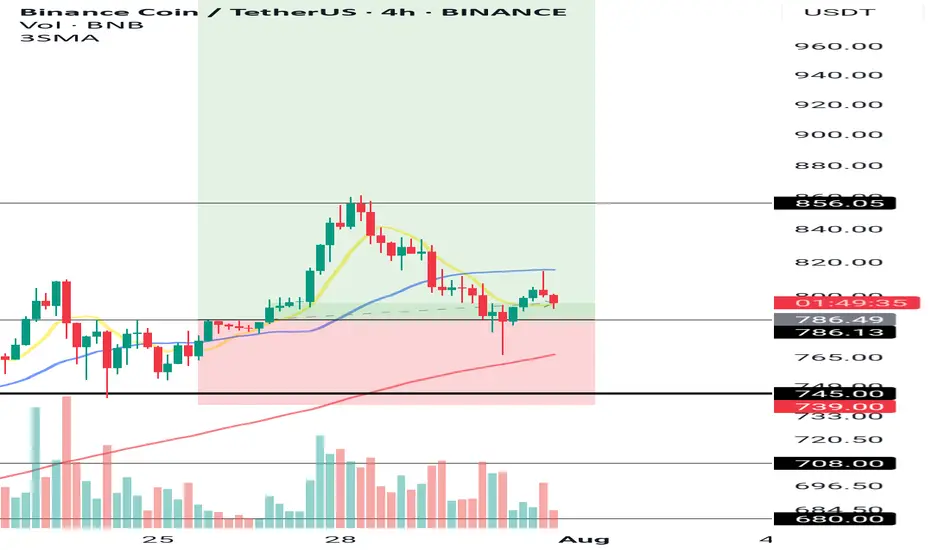
♦️ BNB/USDT Analysis – 4H Bullish, But Decision Time Is Near!
🔹 Trend:
✅ In the 4H timeframe, structure remains bullish – higher highs and higher lows still intact.
🔻 However, the latest price action has seen a deep correction from the 856 high, pushing price back into the daily support zone (745–786) = 📍 Decision Zone.
🛑 739 = key level. If it breaks, the 4H Dow structure breaks too.
💎 Key Levels to Watch:
• 🔼 Daily Resistance: 856.05
• 🔽 Key Daily Support: 745
• 🔽 Important 4H Support: 786.13
💎 Current Position Outlook:
✅ Entry at 786 = still valid and technically sound
✅ Stop-loss below 739 = protects the Dow structure
🎯 Targets: First 900, then 1000 – with potential for more if 1000 breaks
⚠️ Alternate Entry Trigger (Safe Setup):
🚀 If you missed the 786 entry:
📍 Wait for a break of previous 4H candle high (~805) WITH volume confirmation
🎯 Targets: 856 → 900 → 1000
🔁 Summary:
🟡 As long as the market holds above 739 and BTC doesn’t break down, this is a high-probability bullish setup
🔥 Break above 805 = a strong momentum trigger
📌 We stay bullish while respecting structure and volume
🚀 Smash that ROCKET if this analysis helped!
💬 Drop your thoughts in the comments
👍 Like & 🔔 Follow for daily updates and altcoin strategies
Berkshire Hathaway looks appealing in todays market conditionsWith most markets at all time highs it is becoming increasingly difficult to find good opportunities for buying. I have decided to allocate about 9% of my portfolio to Berkshire Hathaway as a sort of hedge against some of my other positions. I like to have a diverse exposure to the markets and with Berkshire Hathaway being a conglomerate it is a perfect stock for someone like me to invest in. The stock seems to be doing the opposite of the us500 so far this year hence why I call it a hedge. According to my simple technical analysis there is a probability for the stock to make a reversal after spending some time going down.
The company has already donated plenty of shares which probably has something to do with it going down, which presents a unique opportunity to invest in it since there is nothing fundamentally wrong with the company. With that being said they have also said they probably wont engage in share buy backs until next year at least so it could be a falling knife type situation. However I am confident in the company and feel like it is a great stock to have in my portfolio for the long term.
The range of the intrinsic value according to the discounted cash flow model is between $400-$1000 with a 5 year exit. Assuming a 7.4% discount rate the intrinsic valuation for the stock is $575 presenting a unique opportunity for a 20% upside. The stock is certainly undervalued but like I said it could be a falling knife in the worst case scenario. Calculating the intrinsic value is highly speculative and complex, but it gives me increased confidence in my decision to push the buy button. I hope you found my analysis useful, drop a comment if you want to talk more about the stock or whatever.

Ethereum's futile attempt to go up.Ethereum’s pointless push and unnecessary insistence on going up — if it really wants to hit a new ATH, it needs to drop first, both to take a breather and to let buyers with lower buy orders get into the game.
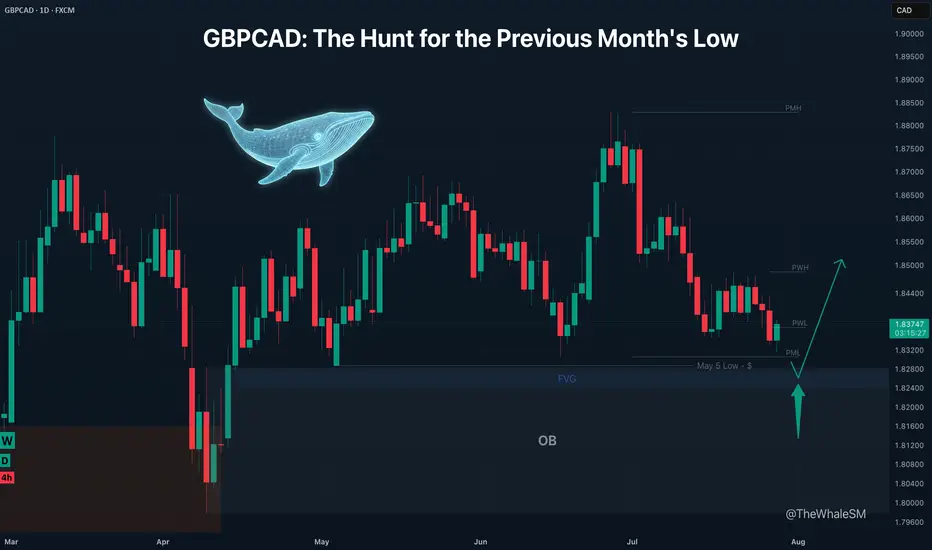
GBPCAD: The Hunt for the Previous Month's LowLike a predator stalking its prey, the market often moves with a clear objective. For GBPCAD, the primary target is now the massive pool of liquidity resting below the Previous Month's Low. This isn't a random drop; it's a calculated hunt. This analysis lays out the plan to join the reversal after the hunt is complete.
The price of GBPCAD is approaching a large pool of liquidity in the form of the Previous Month's Low (PML) , with the May 5th low located just below it. There is a high probability that this liquidity will be swept in the near future, because with only a few days left until the end of the month, the PML will no longer act as such a strong magnet for the price as it does now.
The capture of this liquidity would be accompanied by the mitigation of a daily order block in conjunction with a daily FVG . This confluence of factors could act as strong support for a potential price bounce, with a minimum target of a liquidity sweep of the Previous Week's High (PWH) .
SETUP CONDITIONS
The condition for the long setup to form would be a sharp downside liquidity sweep with a candle wick, which mitigates the upper part of the daily order block, followed by the start of a bullish order flow on a lower timeframe .
► Invalidation: Invalidation of the long scenario would be a daily candle body closing below the May 5th low, or a sharp drop to the middle of the daily order block.
~~~~~~~~~~~~~~~~~~~~~~~~~~~~~~~~~~~~~~~~~~~~~~~~~~~~~~~~~~~~~~~~~
The principles and conditions for forming the manipulation zones I show in this trade idea are detailed in my educational publication, which was chosen by TradingView for the "Editor's Picks" category and received a huge amount of positive feedback from this insightful trading community. To better understand the logic I've used here and the general principles of price movement in most markets from the perspective of institutional capital, I highly recommend checking out this guide if you haven't already. 👇
P.S. This is not a prediction of the exact price direction. It is a description of high-probability setup that become valid only if specific conditions are met when the price reaches the marked POI. If the conditions are not met, the setup are invalid. No setup has a 100% success rate, so if you decide to use this trade idea, always apply a stop-loss and proper risk management. Trade smart.
~~~~~~~~~~~~~~~~~~~~~~~~~~~~~~~~~~~~~~~~~~~~~~~~~~~~~~~~~~~~~~~~~
If you found this analysis helpful, support it with a Boost! 🚀
Have a question or your own view on this idea? Share it in the comments. 💬
► Follow me on TradingView to get real-time updates on THIS idea (entry, targets & live trade management) and not to miss my next detailed breakdown.
~~~~~~~~~~~~~~~~~~~~~~~~~~~~~~~~~~~~~~~~~~~~~~~~~~~~~~~~~~~~~~~~~
Xrp - This is the bullrun breakout!🔑Xrp ( CRYPTO:XRPUSD ) breaks the triangle now:
🔎Analysis summary:
After the recent bullish break and retest, Xrp managed to already rally another +100%. This is a clear indication that bulls are still totally in control of cryptos and especially Xrp. It all just comes down to the all time breakout, which will then lead to a final parabolic rally.
📝Levels to watch:
$3.0
SwingTraderPhil
SwingTrading.Simplified. | Investing.Simplified. | #LONGTERMVISION

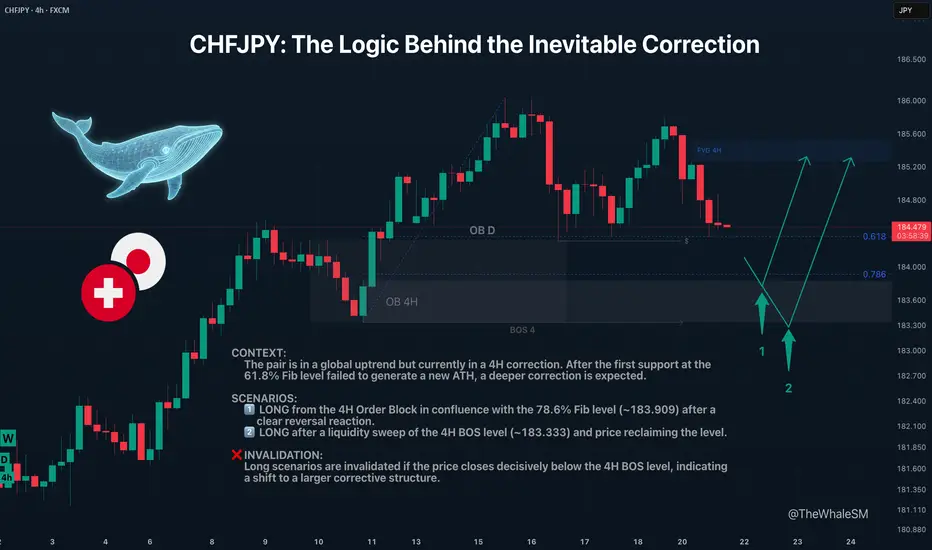
CHFJPY: The Logic Behind the Inevitable CorrectionCHFJPY recently bounced from what seemed like a perfect support level. Many likely saw this as a buy signal. But when the price failed to make a new high, it sent a clear warning: the correction isn't over yet.
This analysis dives into why that first bounce was a trap and where the next institutional levels are waiting below—the ones with the real fuel for the next major move up.
The CHFJPY pair continues its long and strong global uptrend . However, the market cannot move in one direction indefinitely without pullbacks; sooner or later, corrections occur. Large capital, or "Whales," who are the most important market participants, need to refuel with liquidity to continue their advance and to shake off piggybacking competitors. Right now, CHFJPY is in a 4H structure correction .
The first target for this correction was the 61.8% Fib level and a daily order block. The price did show a reversal reaction from them, but it lacked enough liquidity to create a new ATH, and the price continued its corrective movement. The next target for the correction will be the 78.6% Fibonacci retracement level at ~183.909, in conjunction with a 4H order block . This move will also sweep liquidity from the low of July 16th.
Two Potential Long Scenarios
SCENARIO 1: Entry from the 78.6% Fib Level & 4H Order Block
The first long entry scenario will be triggered by a clear reversal reaction from this support confluence.
► Setup Condition: Price must reach this zone, mitigate the order block, and close decisively above the 78.6% level, showing strength. An entry will require LTF confirmation (a BOS or the beginning of LTF order flow).
► Invalidation: If the 78.6% level is broken and the price closes below it, this scenario is invalid. In this case, the 4H order block itself will act as liquidity, and an attack on the 4H structure's break level (BOS 4) will likely occur.
SCENARIO 2: Entry After a Deeper Liquidity Sweep
This path becomes active if the first scenario fails.
► Setup Condition: A liquidity sweep with a candle wick below the 4H BOS level (183.333), with the price then closing back above this level. The final confirmation would be the start of a new order flow on a lower timeframe.
► Invalidation: A decisive close below the 4H BOS level will invalidate all long scenarios and will signal that the correction is shifting to a higher timeframe structure.
~~~~~~~~~~~~~~~~~~~~~~~~~~~~~~~~~~~~~~~~~~~~~~~~~~~~~~~~~~~~~~~~~
The principles and conditions for forming the manipulation zones I show in this trade idea are detailed in my educational publication, which was chosen by TradingView for the "Editor's Picks" category and received a huge amount of positive feedback from this wonderful, advanced TV community. To better understand the logic I've used here and the general principles of price movement in most markets from the perspective of institutional capital, I highly recommend checking out this guide if you haven't already. 👇
P.S. This is not a prediction of the exact price direction. It is a description of high-probability setups that become valid only if specific conditions are met when the price reaches the marked POI. If the conditions are not met, the setups are invalid. No setup has a 100% success rate, so if you decide to use this trade idea, always use a stop-loss and proper risk management. Trade smart.
~~~~~~~~~~~~~~~~~~~~~~~~~~~~~~~~~~~~~~~~~~~~~~~~~~~~~~~~~~~~~~~~~
If you found this analysis helpful, support it with a Boost! 🚀
Have a question or your own view on this idea? Share it in the comments. 💬
► Follow me on TradingView to get real-time updates on THIS idea (entry, targets & live trade management) and not to miss my next detailed breakdown.
~~~~~~~~~~~~~~~~~~~~~~~~~~~~~~~~~~~~~~~~~~~~~~~~~~~~~~~~~~~~~~~~~
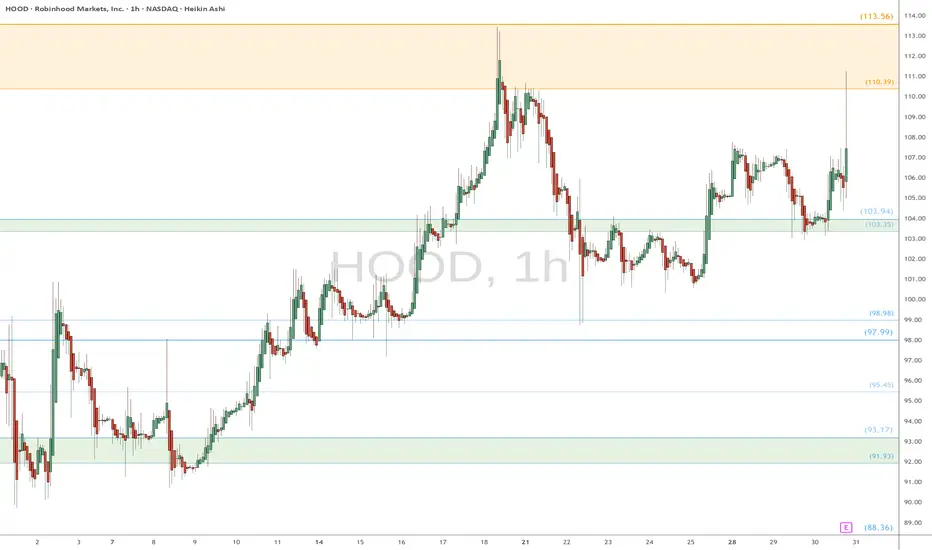
HOOD watch $110 then $113: Dual Golden fibs trying to TOP itHOOD has been a massive bull run since April lows.
Now battling a dual Golden fib zone $110.39-113.56.
Top of the zone is a well proven Golden Genesis fib.
See "Related Publications" for previous charts ------->>>>>>>
Such as this PERFECT catch of a serious bounce:
Hit BOOST and FOLLOW for more such PRECISE and TIMELY charts.
=========================================================
.
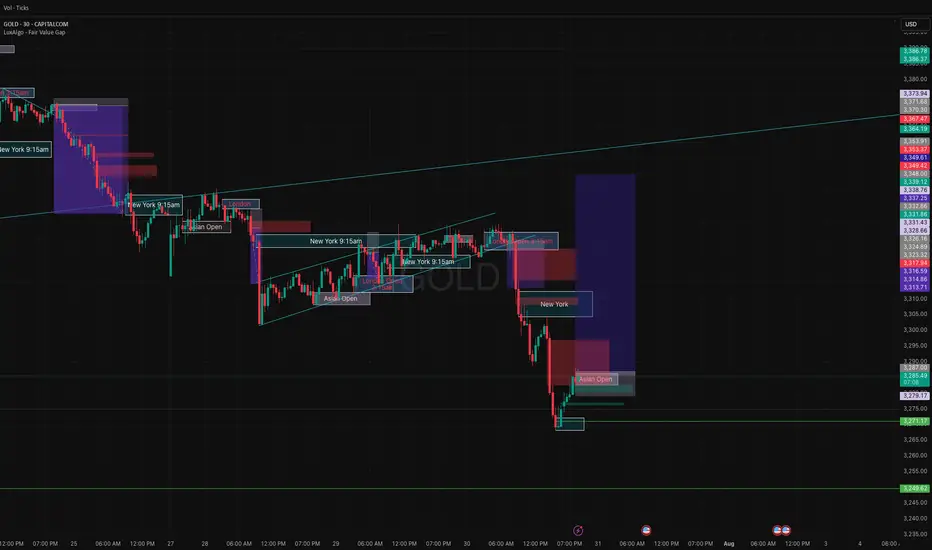
Gold OutlookI think Gold is about to do a minor recovery Pump , after days of Red, maybe we are about to see some relief green, this is my very first long trade
#LEVER/USDT#LEVER
The price is moving within an ascending channel on the 1-hour frame, adhering well to it, and is poised to break it strongly upwards and retest it.
We have support from the lower boundary of the ascending channel, at 0.0001664.
We have a downtrend on the RSI indicator that is about to break and retest, supporting the upward trend.
There is a key support area (in green) at 0.0001673, which represents a strong basis for the upward trend.
Don't forget one simple thing: ease and capital.
When you reach the first target, save some money and then change your stop-loss order to an entry order.
For inquiries, please leave a comment.
We have a trend of stability above the Moving Average 100.
Entry price: 0.0001757
First target: 0.0001870
Second target: 0.0001937
Third target: 0.0002017
Don't forget one simple thing: ease and capital.
When you reach the first target, save some money and then change your stop-loss order to an entry order.
For inquiries, please leave a comment.
Thank you.

Crypto market review: Bitcoin, ETH, and Altcoins Setting Up for Prepared a new in-depth crypto market video update covering BTC, Ethereum, and key altcoins. Here’s a quick summary of the current landscape and what I’m tracking in the charts:
We’ll begin with Bitcoin. After the Fed’s decision, BTC showed a constructive shakeout and has been consolidating tightly around the same range for three weeks. I previously anticipated resistance near the 1.23 area and expected a sideways phase within the 1.15–1.13 support zone. That’s exactly what we’re seeing—shakeouts and quick recoveries. As long as we stay above 1.13 structurally, and especially above yesterday’s highs short-term, I expect BTC to push higher toward the 1.26–1.30 resistance zone.
Institutional buying during the post-Fed dip has been significant. Volume on Coinbase and Binance indicates strong participation, and Bitcoin treasuries have been accumulating. This bolsters confidence in the underlying trend structure.
I wrote in mid-July about BTC’s broader macro structure—this resistance region may trigger a prolonged consolidation, but ideally without breaking June lows. Short-term bias remains bullish.
Ethereum remains the strongest large-cap altcoin. It has respected the 8EMA on pullbacks and shows strength to target 4300–5100 in the coming weeks. It continues to lead risk-on sentiment.
XRP has been deep in consolidation, but we may be seeing a higher low forming. Any rally in BTC and ETH could lift XRP toward 3.30–4.60 levels, possibly even 5.00.
Solana showed strong action through late July, pulling back into mid-term support. As long as this structure holds, I expect upside toward 220–230 and potentially reclaiming ATH zones.
Hyperliquid has been a laggard but held its key macro support. If yesterday marked a bottom, I’ll be watching for higher lows and a move toward 55–60.
Other notable setups:
Brett: Both showing impulsive structures from April lows. Brett in particular looks poised for 74–77, potentially retesting May highs around 95.
ONDO: Recovering key zones and shaping a potential bottoming pattern.
SUI: Leading structure from July lows. After a likely wave-one completion, it could extend toward 5.15–7.70 before topping.
RENDER: Looks to have finished its correction. Potential long-term upside beyond May highs; the macro uptrend might already be underway.
SUPER: Since July breakout, forming a strong trend structure. If it holds the higher low, could reach 1.20–1.46 in coming weeks.
TON: Slow mover, but the macro pattern suggests a bottom with potential toward 4.60 short-term.
LINK: Hasn’t finished its move. Watching for 21–22 as a next target.
FET / Fetch.AI: Macro structure looks great. Watching for recovery from June lows with potential for strong continuation if structure holds.
Trump Coin: In a diagonal pattern post-failed impulsive breakout. If higher lows hold, watch for rally toward 13–14.
LTC: Linear and clean structure. Looks ready to push toward 130–145 before potential base-building.
UNI: Targeting 14–18+ in wave continuation if structure holds.
Let me know in the comments if there’s a specific coin you’d like me to go over. I’ll include it in future updates or make a quick standalone video.
Thanks for watching, and I wish you a successful trading week ahead. Let’s see how far this rally can go through the rest of the summer!

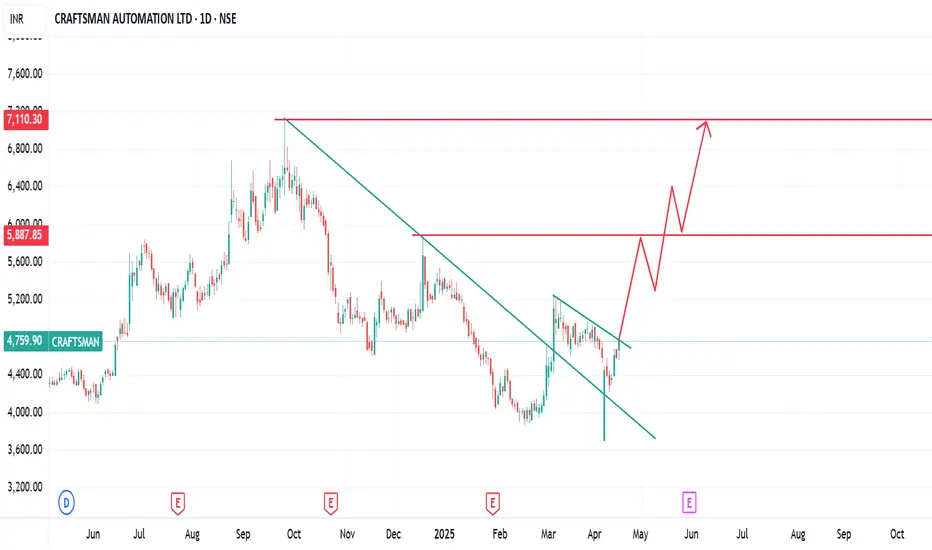
craftsman automation a good company with good technical chart craftsman automation showing stability after downfall company doing well fundamentally and technical chart also looks good
sector is one of my favorite.
a monopoly sector and can perform good in upcoming time
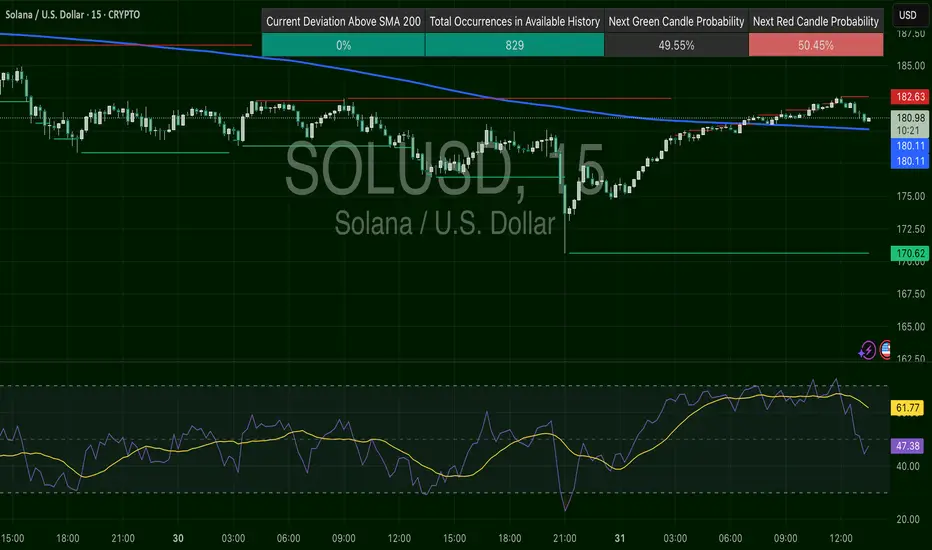
SOLUSD – Faded Highs, Now RetestingSOL recovered off the $170–172 lows and is now testing $182.63 resistance. RSI was high and now cooling off (~47), suggesting momentum is slowing. Still trading just over the 200 SMA, this is a breakout pullback zone. $180.13 is the key level to stay above.
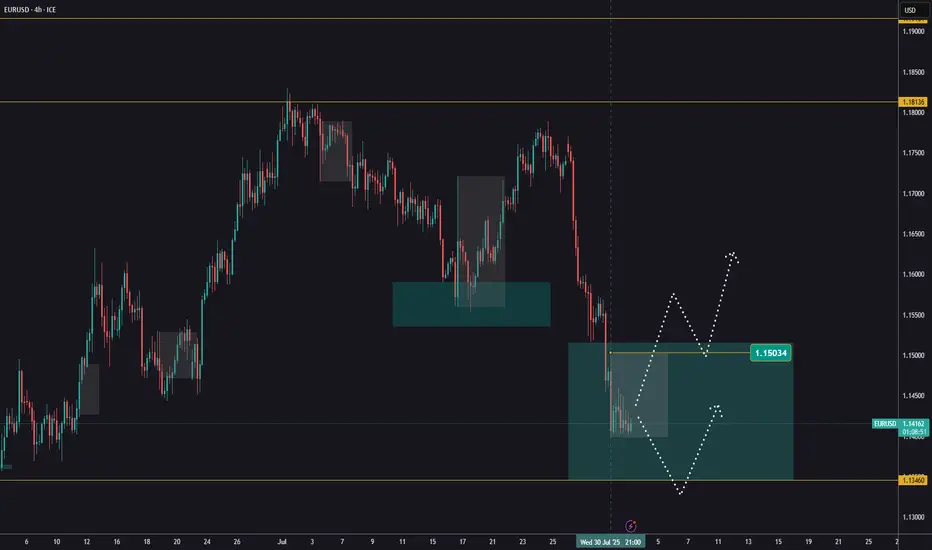
EURUSD ahead of NFPEURUSD is still trading within the range established after Wednesday’s news.
We’re watching for a close above 1,1503, which would confirm a potential buying opportunity.
Today at 1:30 PM (London), the NFP data will be released, which could further impact price action - especially if a reversal is underway.
In case of a decline, the next key support level to watch is around 1,1346.
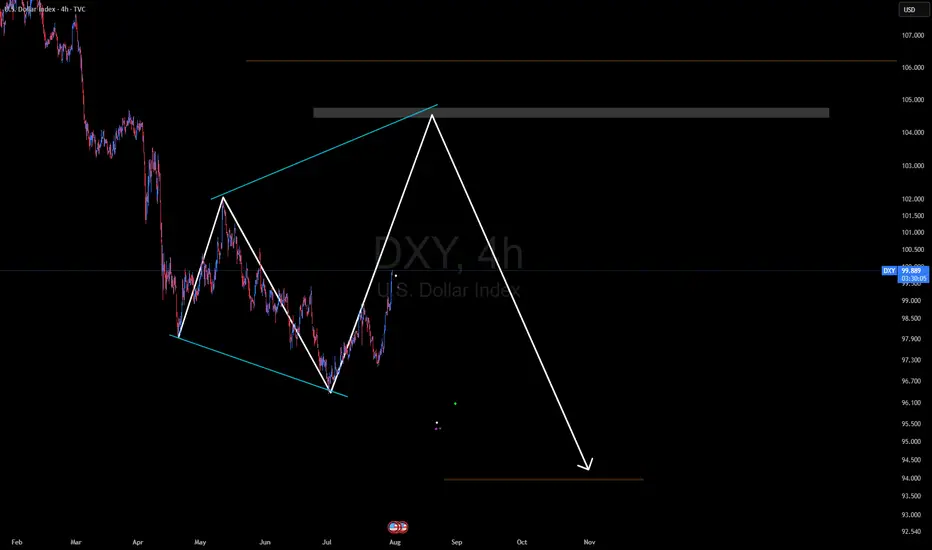
DXY bullish trend The market reaction indicates that the economy remains very strong, and there is no immediate need for the Fed or any central bank action. Powell emphasized that any potential rate cuts will depend on the upcoming data, especially the August reports. As a result, the DXY is expected to remain strong and could rise towards the 104.00–106.00 levels. A potential bearish reversal in the DXY would only be likely if there is significant economic deterioration or a clear shift in Fed policy expectations.
Full review of my NY basket and trading ideas for todayFull analysis and trading ideas for todays NY session for DXY, Silver, Gold, WTI, NAS, S&P, DJ30

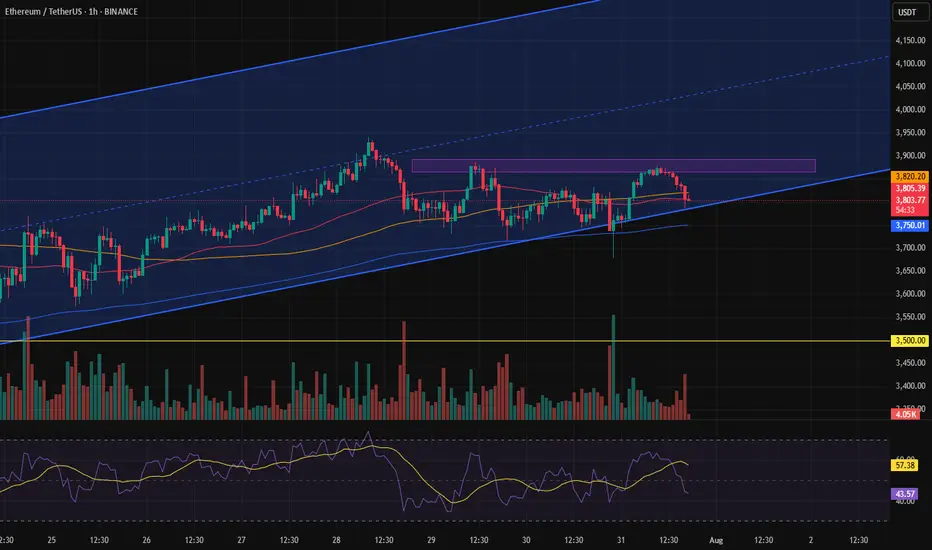
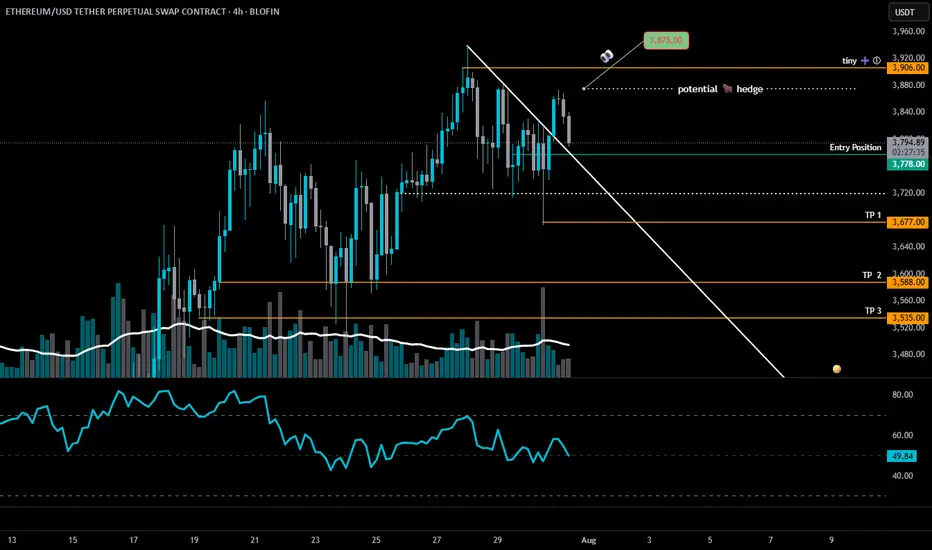
ETH is at a critical inflection pointETH 4H – Decision Time 🧠🐂🐻
Ethereum’s dancing on the edge of a blade.
📍 Entry: $3,778 (Short)
🧪 Next Add: Tiny at $3,906 (updated)
🚨 Major Add: Above $4,100 (TBD)
⚠️TP 1: $3,677 (updated)
We’ve broken the downtrend line — bullish on paper — but ETH is stalling right near resistance at $3,875. If bulls don’t show up with volume and conviction, this move fizzles out fast.
Here’s the playbook:
🔸 $3,875 = key battle zone
— Reclaim it clean (4H close + volume) = "short-term" bear bias invalid (◘reread◘)
— Failure = likely drop to $3,677 → $3,588
🔸 $3,720 = swing short confirmation if broken
🧩 If bulls win $3,875, I keep the short but hedge with a long. Because if the herd’s charging uphill, they might lead us to gra$$.
Momentum is king. No follow-through = fakeout top.
Let the chart breathe.
LOW LEVERAGE POR FAVOR!
Stay Sharp. Stay nimble. 🎯
100% not financial advice, for edutainment purposes only!
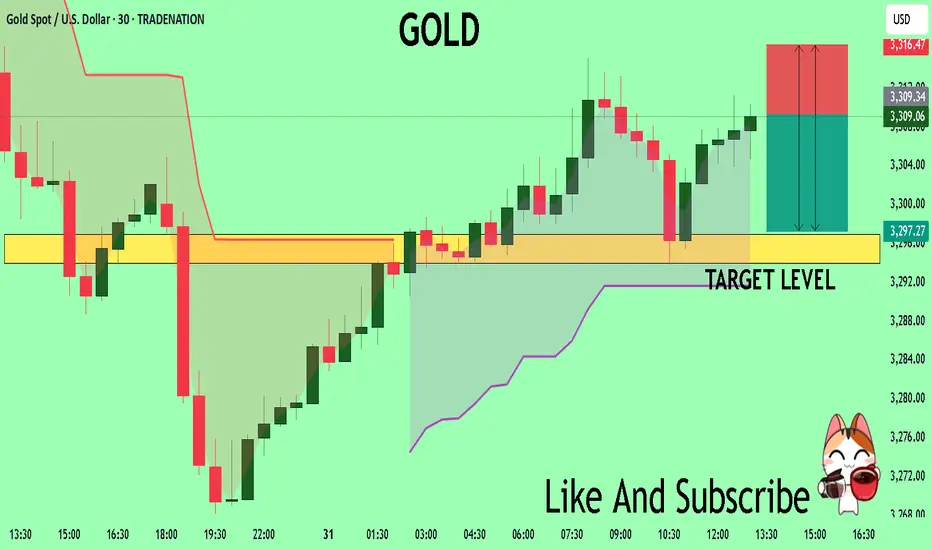
GOLD Buyers In Panic! SELL!
My dear friends,
Please, find my technical outlook for GOLD below:
The instrument tests an important psychological level 3309.2
Technical Indicators: Supper Trend gives a precise Bearish signal, while Pivot Point HL predicts price changes and potential reversals in the market.
Target - 3296.9
Recommended Stop Loss - 3316.4
About Used Indicators:
Super-trend indicator is more useful in trending markets where there are clear uptrends and downtrends in price.
Disclosure: I am part of Trade Nation's Influencer program and receive a monthly fee for using their TradingView charts in my analysis.
———————————
WISH YOU ALL LUCK

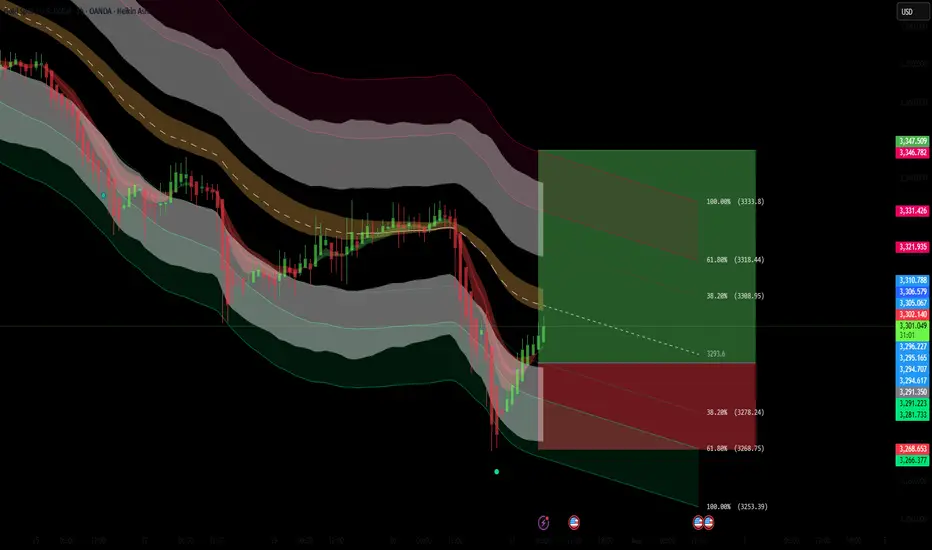
XAUUSD Long Setup – 1HGold (XAUUSD) has shown strong bullish rejection from the lower volatility band after a sharp selloff. The appearance of a Heikin Ashi reversal candle, suggests a short-term reversal is forming. Price has reclaimed key structure and is now targeting a reversion back to the mean, supported by Fibonacci retracement levels.
Entry: 3293.55
Target Zone: 3308.91 → 3333.76 (Fib 38.2% – 100%)
Stop Loss: 3253.35
Confluences:
✅ Bullish engulfing + Heikin Ashi trend shift
✅ Oversold bounce from lower channel extremity
✅ Fib retracement aligns with key structural resistance zones
✅ Custom signal confirmation (green dot)
✅ Clean R:R toward upper band and previous POI
Short-term counter-trend long targeting liquidity grab and mean reversion toward the 3308–3333 zone. Risk tightly managed with SL below local swing low.
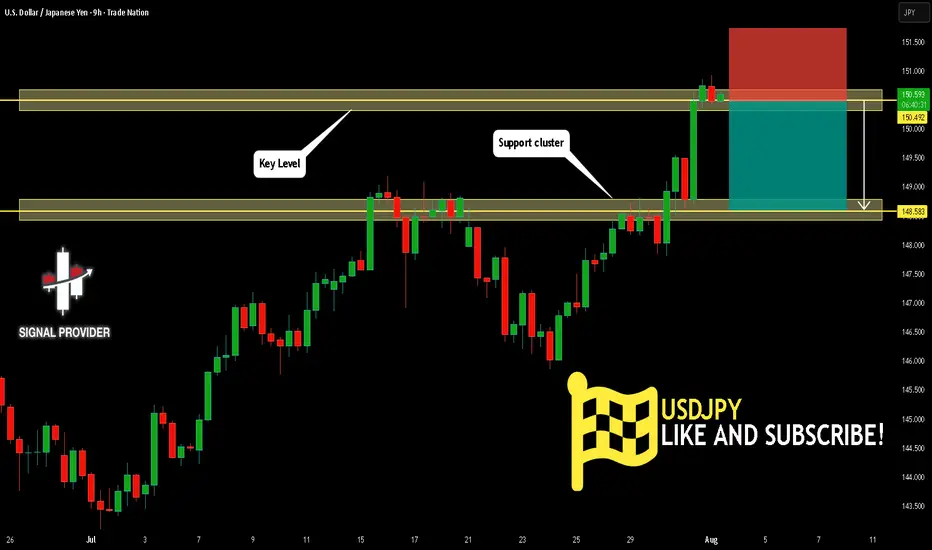
USDJPY Is Very Bearish! Sell!
Here is our detailed technical review for USDJPY.
Time Frame: 9h
Current Trend: Bearish
Sentiment: Overbought (based on 7-period RSI)
Forecast: Bearish
The market is on a crucial zone of supply 150.492.
The above-mentioned technicals clearly indicate the dominance of sellers on the market. I recommend shorting the instrument, aiming at 148.583 level.
P.S
We determine oversold/overbought condition with RSI indicator.
When it drops below 30 - the market is considered to be oversold.
When it bounces above 70 - the market is considered to be overbought.
Disclosure: I am part of Trade Nation's Influencer program and receive a monthly fee for using their TradingView charts in my analysis.
Like and subscribe and comment my ideas if you enjoy them!