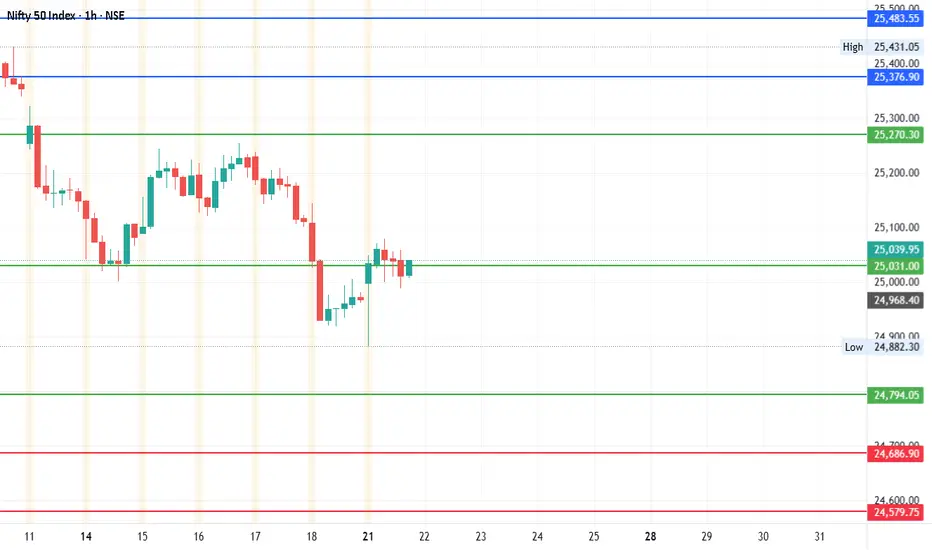
#Nifty - Pivot Point: 25031.63Date: 18-07-2025
#Nifty Current Price: 25025
Pivot Point: 25031.63 Support: 24794.06 Resistance: 25270.32
#NiftyUpside Targets:
Target 1: 25376.92
Target 2: 25483.53
Target 3: 25652.99
Target 4: 25822.45
#NiftyDownside Targets:
Target 1: 24686.89
Target 2: 24579.73
Target 3: 24410.26
Target 4: 24240.80
#TradingView #Stocks #Equities #StockMarket #Investing #Trading #Nifty
#TechnicalAnalysis #StockCharts #Finance
Community ideas
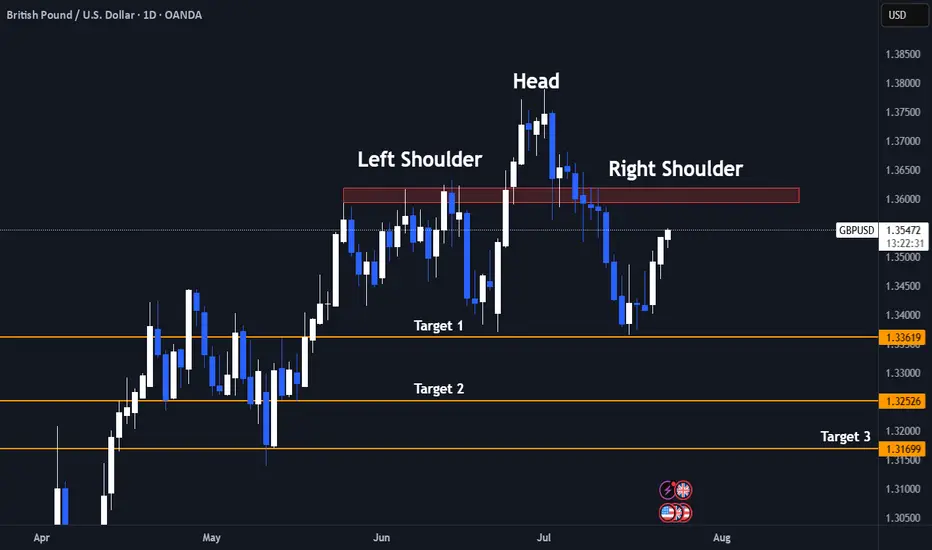
Bull Trap Confirmed: GBPUSD's 8% Rally Faces ExhaustionLets Face it we had a great 6 months already clocking 60%+ Returns already.
And after sitting ducks for almost 2 months now we finally have a trade.
- Its a very self explanatory chart
- Trading at resistance
- Head & Shoulder pattern
And the best part the right shoulder is still yet to be formed! My favourite type of entry.
1.It gives a better risk reward ratio (1:7 expected)
2.Better Entry (No long red candles)
3. And even if the pattern fails it we may still reach the neck line which is target 1.
Entry Criteria
- A Red candle at the entry Line Marked
- Stoploss Above the Entry Candle
Target 1- 1.3361
Target 2- 1.3252
Target 3- 1.3169
Keep Your Risk Reward Intact! Not An investment Advice
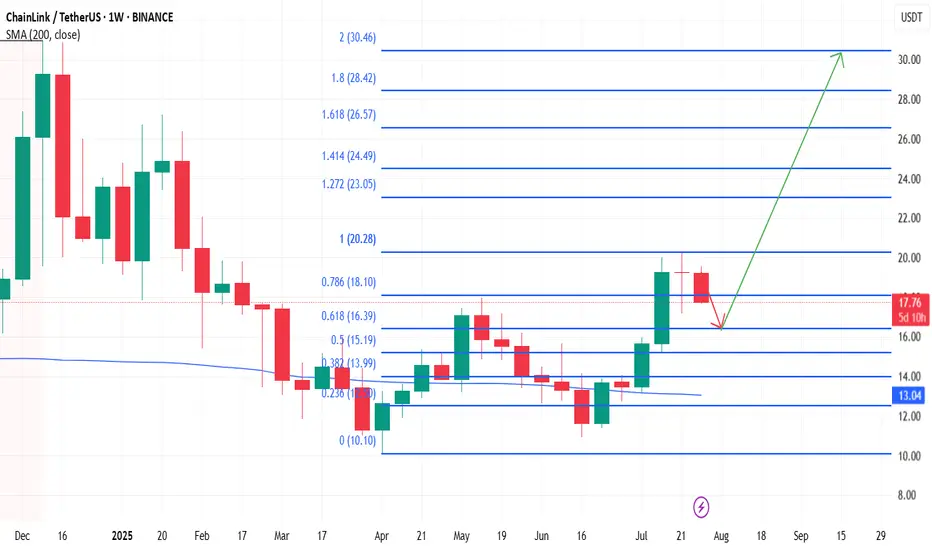
Link targeting 30$In my view after a deeper retracement to 0.618 fibonacci level , about 16.3$, Link bullish trend will resume to target 30.4$
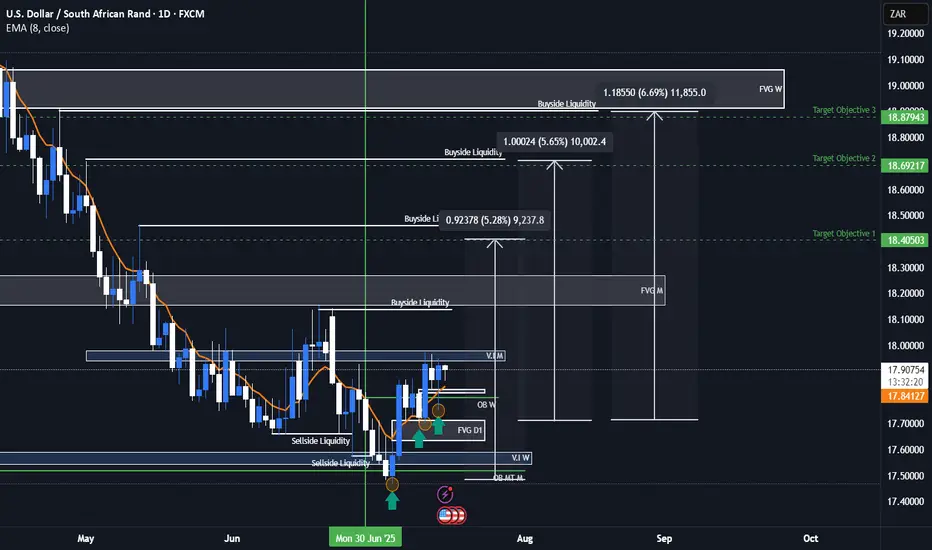
USDZAR Bullish ideaAs we can see this is our USDZAR quarterly shift idea were we are anticipating price to rally to the upside toward our draw on liquidity objectives. We had a weekly volume imbalance and monthly mean threshold order block show us support after we took out major liquidity points. We also showed more support on our daily FVG and a market shift taking place after a displacement. We are anticipating a rally for USDZAR and will be looking to see how price plays out.
USDZAR is an exotic pair that is part of the emerging markets and emerging markets/exotic pairs can usually lead ahead of major forex pair or lag between major forex pairs so this can also help us with our intermarket analysis of forex pairs when determining our dollar strength against other basket currencies.
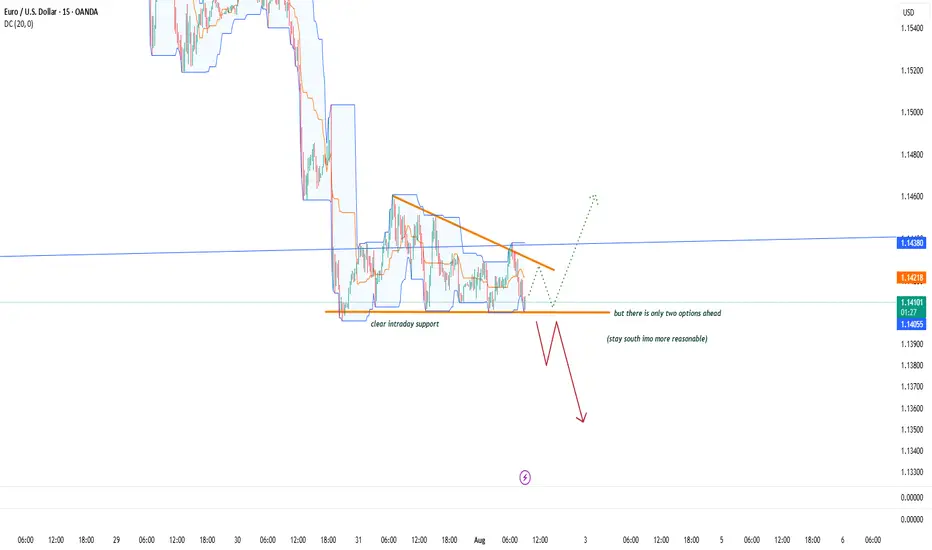
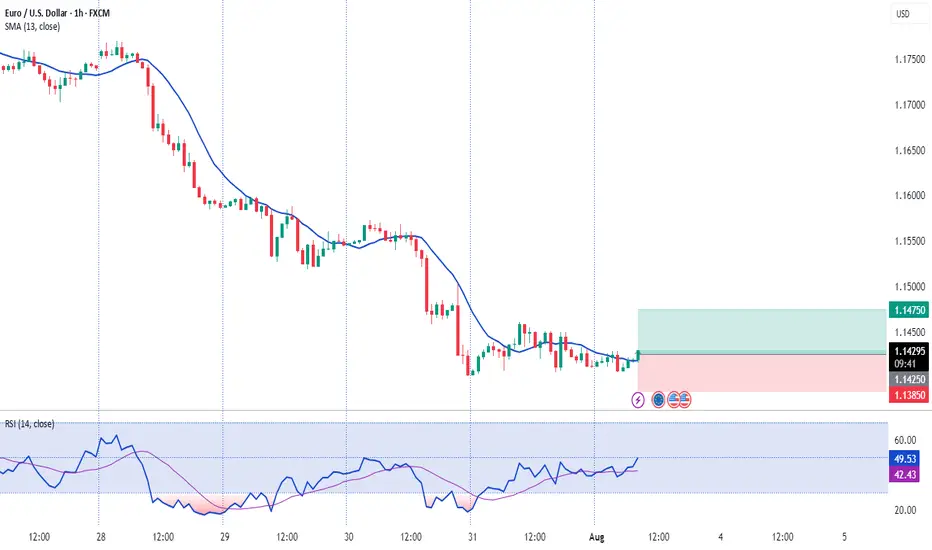
EURUSD First of August The information and publications are not meant to be, and do not constitute, financial, investment, trading, or other types of advice or recommendations.
Have a nice w/e ahead.
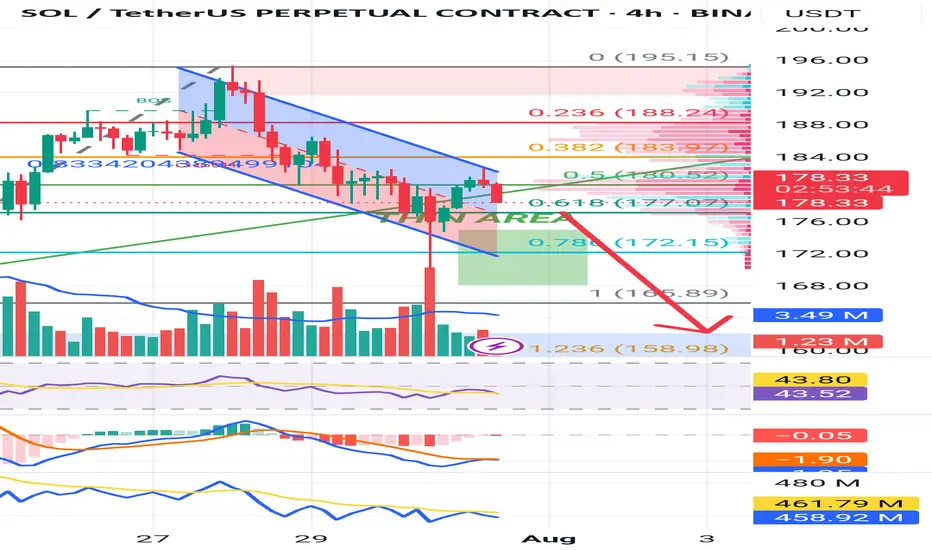
Break down before the run upSo i feel this will go to the 4 hr OB. My reasoning is there's very little buy volume, the OBV is very low even though the price climbed a bit, and the RSI is below 50 still, so still bearish imo. But the market has its own ideas so be wary and watch closely. Make money my friends!
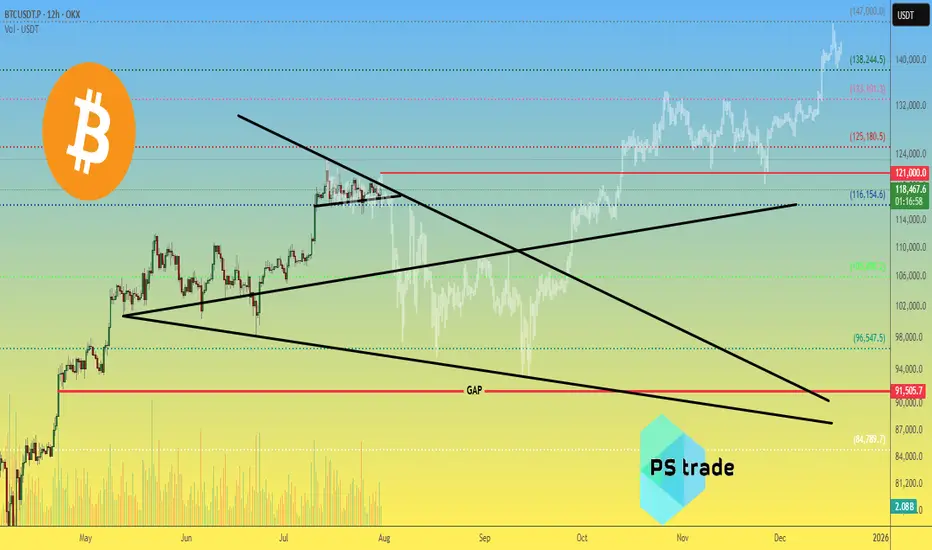
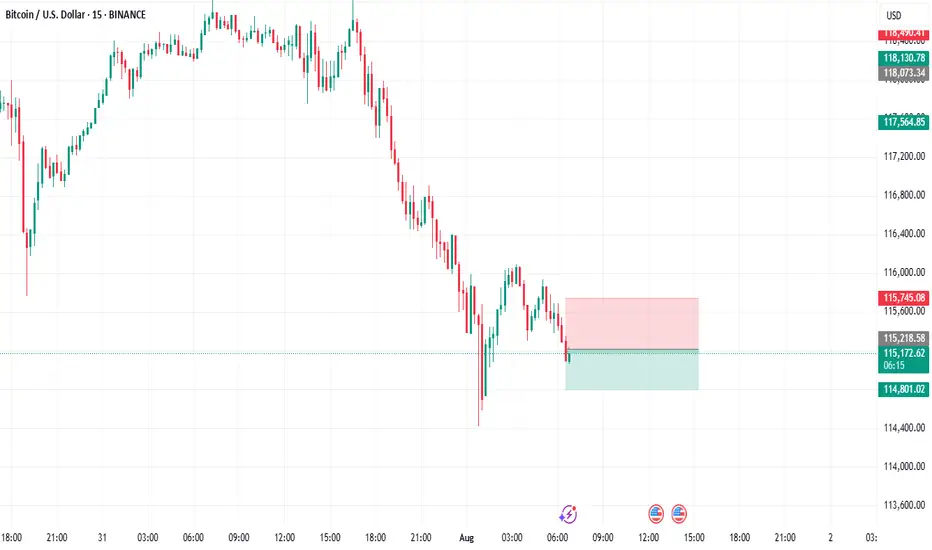
Bitcoin BTC price analysis by the end of 2025🕯 July is coming to an end, with 3 weeks of OKX:BTCUSDT consolidation between $117k–121k.
Tomorrow begins the last month of summer — and it promises to be "hot" as, according to our earlier published calendar Trump's administration plans to send letters with new, increased tariffs to "all countries" on 01.08.
💰 Also, take a look at Bitcoin Monthly Returns. In our view, 2025 resembles 2020 the most.
What do you think?
👉 According to this dynamic, the real "hot" may come not in summer, but late autumn.
💰 We've also tried to find a price fractal for #BTCUSD that fits the current structure — and for now, it looks plausible:
◆ In the coming days, CRYPTOCAP:BTC should not rise above $121k.
◆ A low of correction might hit mid-September around $93k.
◆ A cycle top for #BTC could arrive to the end of 2025, near $147k.
📄 Now that you've seen our version — share your forecasts on future #BTCUSDC price action in the comments 👇
XAUUSD – Downtrend Confirmed, Bears in ControlOn the H4 timeframe, gold has completely broken its short-term uptrend structure and formed a series of lower highs and lower lows. Every bounce is rejected at the strong resistance zone of 3,326 – 3,333 USD, confirming the clear downtrend.
Although the recently released Core PCE index was lower than expected, this is not enough to drive a recovery as other data, such as the Employment Cost Index and statements from the Fed, still show persistent inflationary pressure. Therefore, the monetary policy remains hawkish, causing money to flow out of gold.
Currently, the price is approaching the critical support zone of 3,247. If this level is broken, the scenario of further declines to 3,192 is entirely possible.

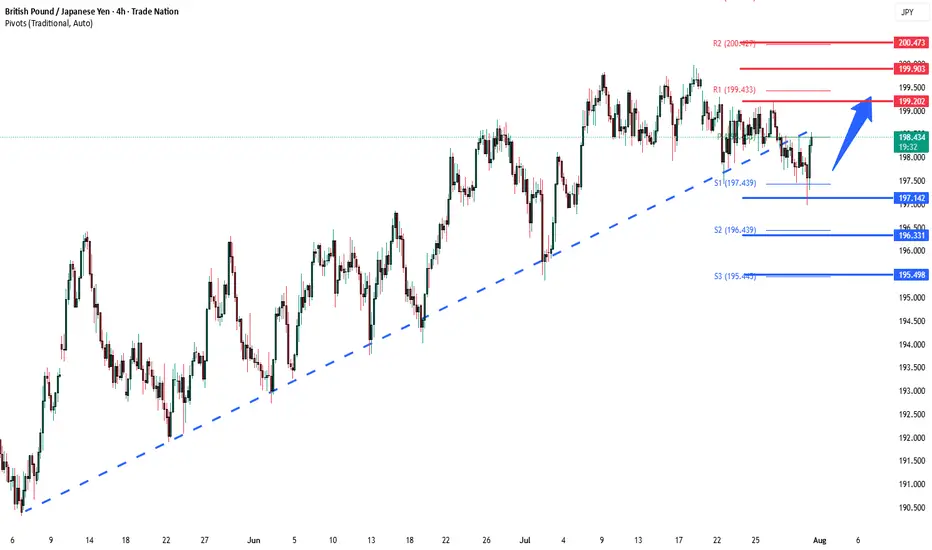
GBPJPY key support at 197.75Key Support: 196.75
This level marks the prior consolidation zone and serves as a critical pivot. A corrective pullback toward 196.75 followed by a bullish reversal would validate the uptrend, with upside targets at:
199.20 – Initial resistance and short-term target
199.70 – Minor resistance zone
200.40 – Longer-term breakout objective
However, a daily close below 196.75 would invalidate the bullish scenario, potentially triggering a deeper retracement toward:
195.80 – Near-term support
194.80 – Key downside level in a bearish reversal
Conclusion:
As long as 196.75 holds, the bias remains bullish, favoring continuation toward the 199–200 zone. A confirmed break below this support would shift momentum, opening the door for a broader corrective decline.
This communication is for informational purposes only and should not be viewed as any form of recommendation as to a particular course of action or as investment advice. It is not intended as an offer or solicitation for the purchase or sale of any financial instrument or as an official confirmation of any transaction. Opinions, estimates and assumptions expressed herein are made as of the date of this communication and are subject to change without notice. This communication has been prepared based upon information, including market prices, data and other information, believed to be reliable; however, Trade Nation does not warrant its completeness or accuracy. All market prices and market data contained in or attached to this communication are indicative and subject to change without notice.
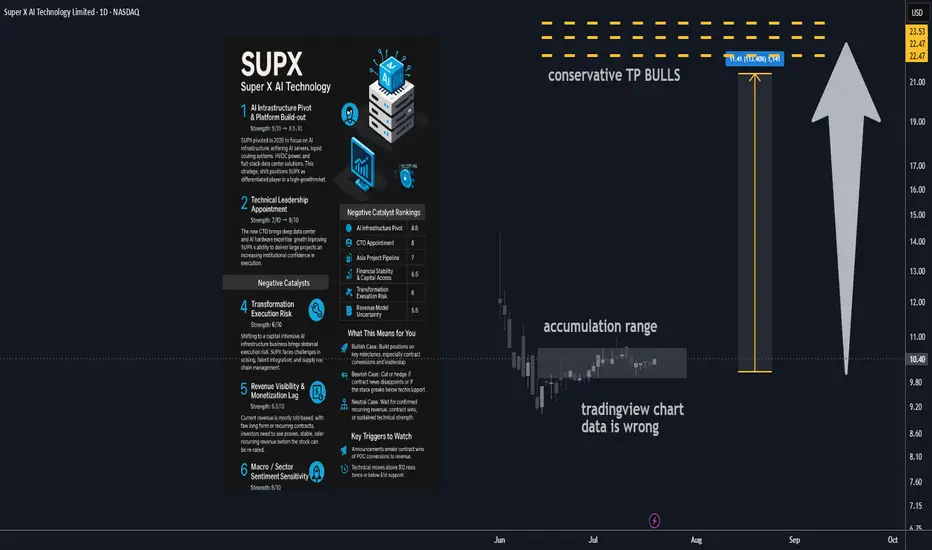
Super X AI Technology Ltd AI Infrastructure Stock 100% upside🔋 1. AI Infrastructure Pivot & Platform Build-out
Strength: 8/10 → 8.5/10
SUPX has made a major pivot in 2025, transitioning from a legacy business into next-gen AI infrastructure. The new focus includes AI servers, liquid cooling systems, HVDC power, and full-stack data center offerings targeting the rapidly growing demand for AI compute in Asia. This shift positions SUPX as a differentiated player in a high-growth market, opening doors to larger contract values and broader verticals.
________________________________________
🤖 2. Technical Leadership Appointment
Strength: 7/10 → 8/10
A major recent step forward is the hiring of a seasoned CTO with deep data center and AI hardware experience. This upgrade significantly enhances SUPX’s execution ability and credibility in enterprise infrastructure. Institutional investors and potential partners will see this as a sign SUPX can deliver on its technical roadmap and close major deals.
________________________________________
📈 3. Asia Institutional Partnerships Pipeline
Strength: 6.5/10 → 7/10
SUPX is developing a solid pipeline of institutional AI infrastructure projects across Asia, especially with established banks and tech companies. While many projects are still in proof-of-concept or pilot stages, these early relationships can drive high-margin, recurring business if successfully converted to long-term contracts.
________________________________________
💰 4. Capital Structure & Financial Health
Strength: 6/10 → 6.5/10
The company’s cash position has improved after new equity raises, giving SUPX a runway for continued R&D and expansion. While the business is still operating at a loss and share dilution remains a factor, debt levels are manageable and financial flexibility should support continued transformation and growth.
________________________________________
________________________________________
⚠️ Negative Catalysts
🛠️ 5. Transformation Execution Risk
Strength: 6/10 → 6/10
Transitioning from a legacy model to a complex, capital-intensive AI infrastructure business brings substantial execution risk. SUPX must navigate operational scale-up, talent integration, and supply chain challenges, with no guarantee of seamless delivery. Any delays or setbacks could erode investor confidence.
________________________________________
🌐 6. Revenue Visibility & Monetization Lag
Strength: 5.5/10 → 5.5/10
Most current revenue is still pilot-based, with few long-term or recurring contracts secured. The business model relies on successful conversion of its pipeline and faster ramp-up in recognized sales. Investors will need to see evidence of stable, recurring revenue before the stock is re-rated.
________________________________________
🔁 7. Macro / Sector Sentiment Sensitivity
Strength: 5/10 → 5/10
As a small-cap AI/infra play, SUPX is highly exposed to swings in broader market sentiment. Any downturn in tech or risk-off moves in global markets could lead to outsized stock volatility, regardless of execution progress.
________________________________________
________________________________________
🚀 Refreshed Catalyst Rankings
Rank Driver Score
1 AI Infrastructure Pivot 8.5
2 CTO Appointment (Execution) 8
3 Asia Project Pipeline 7
4 Financial Stability & Capital Access 6.5
5 Transformation Execution Risk 6
6 Revenue Model Uncertainty 5.5
7 Macro / Sector Volatility 5
________________________________________
📊 Analyst Ratings & Price Outlook
• No major Wall Street coverage; visibility remains driven by news flow and early institutional/retail adoption.
• Technicals: The stock has established higher lows since its business model pivot. Resistance sits near $11.50–12, with support at $9.80–10.00.
• Price target: A $20 target remains plausible if SUPX delivers on growth milestones and secures new capital or contracts, representing a potential doubling from current levels.
________________________________________
🗞️ Recent Developments
• Hired a proven CTO to drive the new AI/data center focus.
• Company rebranded and fully pivoted its business model in 2025, shifting all resources to AI infrastructure.
• Implemented a new equity incentive plan to attract and retain top tech talent.
• Announced a robust pipeline of institutional projects across Asia, although most are not yet recognized as revenue.
________________________________________
🔍 Summary Outlook
SUPX is an emerging transformation play, now fully aligned with surging demand for AI infrastructure. Its success depends on management’s ability to scale, close institutional contracts, and prove out recurring revenue. While the story is compelling and early traction is positive, the company remains high-risk and execution-dependent at this stage.
Bull Case:
If SUPX converts pilots into revenue, delivers operationally, and continues to attract top talent, the stock could re-rate to the $15–20+ range as its business model is validated.
Bear Case:
Stumbles in execution, monetization, or funding could send the stock back to $7–8 support.
Neutral:
Many investors may choose to wait for confirmation of contract wins, recurring revenue, or sustained technical strength before committing.
Technical Levels to Watch:
• Bullish breakout if it clears and holds $11.50–12.00.
• Bearish risk if it fails to hold $9.80–10.00, with possible drop toward $8.
________________________________________
✅ What This Means for You
• Bullish: Build positions into execution milestones, focusing on contract conversions and leadership updates. Upside potential to $20 if catalysts align.
• Bearish: Cut or hedge exposure on failed contract news or technical breakdown.
• Neutral: Stay on the sidelines until more evidence of recurring revenue, confirmed contract wins, or positive sector momentum.
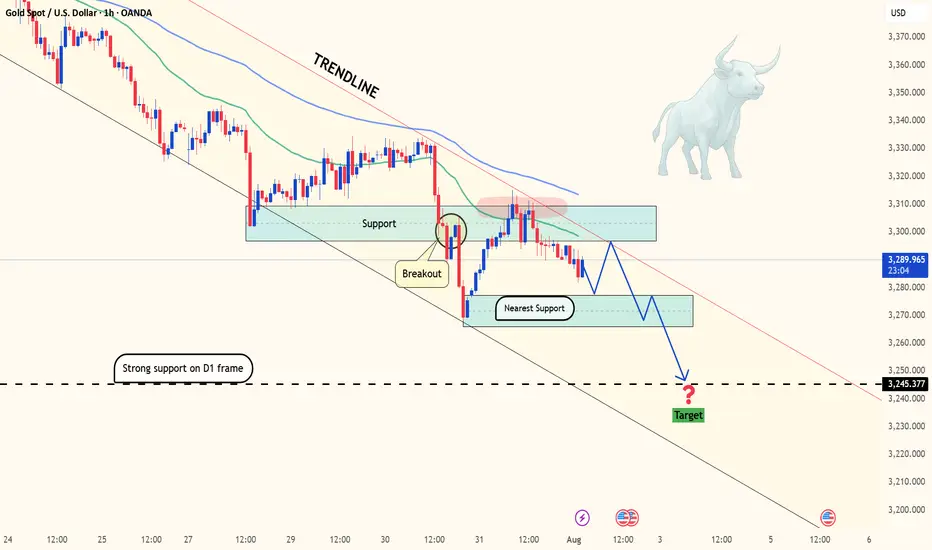
Gold on the edge: Will 3,270 break as Fed pressure builds?Hello traders, what’s your view on XAUUSD?
Yesterday, gold remained under pressure as a series of fresh U.S. economic data reinforced expectations that the Federal Reserve will keep interest rates higher for longer. As a result, U.S. Treasury yields surged, the dollar strengthened, and gold came under renewed selling pressure. Currently, XAUUSD is trading around 3,288 USD, down 0.04% on the day.
From a technical standpoint, gold is clearly trading within a well-defined downward-sloping channel, confirming the dominance of bearish momentum. Moreover, both the EMA34 and EMA89 are acting as dynamic resistance levels, repeatedly rejecting any short-term recovery attempts—highlighting the strength of the current downtrend.
If a pullback occurs before the next leg lower, the confluence of resistance and the EMA zone will be crucial to watch. It could offer ideal conditions for potential short setups in line with the trend.
Looking ahead, the next key support lies at 3,270 USD. A break below this level could open the door for a deeper move toward the 32XX area.
What do you think? Will gold continue to drop further?
Good luck and trade safe!
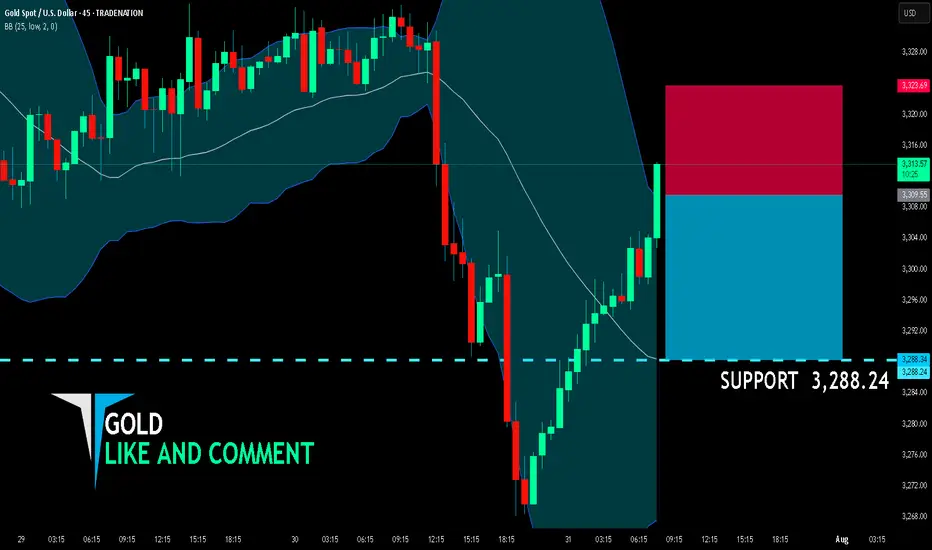
GOLD BEST PLACE TO SELL FROM|SHORT
GOLD SIGNAL
Trade Direction: short
Entry Level: 3,309.55
Target Level: 3,288.24
Stop Loss: 3,323.69
RISK PROFILE
Risk level: medium
Suggested risk: 1%
Timeframe: 45m
Disclosure: I am part of Trade Nation's Influencer program and receive a monthly fee for using their TradingView charts in my analysis.
✅LIKE AND COMMENT MY IDEAS✅
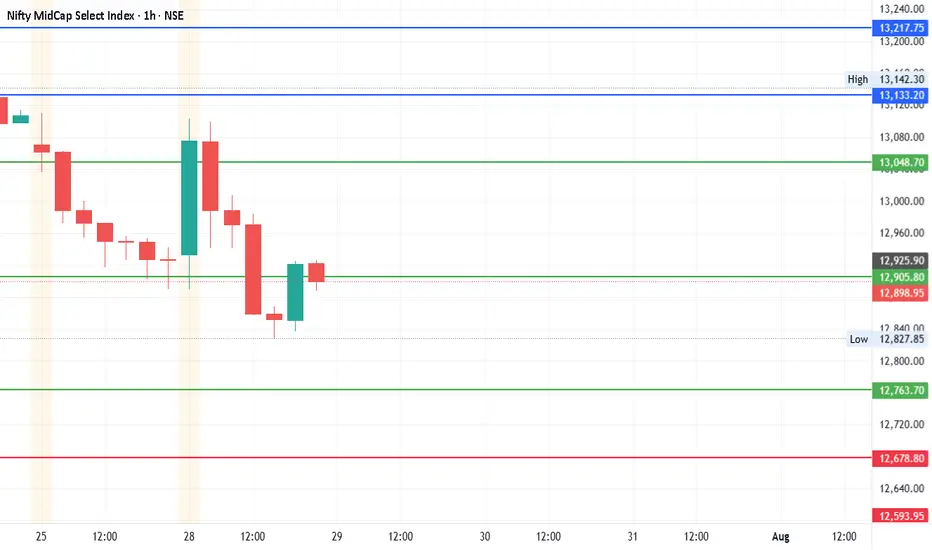
#NIFTY_MID_SELECT - 400 POINTS SWING ON CARDS?Date: 28-07-2025
#Midcap - Current Price: 12898.95
Pivot Point: 12905.825 Support: 12763.711 Resistance: 13048.719
Upside Targets:
Target 1: 13133.222
Target 2: 13217.725
Target 3: 13334.688
Target 4: 13451.650
Downside Targets:
Target 1: 12678.818
Target 2: 12593.925
Target 3: 12476.963
Target 4: 12360.000
#TradingView #Stocks #Equities #StockMarket #Investing #Trading #NiftyMIDCAP
#TechnicalAnalysis #StockCharts #Finance
Gold Crashes $100 After Hitting Monthly High | What’s Next?In this video, I break down everything that moved the price of gold last week, from the early-week rally toward $3,430 to the sharp midweek drop toward $3,325. We go beyond the surface, diving into what caused the reversal, and how I'm approaching next week’s market using a simple ascending channel on the 4-hour chart.
With major events like the FOMC rate decision, U.S. GDP, PCE inflation, NFP and the August 1 tariff deadline all on the radar, this analysis will help you stay grounded and prepare for volatility.
👉 If you find this content valuable, don’t forget to Boost, Comment, and Subscribe for weekly market breakdowns.
Disclaimer:
Based on experience and what I see on the charts, this is my take. It’s not financial advice—always do your research and consult a licensed advisor before trading.
#goldanalysis, #goldforecast, #xauusd, #goldpriceprediction, #technicalanalysis, #fundamentalanalysis, #tradingstrategy, #forextrader, #priceaction, #fomc, #usgdp, #pceinflation, #goldtrading, #forexeducation, #dollarvsgold, #tariffnews, #chartanalysis, #forexmentorship, #rebuildingthetraderwithin

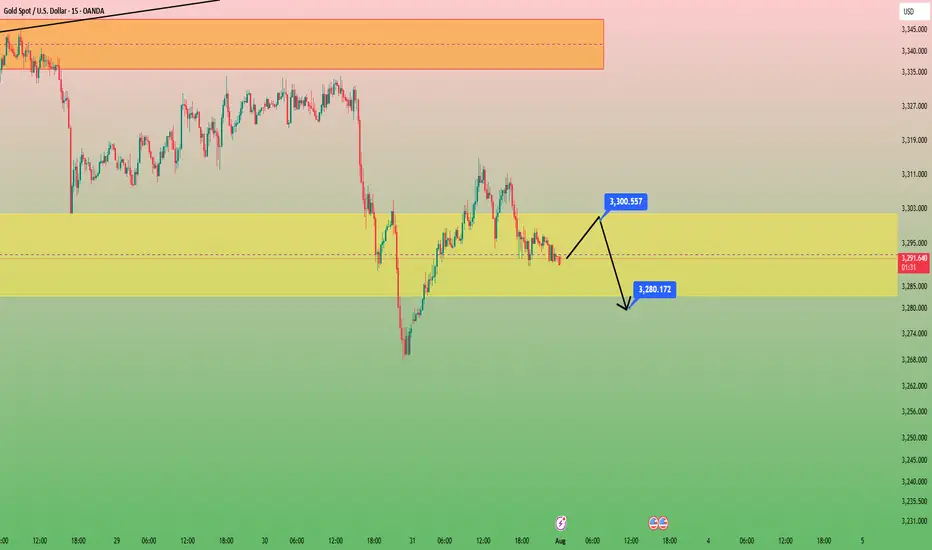
GOLD in 15minHello to all traders. 😎😎
I hope all your deals will hit their targets. 🎉🎉
After yesterday's heavy drop on the last day of July. We had a weak growth.
I think the price will retest $3300 and we will have another drop to the $3280 area. Look for short positions in the $3300 area.
Remember that this is an analysis and be sure to do money management when trading.
What Do You Think?
Which scenario do you think is happen? **Share your thoughts!** ⬇️
Don't forget that this is just an analysis to give you an idea and trade with your own strategy. And don't forget the stop loss🛑🛑🛑
❤️❤️❤️The only friend you have in financial markets is your stop loss❤️❤️❤️
Please support me with your ✅' like'✅ and comments to motivate me to share more analysis with you and share your opinion about the possible trend of this chart with me 🙏😊
Be Happy , Ali Jamali
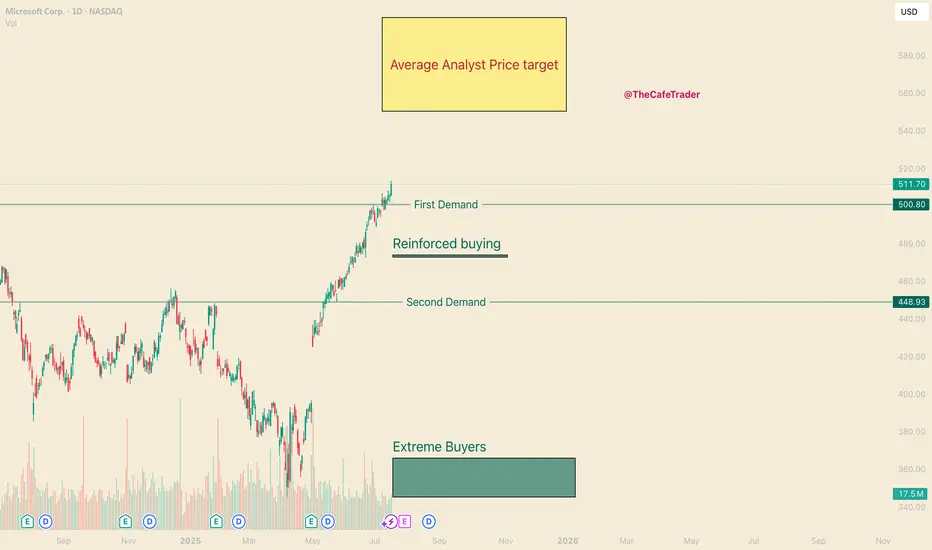
MSFT - Should you Buy All Time Highs?Hello everyone, I’m TheCafeTrader.
Next up in our breakdown of the MAG 7 is Microsoft (MSFT) — this post focuses on a long-term swing trade setup.
For short-term analysis, head to my profile and check out the latest posts.
⸻
💡 The Setup:
MSFT continues to ride a strong wave thanks to AI growth, especially with Copilot and its projected impact on revenue.
Several analysts have price targets ranging from $550 to $600, which still leaves 10–20% upside from current levels.
As of this writing, MSFT closed at $511.70, about 9% above its previous all-time high — and it got there in just five weeks.
Momentum is strong, and there’s no clear sign of slowing down.
⸻
📈 Is Now a Good Time to Buy?
Let’s look at two possible strategies:
⸻
Dollar-Cost Averaging (DCA) vs. Lump-Sum Investing
If you’re unfamiliar with DCA: it’s a strategy where you buy in gradually over time.
Say you have $5,000 set aside for MSFT — you might invest $1,000 now and continue adding monthly.
This is a smart approach in choppy or uncertain markets, but MSFT is not showing weakness right now.
Historically, when strong stocks are in clear bull trends, lump-sum investing outperforms DCA.
So if you’re confident in MSFT’s long-term potential — and want exposure to the current momentum — a full position now could make sense.
If you’re looking for a better price or want to scale in patiently, keep an eye on these key zones.
⸻
🧭 Areas of Interest on the Chart:
1. Yellow Box (Target Zone):
→ $550–$600 is the broader analyst price target range.
2. First Demand Line (~$500):
Recent signs of active buyer interest. If bulls remain in control, this could act as a springboard.
3. Reinforced Buyer Zone (~$472–$474):
This area has been tested and defended before. It’s a strong pullback entry if momentum stalls.
4. Second Demand Line (~$449):
A previous base of institutional accumulation. Price may revisit here in a broader market dip.
5. Deep Buyer Zone (~$344–$365):
A rare but powerful level where big money entered aggressively. It’s unlikely we revisit this zone — but if we do, it could be a great buy.
⸻
🧠 Strategy Summary:
• Aggressive buyers may consider entering around $500, where recent demand appeared.
• More patient traders might wait for MSFT to pull back into the $449–$474 range, where institutional interest has been high.
• The $344–$365 zone is a long shot — but would be a massive value area if touched.
⸻
That’s it for the long-term outlook on MSFT.
For more short-term trades and entries, check out my other posts — especially as we continue tracking the MAG 7.
@thecafetrader
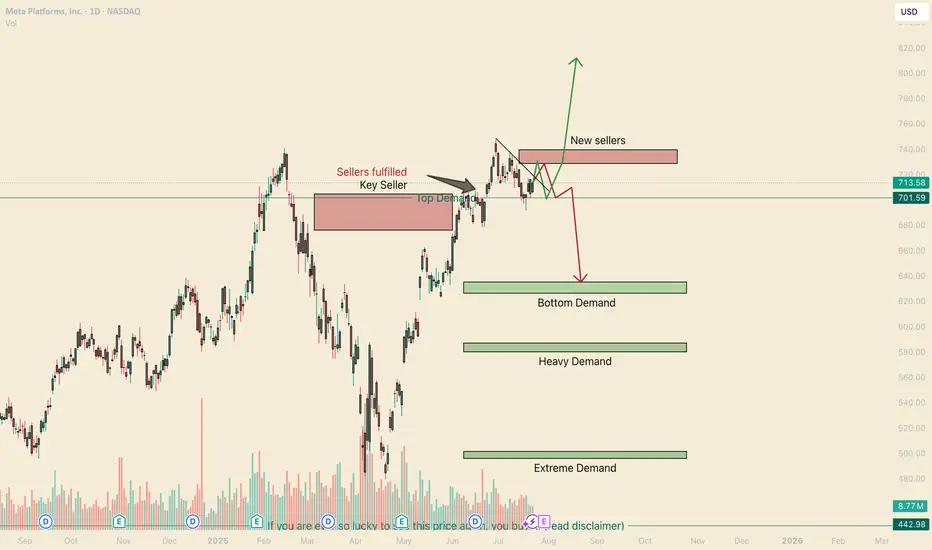
META Double Top? Think Again. Hello, my name is The Cafe Trader.
As part of our MAG 7 Series, we tackle META next on the list.
This article is for:
– Long-Term Investors
– Long-Term Hedges
– Swing Traders
– Options Traders
⸻
Brief Notes:
1. Meta is going all-in on AI, integrating it across all platforms (Instagram, Facebook, WhatsApp…).
2. 97% of Meta’s revenue still comes from ads. They’ve rebounded strongly from Apple’s policy changes—thanks in large part to AI targeting.
3. Meta is thinking long-term with AR/VR.
4. International user growth has exploded.
Conclusion: Bullish winds continue to blow behind META.
⸻
Long-Term Levels
• Aggressive Buy = $701.59 → Marked as “Top of Demand.” This is where aggressive buyers are looking to add.
• Good Value = $626–$635 → Marked “Bottom of Demand.”
• STEAL = $496–$501 → Marked “Extreme Demand.”
Why not buy at the ‘Heavy Demand Zone’?
Great question. If bears take out those buyers above this zone, it suggests something major has shifted in sentiment around META.
Even though there’s heavy demand here, I’d want to observe how sellers approach the area. You’ll likely get multiple chances to enter if buyers defend it. But if it breaks down, the best pricing lies at “Extreme Demand.”
For long-term holders looking to hedge downside, I suggest a Bear Put Spread or outright puts. More on this under the Red Scenario Options.
⸻
For Traders
Let me be real—this chart is tricky.
The V-shaped recovery signals strong bullish interest. That insane rally took out a major seller, further fueling the bulls.
That said, how we pulled away from the previous ATH (all-time high) shows weakness—low buying interest, followed by a real seller stepping in.
So yeah, I’m mixed on sentiment. But I’m confident in identifying liquidity and managing exits fast.
⸻
Two Scenarios
✅ Green Scenario
– Stock:
The bounce off “Top of Demand” is a strong bullish signal. Bears will be under pressure around $729, though I expect one more rejection before we break through.
I liked the original entry at “Top of Demand.” If entering again, I’d wait for a crack below that zone and watch the close—if we recover and close above it (especially if the dip was deep), that’s a strong signal to re-enter.
Target: take partial or full profits around $729. Hold the rest for highs or a breakout.
– Options:
If you can grab the 715 Calls with 3–5 days out for under $4.50, this setup could easily hit 2–3R.
Even better if you can get closer-to-the-money contracts for cheaper.
⸻
❌ Red Scenario
– Stock:
I believe this “new seller” is a fabricated seller—likely to get squeezed.
But if no new buying interest shows up to challenge that seller, we could see pressure on “Top of Demand” and a legit correction, maybe even a broader consolidation range.
Next few days will reveal the strength of buyers.
If no aggressive buying steps in, I like the short setup, targeting “Bottom of Demand” for TP.
– Options:
Long-Term Holders:
Use 2–3% of your META share value on a Bear Put Spread or put options.
If using puts, get 2–3 weeks of time. Go as close to the money as your risk allows.
Active Traders:
This could move fast if it plays out. If you can grab a 710 Put with 3–5 days for under $1.00, hold until a big red candle (3–5%) forms.
If it keeps dragging down, roll into a new contract the following week.
⸻
Follow for more analysis and updates — and as always,
Happy Trading.
📲 @thecafetrader
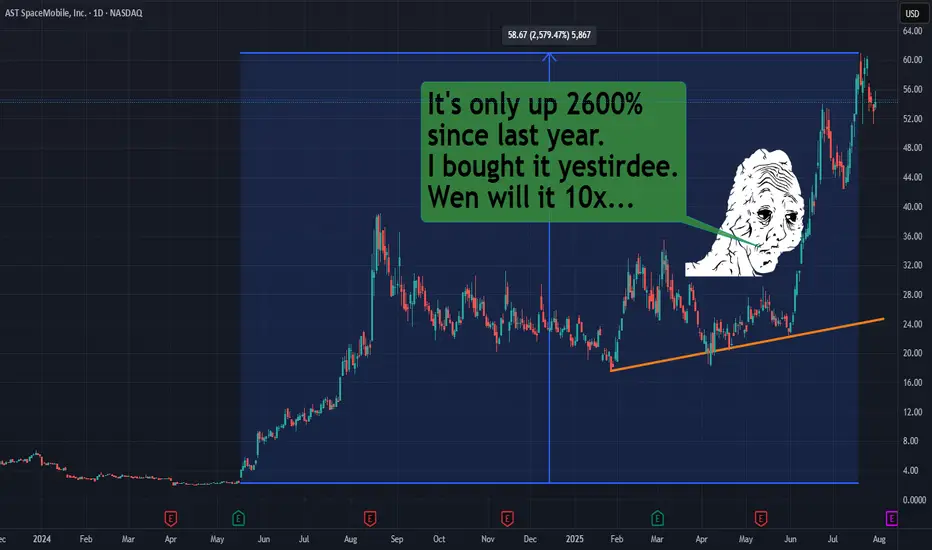
ASTS | Starlink ain't the only game in space no mo!This stock NASDAQ:ASTS is only up like 2600% in a year. That's like nothing. Might as well be losing that paypah.
Yes, it will swing more wildly than a chimpanzee from a vine. And yes my chart is probably effed as heck, but I'm looking for beyondosphere type of returns.
Is there room for more than one big f***y boom batty space phone company? Elon, scoot your bumbie over and let ASTS get in on that space rocket seat.
Play here is direct-to-cell calls between satellites and cell phones. Starlink probably has the advantage like the tide rolling over middle state a&m community college, but just like there was room for many phone companies in the last decades, there will be room for multiple space junkie phone companies.
You will not get rich because you will not HODL!
Live long and prosper. This is not financial advice. I JUST LIKE THE STOCK.
THANK YOU FOR YOUR ATTENTION ON THIS MATTER
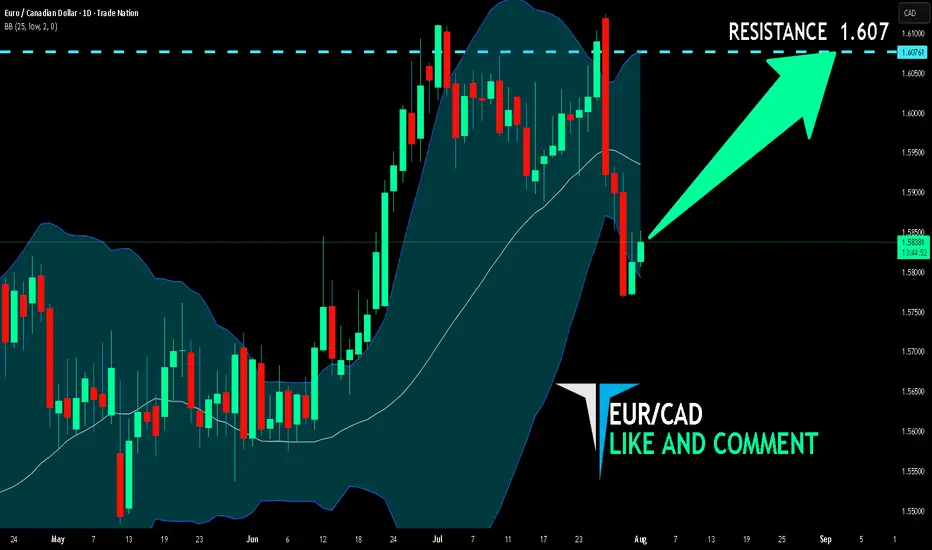
EUR/CAD BUYERS WILL DOMINATE THE MARKET|LONG
Hello, Friends!
We are going long on the EUR/CAD with the target of 1.607 level, because the pair is oversold and will soon hit the support line below. We deduced the oversold condition from the price being near to the lower BB band. However, we should use low risk here because the 1W TF is red and gives us a counter-signal.
Disclosure: I am part of Trade Nation's Influencer program and receive a monthly fee for using their TradingView charts in my analysis.
✅LIKE AND COMMENT MY IDEAS✅
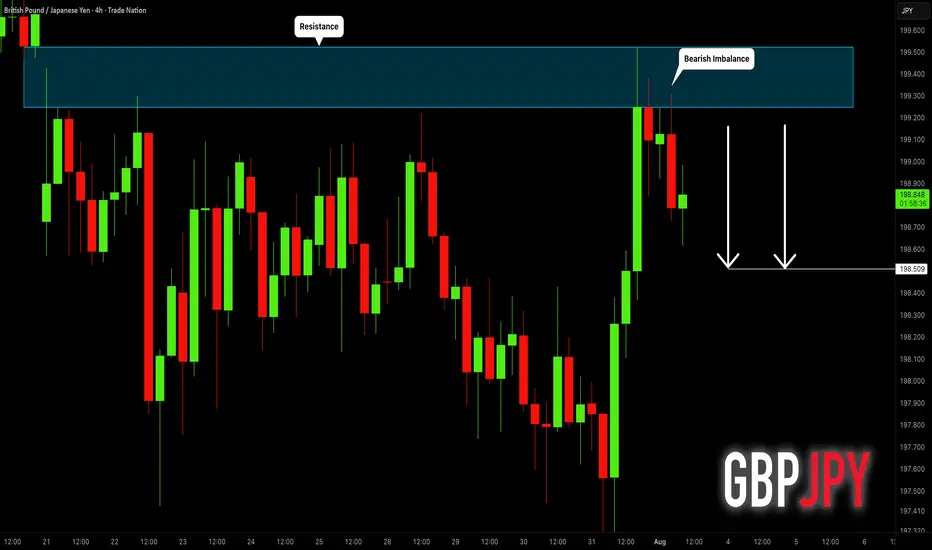
GBPJPY: Pullback From Resistance 🇬🇧🇯🇵
I think that GBPJPY will pull back from a wide
intraday supply area.
As a confirmation, I see a bearish imbalance candle that
is formed after its test.
Goal - 198.51
❤️Please, support my work with like, thank you!❤️
I am part of Trade Nation's Influencer program and receive a monthly fee for using their TradingView charts in my analysis.
Btc Short positing Strong sell 40 to 50 pips Btc Short positing Strong sell 40 to 50 pips .
If you wanted to learn about more fell free contrect me .
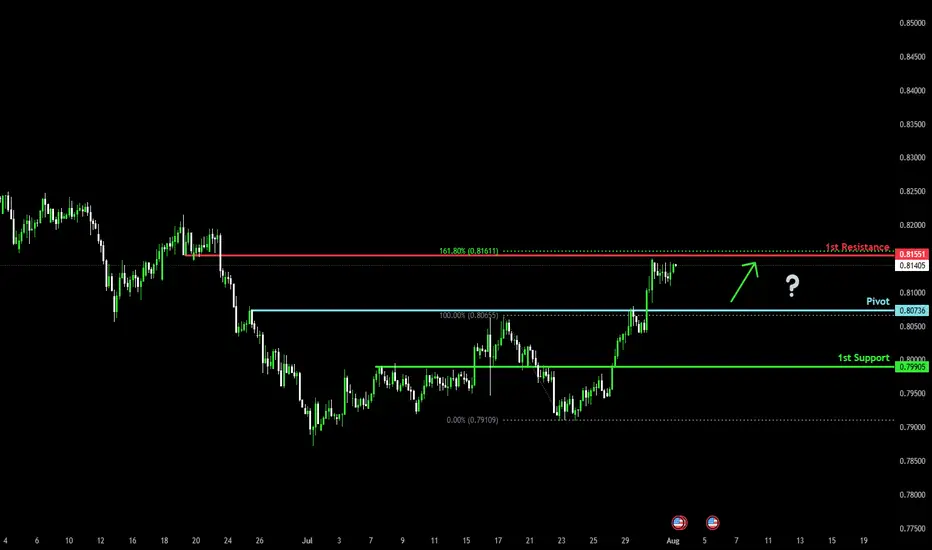
Bullish bounce off pullback support?The Swissie (USD/CHF) is falling towards the pivot, which acts as a pullback support and could bounce to the 1st resistance, which lines up with the 161.8% Fibonacci extension.
Pivot: 0.8073
1st Support: 0.7990
1st Resistance: 0.8155
Risk Warning:
Trading Forex and CFDs carries a high level of risk to your capital and you should only trade with money you can afford to lose. Trading Forex and CFDs may not be suitable for all investors, so please ensure that you fully understand the risks involved and seek independent advice if necessary.
Disclaimer:
The above opinions given constitute general market commentary, and do not constitute the opinion or advice of IC Markets or any form of personal or investment advice.
Any opinions, news, research, analyses, prices, other information, or links to third-party sites contained on this website are provided on an "as-is" basis, are intended only to be informative, is not an advice nor a recommendation, nor research, or a record of our trading prices, or an offer of, or solicitation for a transaction in any financial instrument and thus should not be treated as such. The information provided does not involve any specific investment objectives, financial situation and needs of any specific person who may receive it. Please be aware, that past performance is not a reliable indicator of future performance and/or results. Past Performance or Forward-looking scenarios based upon the reasonable beliefs of the third-party provider are not a guarantee of future performance. Actual results may differ materially from those anticipated in forward-looking or past performance statements. IC Markets makes no representation or warranty and assumes no liability as to the accuracy or completeness of the information provided, nor any loss arising from any investment based on a recommendation, forecast or any information supplied by any third-party.