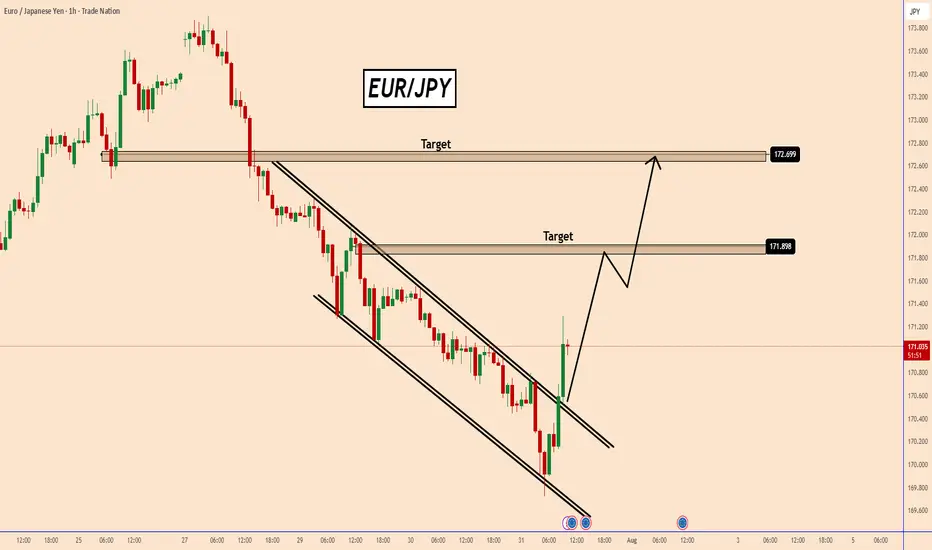
EURJPY Poised to test the top after the BOJ Rate DecisionEURJPY Poised to test the top after the BOJ Rate Decision
EURJPY broke out of a descending type of channel pattern or something similar.
The last two candles confirmed the bullish movement in a clear way and the odds are that EURJPY may rise further during the coming hours.
However this movement is also supported by BOJ Interst Rate decision.
BOJ kept rates unchanged at 0.5% as expected and they didn't change anything at all in their comments.
News - reported by forexlive
The Japanese Yen weakened across the board throughout BoJ Governor Ueda press conference. He sounded like someone who's not in a rush to hike rates at all. The two key lines were "monetary tightening effectively works on demand-driven inflation, but current inflation is largely supply-driven" and "current FX rate not diverging far from our assumptions".
He's basically saying that the current inflation is likely to be a one-off event and we all know how much weight they place on sustained inflation to durably hit their 2% target. And the comment about FX suggests that the depreciation in the JPY does not concern them at all, which gives the market the green light for further depreciation (all else being equal).
You may find more details in the chart!
Thank you and Good Luck!
PS: Please support with a like or comment if you find this analysis useful for your trading day
Disclosure: I am part of Trade Nation's Influencer program and receive a monthly fee for using their TradingView charts in my analysis.
Community ideas
TradeCityPro | Bitcoin Daily Analysis #141👋 Welcome to TradeCity Pro!
Let’s dive into Bitcoin analysis. Yesterday, the exact bearish scenario I told you about happened. Let’s see what opportunities the market is offering us today.
⏳ 4-Hour Timeframe
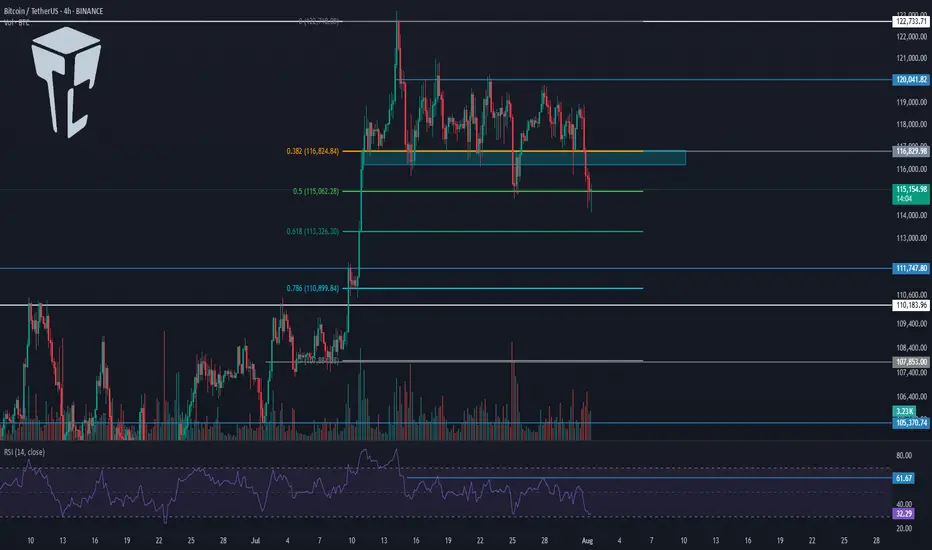
Yesterday, I mentioned that the price had tested the 116829 zone too many times and that this area had become very weak. I also said that if the price made a lower high than 120041, deeper corrections would be likely.
✔️ Another perspective I have on the market is that sometimes certain support and resistance levels simply aren’t strong enough to continue the trend.
🔑 For example, in this case — despite Bitcoin being in an uptrend across all cycles — the 116829 support couldn’t hold, and the price broke it to reach a stronger support zone, one that might be capable of continuing the trend.
📊 Right now, this is what might be happening again. Support levels like 0.5, 0.618, and 0.786 Fibonacci retracement zones could be where the next bullish leg begins.
✅ At the moment, price has reached the 0.5 Fibonacci level, and the previous strong bearish momentum has slightly weakened. If you look at the volume, momentum is still in favor of sellers, but based on the long lower wicks on the candles, we can say the bearish trend is showing signs of weakness.
💥 On the other hand, RSI is approaching 30, and in an uptrend, when RSI nears the Oversold zone, it can often be a good entry point for a long. However, we’re not acting on this yet — we’ll wait for more confirmations before opening any positions.
⭐ For now, there’s no trigger for a long position on this timeframe. A break below 115000 could act as a short trigger, but given the trend Bitcoin is in, I’m not opening any short positions at the moment.
⏳ 1-Hour Timeframe
The price has dropped down to 114560, and I believe today we might enter a corrective phase. However, if the price stabilizes below 114560, the correction could continue. The next targets would be the Fibonacci levels from the 4-hour timeframe.
🔽 I won’t open a short position with the break of 114560, and I suggest you don’t take that short either.
📈 If this move turns out to be a fakeout, the first trigger we have now is at 118736, which is quite far from the current price. For this trigger to activate, we’d need to see a V-pattern form.
🔍 There are no other triggers right now. But if more range structure forms, we might consider opening a risky long on the breakout of the range top.
❌ Disclaimer ❌
Trading futures is highly risky and dangerous. If you're not an expert, these triggers may not be suitable for you. You should first learn risk and capital management. You can also use the educational content from this channel.
Finally, these triggers reflect my personal opinions on price action, and the market may move completely against this analysis. So, do your own research before opening any position.
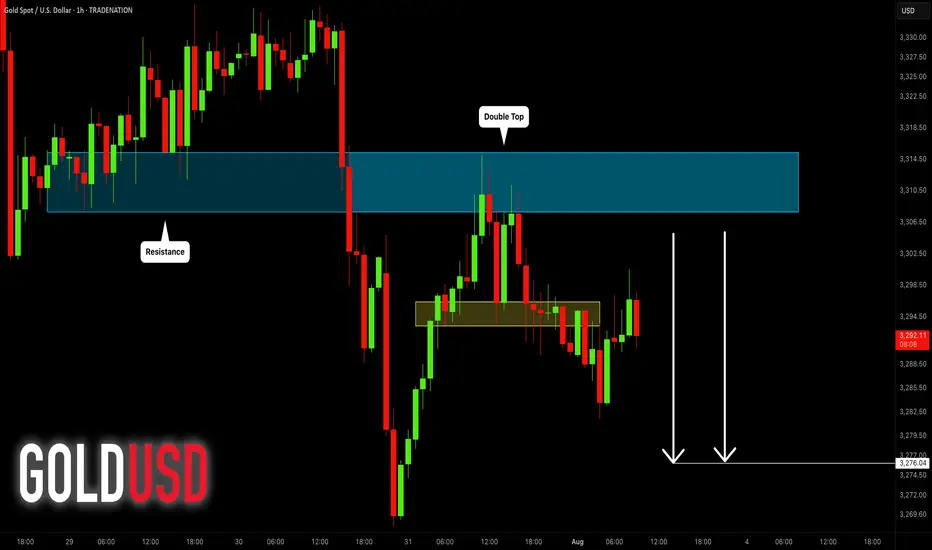
GOLD (XAUUSD): Bearish Continuation Ahead?!
Gold retested a recently broken significant liquidity cluster.
I see a clear sign of strength of the sellers after its test
with multiple intraday confirmation.
I think that the price will retrace to day to 3276 level.
❤️Please, support my work with like, thank you!❤️
I am part of Trade Nation's Influencer program and receive a monthly fee for using their TradingView charts in my analysis.
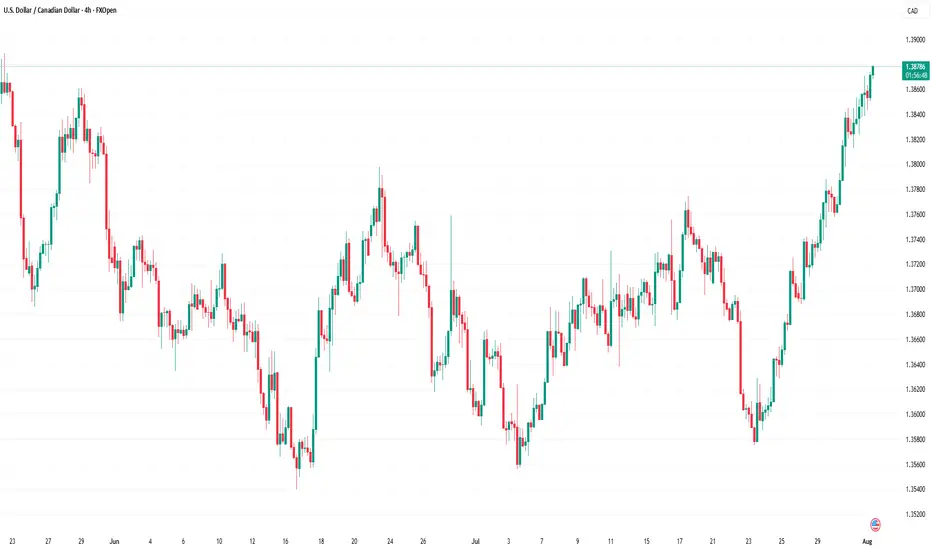
USD/CAD Rises to 2-Month HighUSD/CAD Rises to 2-Month High
Today, the USD/CAD exchange rate briefly exceeded the 1.3870 mark – the highest level seen this summer. In less than ten days, the US dollar has strengthened by over 2% against the Canadian dollar.
Why Is USD/CAD Rising?
Given that both the Federal Reserve and the Bank of Canada left interest rates unchanged on Wednesday (as expected), the primary driver behind the pair’s recent rally appears to be US President Donald Trump's decision to impose tariffs on several countries – including Canada:
→ Despite efforts by Prime Minister of Canada Mark Carney to reach an agreement with Trump, no deal was achieved;
→ Canadian goods exported to the US will now be subject to a 35% tariff;
→ The tariffs take effect from 1 August;
→ Goods compliant with the United States-Mexico-Canada Agreement (USMCA) are exempt.
Media analysts note that the tariffs are likely to increase pressure on the Canadian economy, as approximately 75% of the country's exports are destined for the United States.
USD/CAD Technical Analysis
At the end of July, the price formed a steep ascending channel (A-B), with bullish momentum confirmed by a decisive breakout above the 1.3790 resistance level, as illustrated by the arrow:
→ the pullback before the breakout was relatively shallow;
→ the bullish breakout was marked by a long bullish candlestick with a close near the session high;
→ following the breakout, the price confidently consolidated above 1.3790.
Provided that the fundamental backdrop does not undergo a major shift, bulls might attempt to maintain control in the market. However, the likelihood of a correction is also increasing, as the RSI indicator has entered extreme overbought territory.
Should USD/CAD show signs of a correction after its steep ascent, support might be found at:
→ line C, drawn parallel to the A-B channel at a distance of its width;
→ the previously mentioned 1.3790 level, which now acts as a support following the breakout.
This article represents the opinion of the Companies operating under the FXOpen brand only. It is not to be construed as an offer, solicitation, or recommendation with respect to products and services provided by the Companies operating under the FXOpen brand, nor is it to be considered financial advice.
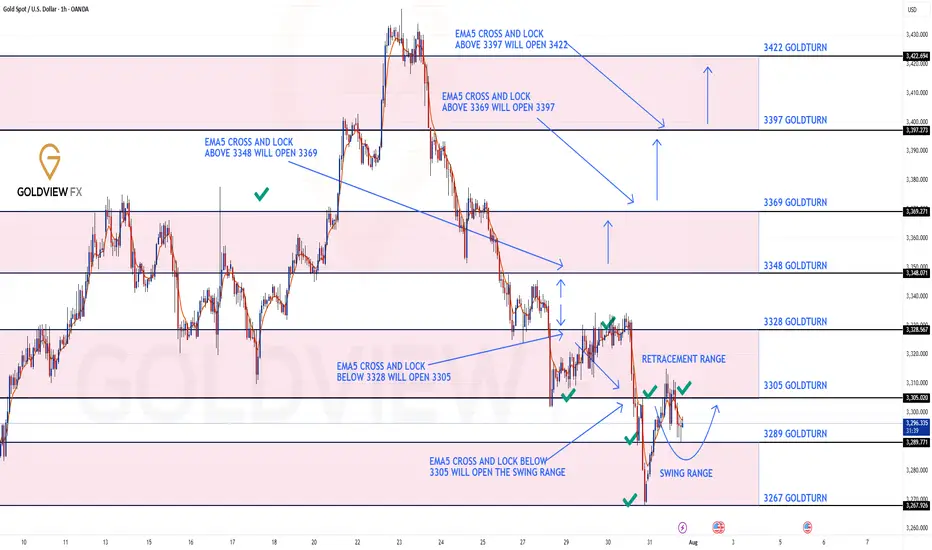
GOLD ROUTE MAP UPDATEHey Everyone,
Quick follow up on our 1H chart route map:
What can I say.....pure perfection on our chart analysis as everything played out exactly as expected.
Yesterday, we identified the first level of the swing range at 3289, which delivered a clean full swing into 3305.
Today, we hit Level 2 of the swing range at 3267, and once again, it played out flawlessly with another full swing up to 3305.
A perfect finish to the day. Great work all around!
We are now looking for support above the swing range and a break above 3305 to track the movement up or further retest and break below the 1st level of the swing range may open the the 2nd level at 3267 again.
We will keep the above in mind when taking buys from dips. Our updated levels and weighted levels will allow us to track the movement down and then catch bounces up.
We will continue to buy dips using our support levels taking 20 to 40 pips. As stated before each of our level structures give 20 to 40 pip bounces, which is enough for a nice entry and exit. If you back test the levels we shared every week for the past 24 months, you can see how effectively they were used to trade with or against short/mid term swings and trends.
The swing range give bigger bounces then our weighted levels that's the difference between weighted levels and swing ranges.
BULLISH TARGET
3348
EMA5 CROSS AND LOCK ABOVE 3348 WILL OPEN THE FOLLOWING BULLISH TARGETS
3369
EMA5 CROSS AND LOCK ABOVE 3369 WILL OPEN THE FOLLOWING BULLISH TARGET
3397
EMA5 CROSS AND LOCK ABOVE 3397 WILL OPEN THE FOLLOWING BULLISH TARGET
3422
BEARISH TARGETS
3328 - DONE
EMA5 CROSS AND LOCK BELOW 3328 WILL OPEN THE FOLLOWING BEARISH TARGET
3305 - DONE
EMA5 CROSS AND LOCK BELOW 3305 WILL OPEN THE SWING RANGE
3289 - DONE
3267 - DONE
As always, we will keep you all updated with regular updates throughout the week and how we manage the active ideas and setups. Thank you all for your likes, comments and follows, we really appreciate it!
Mr Gold
GoldViewFX
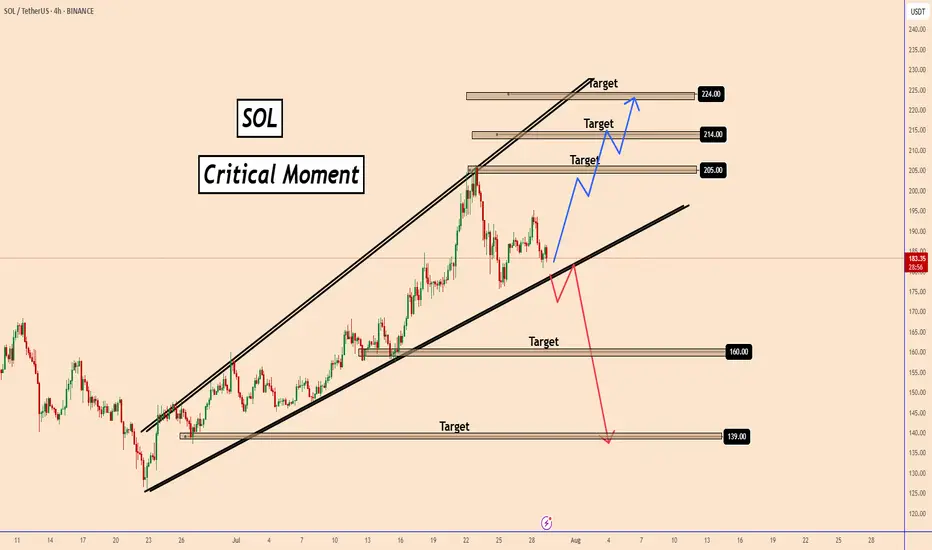
SOL Both scenarios are valid! SOL is still bullishSOL Both scenarios are valid! SOL is still bullish
SOL is in a critical zone. The price is still inside a large bullish pattern and as long as it stays inside the pattern, the trend remains bullish and SOL should follow the bullish scenario.
The bullish targets are at 205, 214 and 224
It may happen that the FOMC will bring surprises, so if SOL manages to break below the pattern, it will activate the bearish scenario after that and the chances of falling will increase further as shown in the red scenario.
The bearish targets are at 160 and 139
You may find more details in the chart!
Thank you and Good Luck!
PS: Please support with a like or comment if you find this analysis useful for your trading day
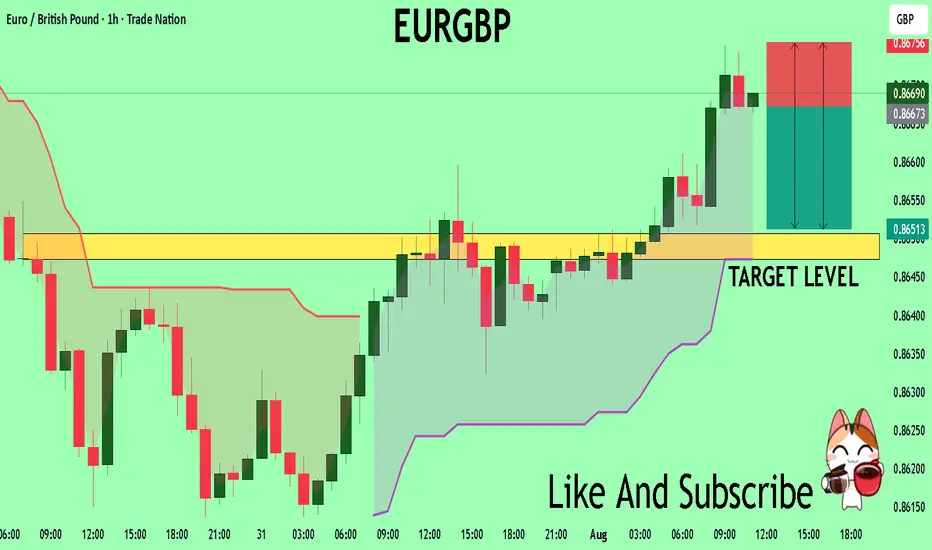
EURGBP Will Collapse! SELL!
My dear subscribers,
EURGBP looks like it will make a good move, and here are the details:
The market is trading on 0.8667 pivot level.
Bias - Bearish
My Stop Loss - 0.8675
Technical Indicators: Both Super Trend & Pivot HL indicate a highly probable Bearish continuation.
Target - 0.8650
About Used Indicators:
The average true range (ATR) plays an important role in 'Supertrend' as the indicator uses ATR to calculate its value. The ATR indicator signals the degree of price volatility.
Disclosure: I am part of Trade Nation's Influencer program and receive a monthly fee for using their TradingView charts in my analysis.
———————————
WISH YOU ALL LUCK
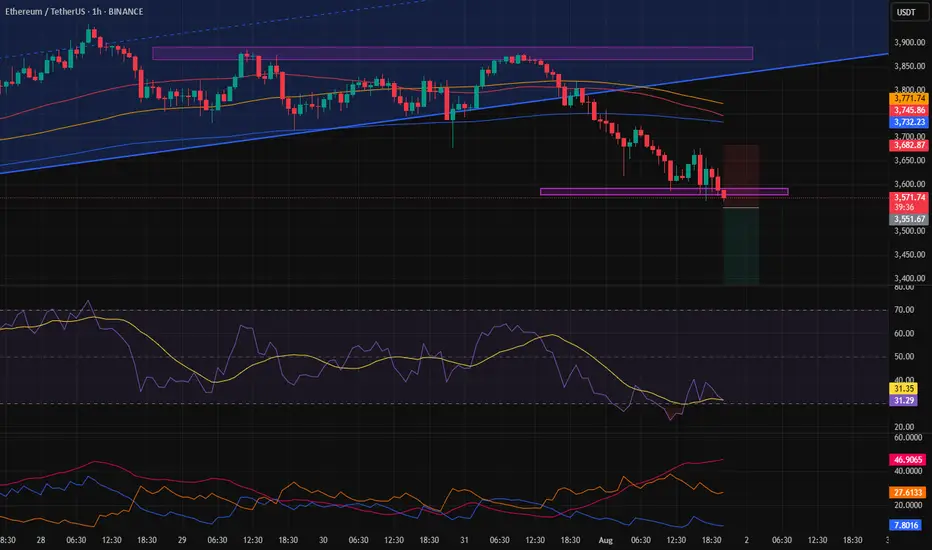
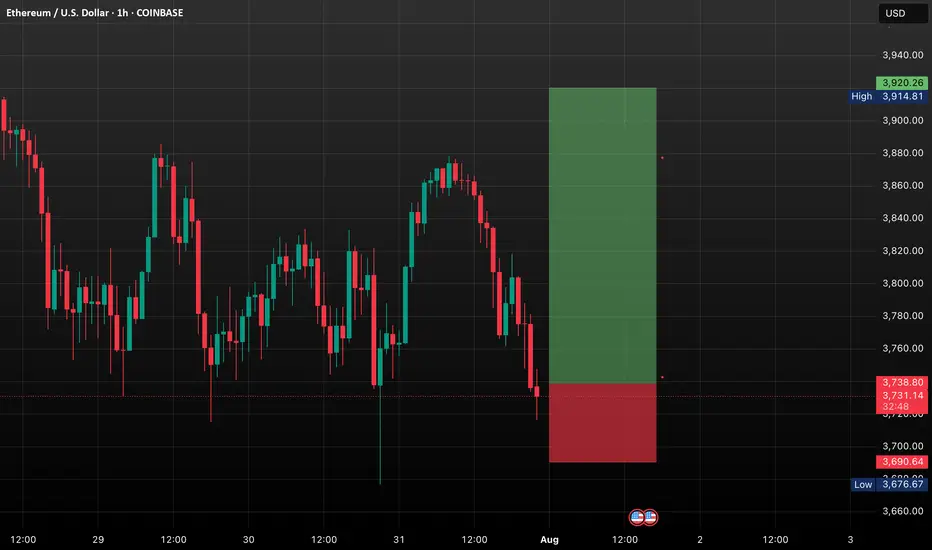
ETH BREAKOUT IMMINENT?Ethereum is currently trading around $3,726, holding just above key support levels, including the 50-day SMA and the psychological $3,700 zone. Despite a minor pullback, ETH continues to show signs of bullish strength and remains in a healthy uptrend.
Momentum indicators like RSI and volume show signs of recovery, and ETH is forming a bullish continuation pattern near resistance. If Ethereum can break above the $3,820–$3,850 zone, we are likely to see a quick push toward higher levels.
Ethereum is showing solid strength after consolidating above $3,700. The breakout attempt toward $3,850 will be critical. If bulls push through this level with volume confirmation, a move toward $3,900 and then $4000 becomes highly probable.
The market structure is constructive, and the presence of ETF-driven institutional demand adds further bullish pressure. While short-term volatility may create minor pullbacks, the medium-term setup favors upward continuation.
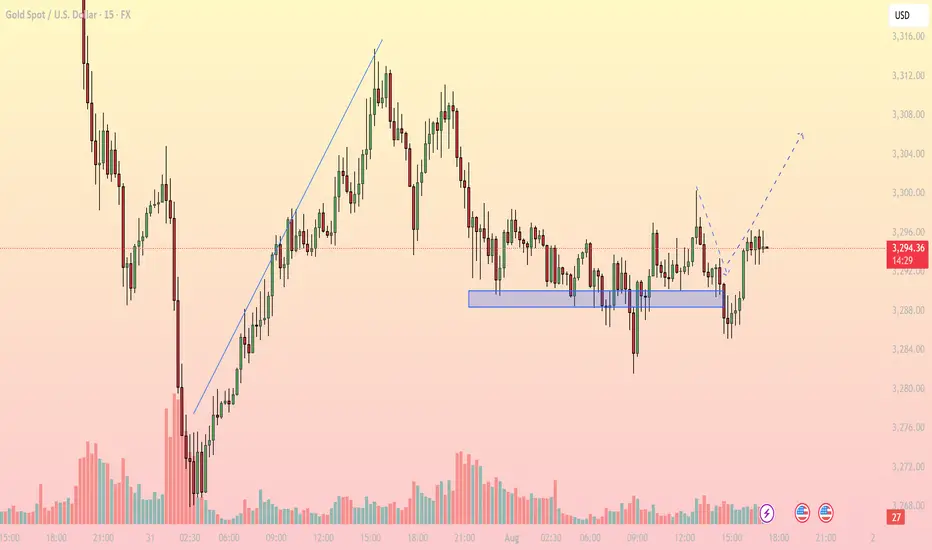
Bullish Rejection from Support, Upside in FocusMarket Overview: On the M15 timeframe, XAUUSD shows signs of a short-term bullish reversal after a prolonged sideways range around the key support zone of 3,286 – 3,289 USD. Price faked out below this support but quickly recovered, forming a V-shape reversal, suggesting strong buying interest has returned.
Key Levels to Watch:
Support Zones:
- 3,286 – 3,289: Strong intraday support, tested multiple times with sharp rejections
- 3,274: Next significant support if the above zone fails
Resistance Zones:
- 3,300 – 3,304: First resistance target aligned with the recent high
- 3,308 – 3,312: Higher resistance area where supply may emerge
Technical Indicators:
EMA: Price has reclaimed the short-term EMAs, indicating bullish momentum on lower timeframes
RSI: Rising above 50 but not yet overbought – there’s room for further upside
Volume: Increasing volume during the bounce confirms buying strength
Trading Strategy:
- Bullish Scenario (Preferred): Entry Zone: Watch for pullback toward 3,290 – 3,292
Stop Loss: Below 3,285
Take Profit 1: 3,300
Take Profit 2: 3,304
Extended Target: 3,308 – 3,312 (if bullish momentum continues beyond breakout zone)
- Bearish Scenario (Alternate): Only valid if price breaks and closes strongly below 3,286
Short Target: 3,274 – 3,270
Note: Counter-trend strategy – higher risk, requires strong confirmation
Conclusion: Gold is showing a bullish price structure on the 15-minute chart. As long as price holds above the 3,286 – 3,289 support zone, the path of least resistance appears to be upward, with 3,300 and 3,304 as the next logical targets. Monitor price action closely during the U.S. session for a potential long setup.
- Follow for more real-time gold trading strategies and save this idea if you find it helpful!
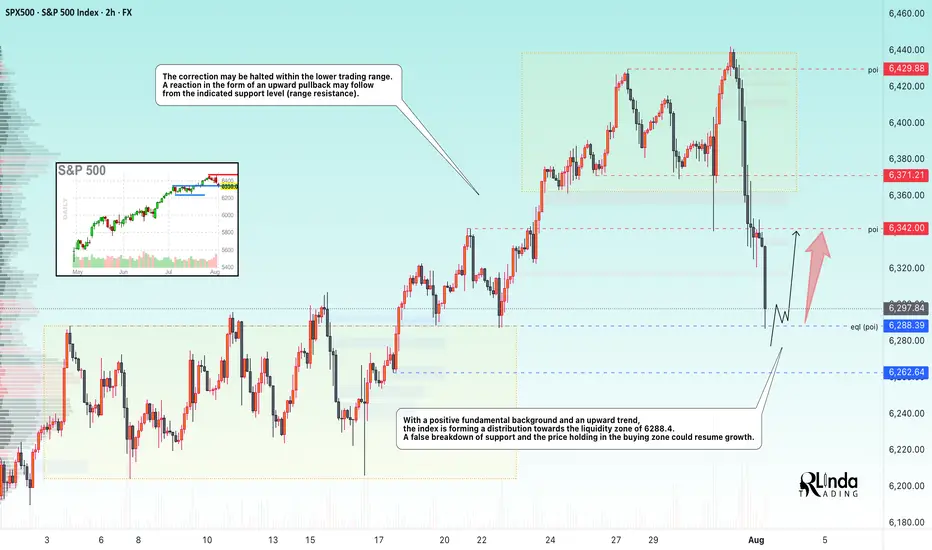
SP500 → Countertrend correction before growthFX:SPX500 is correcting against an upward trend. In the second half of the week, the market received fairly positive fundamentals during the reporting period.
S&P 500 futures found support after strong reports from Meta and Microsoft, which exceeded earnings expectations and forecasts thanks to AI. The rise in futures supported demand for the “Magnificent Seven” despite Powell's hawkish comments. The focus is on Apple and Amazon reports in the evening, which could strengthen the tech rally. On Friday, we are seeing a countertrend correction in which the market is testing the 6288 zone of interest.
Support levels: 6288.4, 6262.6
Resistance levels: 6342, 6371
Most likely, the market will form a false breakout of support during the correction. If the bulls keep the index above the key level, we can expect continued growth in the short and medium term.
Best regards, R. Linda!
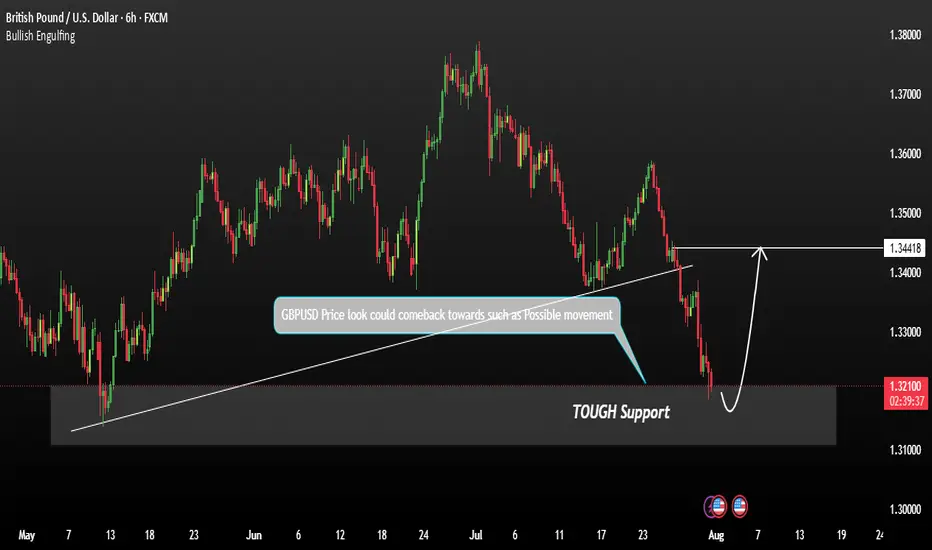
GBPUSD shows signs of a potential recoveryGBPUSD shows signs of a potential recovery towards the resistance zone. This price action indicates a possible short-term reversal or consolidation phase. We are currently observing for confirmation signals such as:
These could signal a build-up for a move back toward the key resistance at 1.34400. Traders should stay alert for price behaviour near this level as it may act as a turning point or breakout trigger.
You may find more details in the chart.
Trade wisely best of luck buddies.
Ps: Support with like and comments like for better analysis.
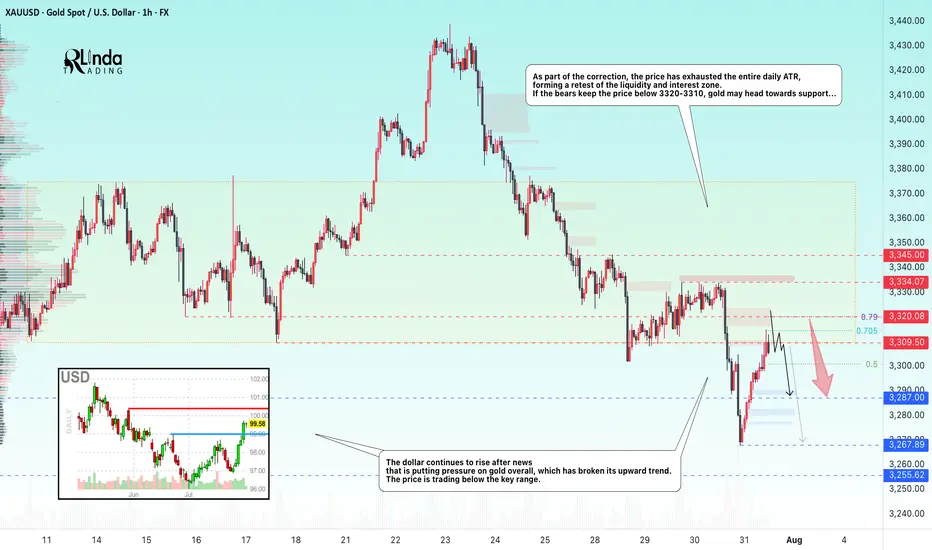
GOLD → Retest of resistance within a bearish runFX:XAUUSD breaks through the upward trend support amid a rallying dollar. Since the opening of the session, the price has been testing the zone of interest, but bears are quite aggressive...
Gold is partially recovering after falling to $3,268, a monthly low caused by the Fed's hawkish tone. The Central Bank kept its rate at 4.25–4.5% (9 votes to 2), highlighting uncertainty due to Trump's tariffs. Markets now estimate the probability of the rate remaining unchanged in September at 58% (previously 35%). The dollar's rise slowed amid concerns about the extension of the US-China trade truce and profit-taking ahead of key US employment data (after strong ADP and GDP reports). The nearest drivers are labor market statistics and trade news, while the technical picture for gold remains bearish.
Technically, on D1, the price is breaking key support zones, including the trend line, which overall only increases selling pressure on the metals market...
Resistance levels: 3310, 3320, 3334
Support levels: 3287, 3267, 3255
As part of the correction, the price has exhausted the entire daily ATR, forming a retest of the liquidity and interest zone. If the bears keep the price below 3320-3310, gold may head towards support...
Best regards, R. Linda!
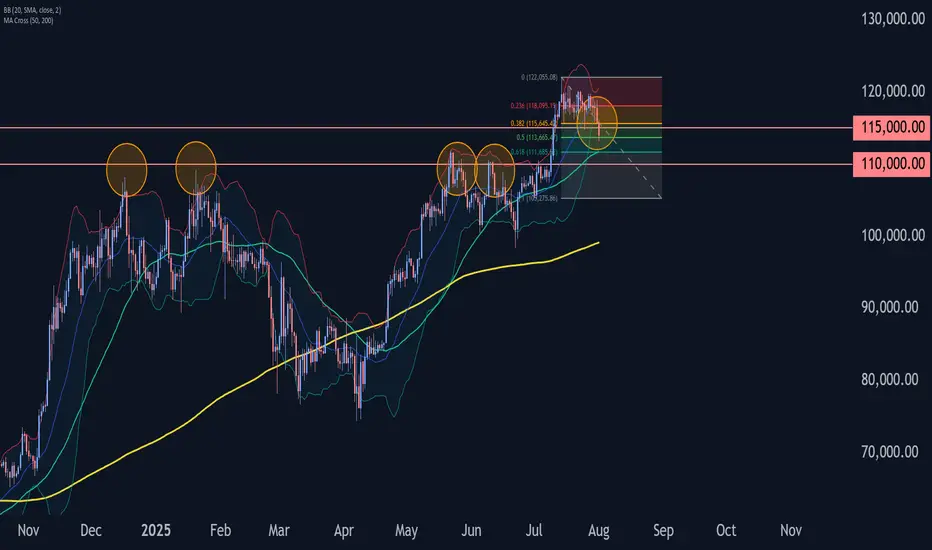
Bitcoin Wave Analysis – 1 August 2025- Bitcoin broke the pivotal support level 115000.00
- Likely to fall to support level 110000.00
Bitcoin cryptocurrency recently broke below the pivotal support level 115000.00, coinciding with the 50% Fibonacci correction of the sharp upward impulse from the start of July.
The breakout of the support level 115000.00 strengthened the bearish pressure on Bitcoin.
Given the bearish sentiment seen across the cryptocurrency markets today, Bitcoin can be expected to fall to the next support level at 110000.00 (former resistance from May and June).
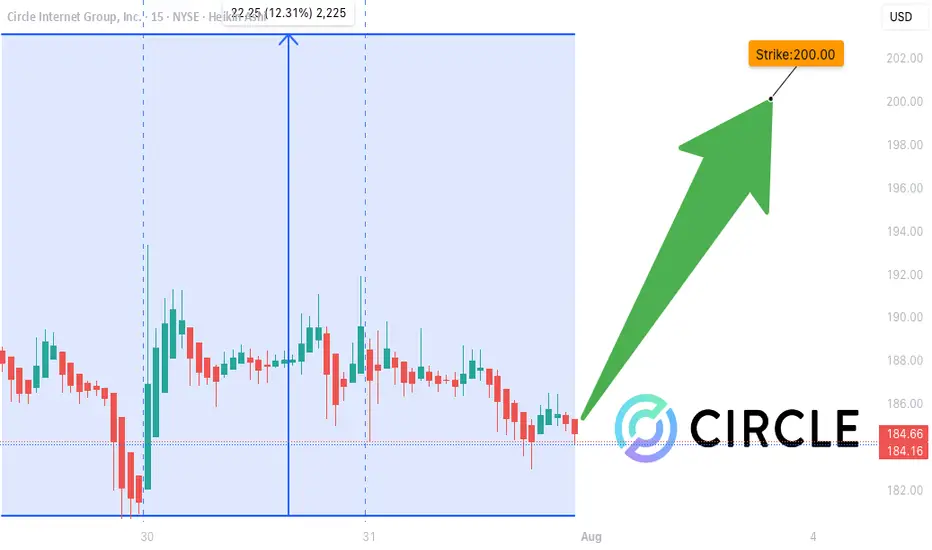
CRCL WEEKLY TRADE SIGNAL (JULY 31)
### 🚨 CRCL WEEKLY TRADE SIGNAL (JULY 31) 🚨
**Call Option Setup – Based on Multi-Model Consensus**
📈 **Momentum**:
🟡 RSI Daily: 46.7 (Neutral)
🟥 Volume: 0.4x last week = 🚨 Weak participation
🟢 Options Flow: Bullish (C/P Ratio = 1.42)
🌤️ VIX: Low (15.4) → Low volatility = 💰 opportunity
🔍 **Model Summary**:
✅ **Grok**: Bullish setup → RECOMMENDED TRADE
❌ Claude, DeepSeek, Gemini, Llama: No trade (weak volume + gamma risk)
🤝 ALL agree: Weak volume & mixed trend = caution
---
### 💥 Trade Setup 💥
🎯 **Direction**: CALL (Bullish bias)
💸 **Strike**: \$200
💰 **Entry**: \$0.85
📆 **Expiry**: Aug 1 (1DTE – high gamma 🔥)
🎯 **Profit Target**: \$1.11
🛑 **Stop Loss**: \$0.51
📊 **Confidence Level**: 65%
📍 **Entry Timing**: Market Open
---
### 🧠 Key Insight
📉 Weak volume = 🚫 no institutional conviction
📈 Bullish options flow = 🔥 potential short squeeze
🕓 Time-sensitive 1DTE = Fast hands needed!
---
👉 If you trade momentum, watch CRCL at open.
🧠 **Strategy**: scalp the move or exit near \$1.11
💥 High risk, high gamma, tight leash.
\#OptionsFlow #CRCL #CallOption #TradingSignal #UnusualOptionsActivity #0DTE #GammaScalp #TradingView #SwingTrade #TFlow
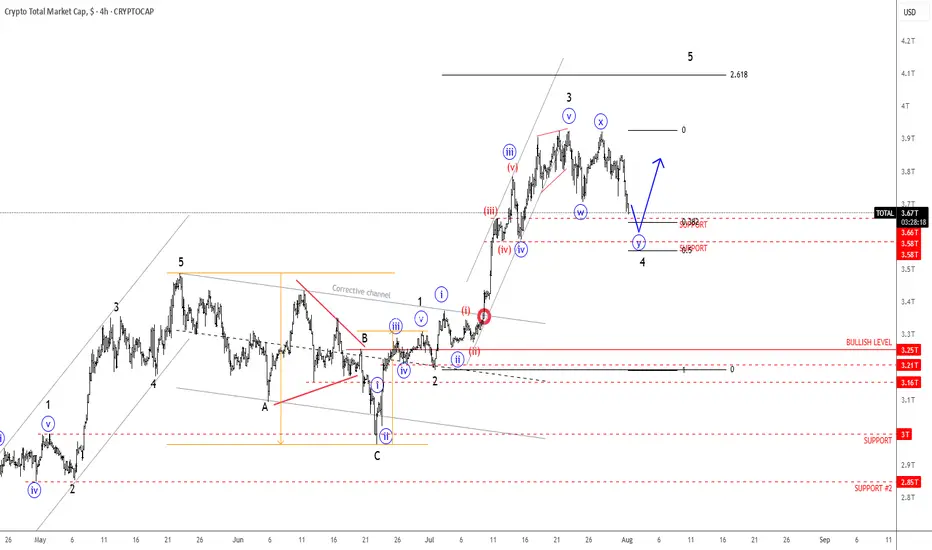
Crypto Market Slows Down For A Pullback Within A Bullish TrendGood morning Crypto traders! Cryptocurrencies are coming slightly lower on the intraday basis due to stock market decline yesterday, but we still see them approaching support, so still be aware of a bounce and recovery at the end of the week or maybe next week because of an upcoming weekend. Crypto TOTAL market cap chart can be trading in wave »y« of a complex w-x-y correction in wave 4, unless it's a flat correction, but support is the same at 3.6T – 3.5T area, from where we may see a bullish continuation within wave 5.
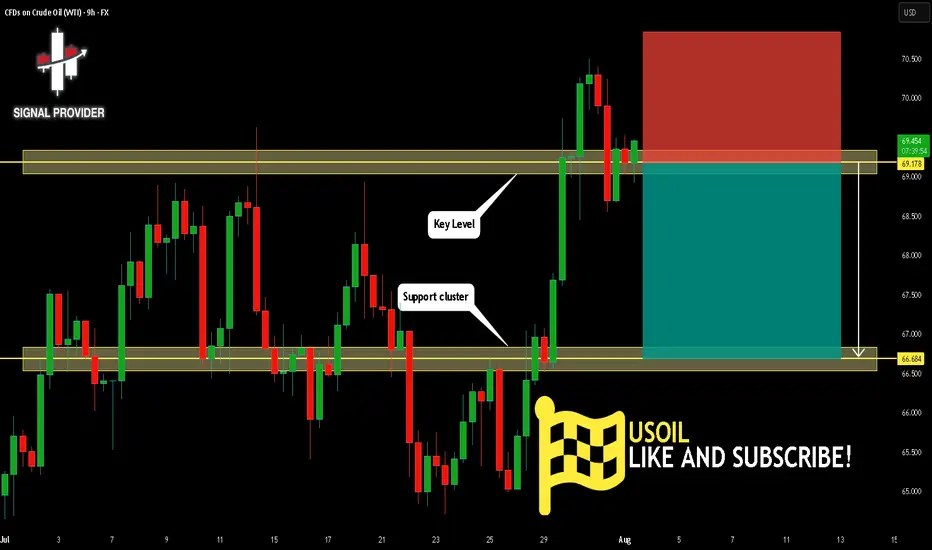
USOIL Is Bearish! Short!
Please, check our technical outlook for USOIL.
Time Frame: 9h
Current Trend: Bearish
Sentiment: Overbought (based on 7-period RSI)
Forecast: Bearish
The market is approaching a significant resistance area 69.178.
Due to the fact that we see a positive bearish reaction from the underlined area, I strongly believe that sellers will manage to push the price all the way down to 66.684 level.
P.S
The term oversold refers to a condition where an asset has traded lower in price and has the potential for a price bounce.
Overbought refers to market scenarios where the instrument is traded considerably higher than its fair value. Overvaluation is caused by market sentiments when there is positive news.
Disclosure: I am part of Trade Nation's Influencer program and receive a monthly fee for using their TradingView charts in my analysis.
Like and subscribe and comment my ideas if you enjoy them!
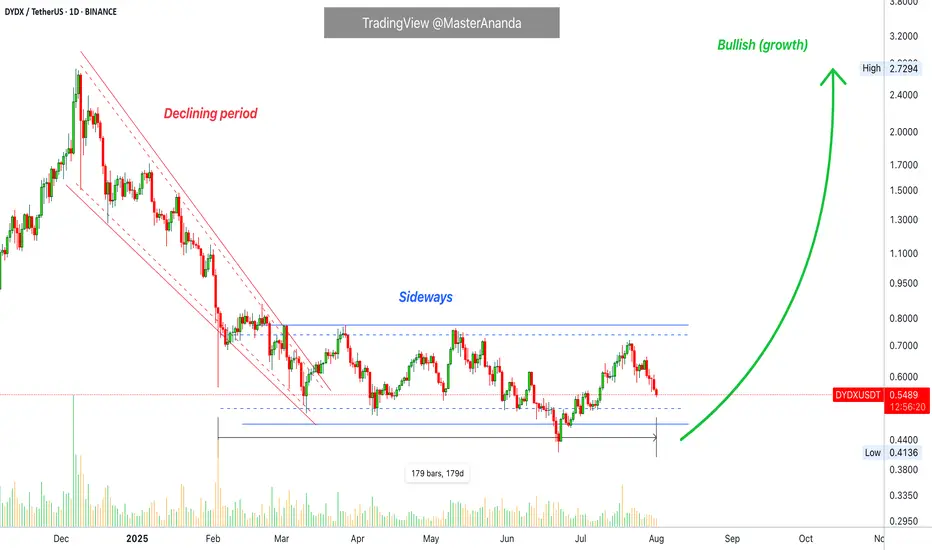
dYdX Bottom Consolidation Continues, Bullish NextHere you are looking at the formation of a bottom. The formation is a process not a single day event. It can take months for a bottom to fully form.
The way you know this to be true is because there is no downtrend. There are no new lows.
DYDX has been sideways now for 179 days, 6 months. Since early February 2025. In just three months, between December 2024 and March 2025, there is a very strong decline; lower highs and lower lows. A bearish move, a down-wave, a downtrend.
Ever since February the downtrend is no more. Rather than new major lows we have shy lower lows and finally not even that, no new lows. You can see the pattern how the market turned from bearish to sideways. This is the transition period. From sideways it will turn bullish, bullish goes next.
This is the point in time when most people will lose patiently and fold at a loss. Sell at the bottom, near support. This is the most important time to be patient, to accumulate, to even buy more and hold because we are looking at bottom prices. When prices are trading at the bottom and you are a bull, you can't go wrong.
Buy and hold. Continue holding because the market will soon turn.
Namaste.
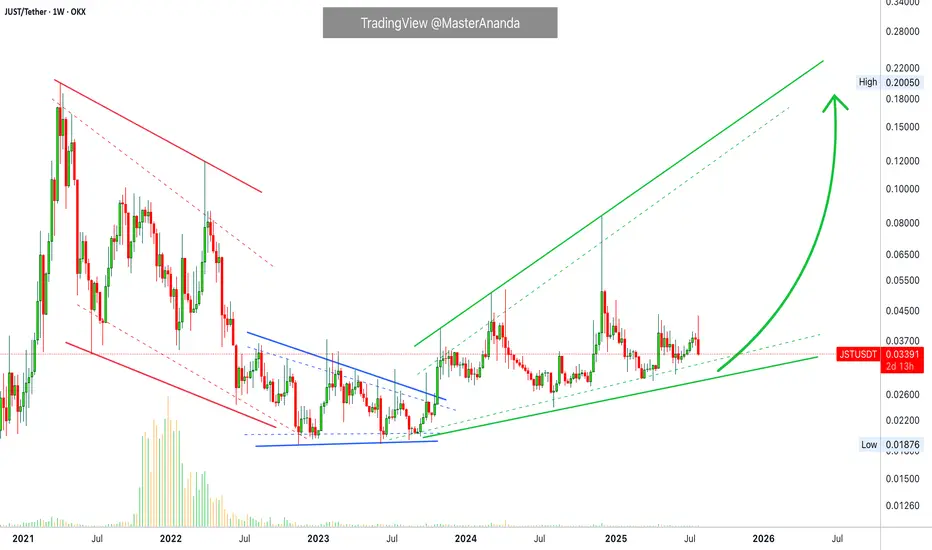
JUSDT Short-Term Retrace vs Long-Term UptrendJST is not trading at bottom prices because the low was hit November 2022, but the bigger picture still looks like a long-term consolidation pattern. Sideways for years, this precedes a major bull market.
Good morning my fellow Cryptocurrency trader, I hope you are having a wonderful day.
JSTUSDT is looking weak short-term but we know this to be part of the same process, the one that has been going on for years. Higher lows and higher highs but still no major bullish wave, it is getting closer though because the market can only consolidate for so long.
JST has been rising. The high December last year (2024) hit the highest prices since March 2022, the month when the previous bear market breakdown took place.
The red period is the bear market. Notice how it ends when the downtrend is no more and the market turns blue, sideways. After this period comes green and this is where we are now.
Within the bullish period we also have retraces and corrections. Right now we have a bearish move, short-term, within a wider bullish move, an uptrend long-term. This is the normal and classic market fluctuations; prices moving down and up, up and down, back and forth, every day.
The end of the short-term move will result in the continuation of the bigger move, the uptrend. We should expect a higher low followed by a strong higher high next. The next higher high comes in late 2025, now.
Thank you for reading.
Namaste.
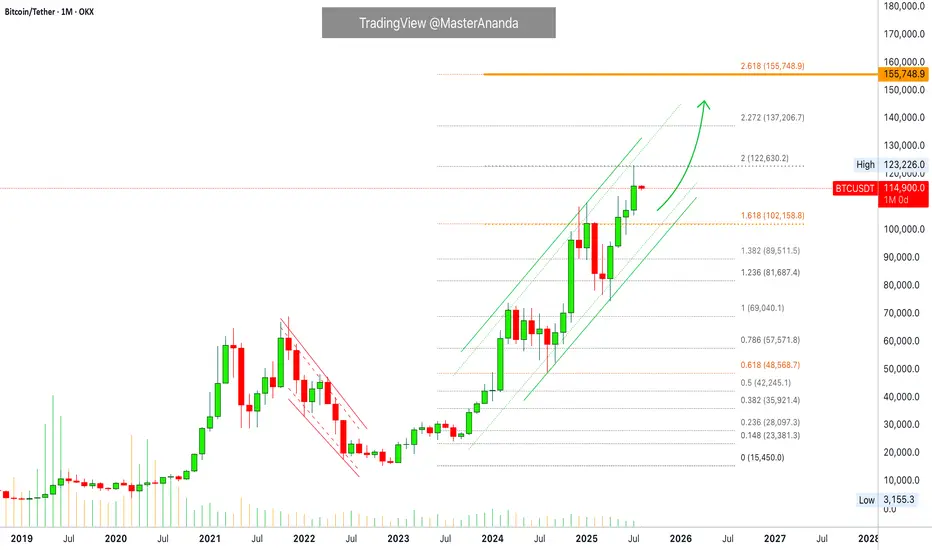
Bitcoin Monthly · Parabolic Rise ContinuesLast month Bitcoin produced its best numbers ever. The highest wick and close, a new all-time high at $123,226.
Bitcoin is not exhausted on the monthly timeframe but there is room for a retrace before the month ends. Think of the first part of the month being mixed, neutral or even bearish while the second half becomes full time bullish.
The levels that are relevant are $122,000 on the bullish side and $102,000 on the low. Right now the action is happening close to the middle so anything goes.
In 2020 Bitcoin produced 7 monthly candles growing and this was repeated again in 2023. In 2025 we have so far four green candles which means that Bitcoin can easily continue to grow. It has been known to produce more than four months green many times but there can be exhaustion at some point.
Bitcoin has been moving within a strong uptrend and is likely to continue rising. Bullish until the chart says otherwise. We are going up. Short-, mid- and long-term.
As Bitcoin consolidates near resistance, the altcoins will continue to build strength in order to grow. Remember, we are still looking at bottom prices across thousands of altcoins. Only a few moved ahead and are trading at all-time highs, the rest will catch up. The time is now, late 2025. The best is yet to come.
Namaste.
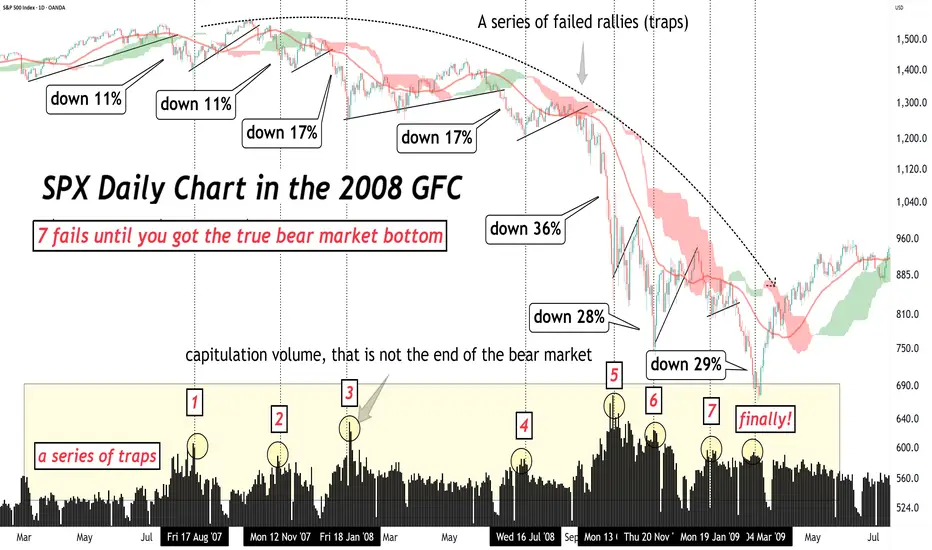
The worst drops often come later!Don’t be fooled by the first crash… The worst drops often come later in a bear market.
Let’s break down the brutal truth about the 2008 GFC and what it teaches us today. 🧵
1.
In the 2007–2009 bear market, the S&P 500 had 7 failed rallies before finally bottoming.
Every bounce looked like the bottom — and every one was a trap.
👇
2.
The early drops were steep:
🔻 Down 11%
🔻 Down 17%
But the most violent crashes came after those…
Near the END — not the beginning — of the bear market.
3.
Later stage declines:
❌ Down 28%
❌ Down 36%
❌ Down 29%
That’s when capitulation kicked in.
Investors gave up. Fear took over.
4.
Capitulation volume isn’t a guaranteed bottom.
It feels like it’s over.
But if fundamentals haven’t turned and the trend isn’t broken, the bear can still bite — hard.
5.
Final crashes are like cliffs:
Markets are exhausted.
Hope is crushed.
And that’s finally when the real bottom shows up.
6.
The lesson?
Bear markets are full of traps.
Relief rallies can fool even seasoned pros.
Stay patient. Wait for trend confirmation. Don’t chase fake bottoms.
7.
📉 The biggest crashes usually happen at the end of the bear market.
That’s the final flush — and it sets the stage for true opportunity.
Learn from the past. Don’t get trapped. Stay sharp.
Ethereum - The moment of truth!🔬Ethereum ( CRYPTO:ETHUSD ) trades at a key breakout level:
🔎Analysis summary:
Ethereum - after consolidating for the past four years - is once again retesting the previous all time high. And before we will witness another bearish rejection, Ethereum has the chance to finally break out of the long term triangle pattern. It's time for us to start praying.
📝Levels to watch:
$4.000
SwingTraderPhil
SwingTrading.Simplified. | Investing.Simplified. | #LONGTERMVISION

Possibility of Ethereum moving toward the \$3,330 price range.Considering the breakout of the 4-hour channel and confirmation of the downtrend, reaching the \$3,330 level is not out of the question.
This target was derived using a pattern-based projection from the channel breakout.
I’ve personally taken this position, but I’m not recommending it — just sharing for informational purposes.